More Related Content Similar to Annie Williams Real Estate Report - August 2021 (17) More from Annie Williams (11) 1. momentum for condos/lofts fell 0.8 of a
point to –4.3.
Our momentum statistics are based on
12-month moving averages to eliminate
monthly and seasonal variations.
If you are planning on selling your property,
call me for a free comparative market
analysis.
The median sales price for single-family,
re-sale homes fell 5.1% in July from
June. Nevertheless, it rose 11.4% year-
over-year.
The average sales price for single-family,
re-sale homes fell 7.5% month-over-
month. Yet, year-over-year it was up
9.7%.
Sales of single-family, re-sale homes
rose again in July, up 14.1% year-over-
year. Sales were down 20.8% from June.
There were 243 homes sold in San
Francisco last month. The average since
2000 is 214.
The median sales price for condos/lofts
was down 6% year-over-year.
The average sales price was down 5.8%
year-over-year.
Sales of condos/lofts rose 35.4% year-
over-year. There were 352 condos/lofts
sold last month. The average since 2000
is 230.
The sales price to list price ratio, or what
buyers are paying over what sellers are
asking, rose from 111.9% to 113.9 % for
homes. The ratio for condos/townhomes
fell from 105.1% to 104.6%.
Average days on market, or the time from
when a property is listed to when it goes
into contract, was 18 for homes and 40
for condos/lofts.
for homes rose 0.7 of a
point to +35.1. Sales
momentum for
condos/lofts was up 0.9
of a point to +42.5.
for single-family homes
rose 0.5 of a point to
+6.4. Pricing
Sotheby's International Realty
117 Greenwich Street
San Francisco, CA 94111
Cell: (415) 819-2663
AnnieWilliamsSF@gmail.com
http://www.anniewilliamshomes.com
Annie Williams
ANNIE WILLIAMS | ANNIEWILLIAMSSF@GMAIL.COM | HTTP://WWW.ANNIEWILLIAMSHOMES.COM
Jul 21 Month % Jun 21 Year % Jul 20
Median Price: 1,850,000
$ -5.1% 1,950,000
$ 11.4% 1,660,000
$
Average Price: 2,284,707
$ -7.5% 2,469,058
$ 9.7% 2,082,541
$
Home Sales: 243 -20.8% 307 14.1% 213
Sale/List Price Ratio: 113.9% 1.8% 111.9% 9.7% 103.8%
Days on Market: 18 0.0% 18 -30.1% 26
(Condominiums)
Jul 21 Month % Jun 21 Year % Jul 20
Median Price: 1,192,500
$ -4.6% 1,250,000
$ -6.0% 1,268,200
$
Average Price: 1,326,645
$ -3.9% 1,380,256
$ -5.8% 1,408,069
$
Condo Sales: 352 -21.4% 448 35.4% 260
Sale/List Price Ratio: 104.6% -0.5% 105.1% 4.2% 100.4%
Days on Market: 40 14.3% 35 7.0% 37
Trends at a Glance
(Single-family Homes)
0
10
20
30
40
50
60
70
80
90
1
0
A J O 1
1
A J O 1
2
A J O 1
3
A J O 1
4
A J O 1
5
A J O 1
6
A J O 1
7
A J O 1
8
A J O 1
9
A J O 2
0
A J O 2
1
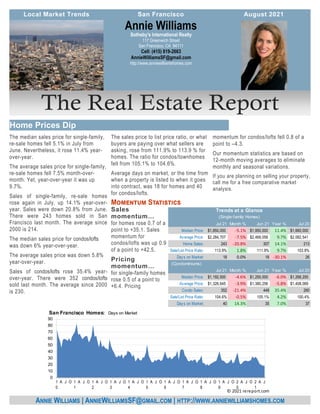
A J
San Francisco Homes: Days on Market
© 2021 rereport.com
2. July 30, 2021 -- The Federal Reserve held its mid-
summer meeting this week. No policy changes were
expected, and none came to surprise the markets.
The Fed did note that since December 2020, the
economy has "made progress" toward the central
bank's goals of full employment and core inflation
that averages 2% over time, but at the post-meeting
press conference Fed Chair Powell said that there
remains "some ground to cover" in regard to reaching
these outcomes.
The Fed continues to expect that the significant out-
break of price pressure will prove transitory, simply
stating that "Inflation has risen, largely reflecting tran-
sitory factors" in the statement that closed the meet-
ing. At the press conference, Mr. Powell could not
provide a sense of how long a transition to more
benign inflation we might expect, noting that the Fed
does "not currently have much confidence in the
timing" of when inflationary pressures will subside.
The Fed's bond buying programs help to improve
liquidity in financial markets, and help to keep long-
term interest rates lower than they might otherwise
be. MBS purchases by themselves are probably
helping mortgage rates to be perhaps an eighth of a
percentage point or so lower than they would be
absent this direct manipulation. Those lower mort-
gage rates have helped to fuel a very strong housing
market that has been beset by shortages of home to
buy and sharply rising costs.
These effects of course don't happen in a vacuum.
As we expected at the turn of the year, sales of new
homes have settled back to trend after a fairly hot
stretch to close 2020. Prices of new homes hit a
record high a month ago, and with mortgage rates
mostly steady, affordability has taken a bit of a hit. As
well, much new construction takes place at distances
farther from center cities, where most of the jobs are,
and with companies now starting to call folks back
from remote outposts and into offices, commuting
distances may again be a greater consideration when
contemplating a move to a new construction home.
In June, sales of new homes declined by 6.6%, fall-
ing to a 676,000 annualized rate of sale. May sales
were revised down, too, to 724K, and the trend in
sales has been generally softer since a December
peak. Supplies of homes are not an issue in the new
construction market; presently, there are about 6.3
months of supply available, with the 353,000 actual
units the highest figure since December 2008. If
(Continued on page 4)
ANNIE WILLIAMS
SOTHEBY'S INTERNATIONAL REALTY
ANNIEWILLIAMSSF@GMAIL.COM
The chart above shows the National monthly
average for 30-year fixed rate mortgages as
compiled by http://www.freddiemac.com/.
1.0% 2.0% 3.0% 4.0% 5.0% 6.0%
01-10
07-10
01-11
07-11
01-12
07-12
01-13
07-13
01-14
07-14
01-15
07-15
01-16
07-16
01-17
07-17
01-18
07-18
01-19
07-19
01-20
07-20
01-21
07-21
30-Year Fixed Mortgage Rates
0
50
100
150
200
250
300
350
$300
$800
$1,300
$1,800
$2,300
$2,800
1
0
A J O 1
1
A J O 1
2
A J O 1
3
A J O 1
4
A J O 1
5
A J O 1
6
A J O 1
7
A J O 1
8
A J O 1
9
A J O 2
0
A J O 2
1
A J
San Francisco Homes: Sold Prices & Unit Sales
(3-month moving average — $000's)
Ave Med Units © 2021 rereport.com
Unit
Median Average Sales DOM SP/LP Median Average Sales Median Average Sales
San Francisco $1,850,000 $2,284,707 243 18 113.9% 11.4% 9.7% 14.1% -5.1% -7.5% -20.8%
D1: Northwest $2,900,000 $2,818,299 13 5 74.3% 56.9% 26.3% -31.6% 28.9% 14.6% -48.0%
D2: Central West $1,820,000 $1,957,820 51 11 130.5% 25.5% 21.7% 75.9% -1.0% 1.9% 2.0%
D3: Southwest $1,600,000 $1,703,643 14 18 112.3% 36.8% 41.3% 7.7% 13.9% 16.6% -6.7%
D4: Twin Peaks $1,912,500 $2,051,079 28 20 116.0% 16.8% 12.0% -3.4% -11.0% -13.3% -42.9%
D5: Central $2,901,000 $3,259,669 38 17 109.0% 21.1% 29.7% -15.6% -6.8% -7.0% -17.4%
D6: Central North $4,800,000 $4,911,250 4 13 101.5% 84.6% 83.6% -20.0% 115.7% 12.6% -20.0%
D7: North $4,000,000 $4,391,333 15 24 102.1% -6.3% -16.7% 36.4% -26.8% -29.1% -31.8%
D8: Northeast $2,850,000 $4,383,333 3 55 106.3% -32.3% 4.1% 50.0% n/a n/a n/a
D9: Central East $1,795,000 $1,992,250 30 17 118.0% 4.1% 9.4% 20.0% 5.5% 11.5% -9.1%
D10: Southeast $1,200,000 $1,172,678 47 26 118.4% 0.0% -2.0% 51.6% -7.8% -7.0% -9.6%
July Sales Statistics
(Single-family Homes)
Prices Yearly Change Monthly Change
3. ANNIE WILLIAMS
SOTHEBY'S INTERNATIONAL REALTY
ANNIEWILLIAMSSF@GMAIL.COM
80.0%
85.0%
90.0%
95.0%
100.0%
105.0%
110.0%
115.0%
120.0%
1
0
A J O 1
1
A J O 1
2
A J O 1
3
A J O 1
4
A J O 1
5
A J O 1
6
A J O 1
7
A J O 1
8
A J O 1
9
A J O 2
0
A J O 2
1
A J
San Francisco Homes: Sales Price to List Price Ratio
© 2021 rereport.com
-30.0
-20.0
-10.0
0.0
10.0
20.0
30.0
40.0
0
6
A J O 0
7
A J O 0
8
A J O 0
9
A J O 1
0
A J O 1
1
A J O 1
2
A J O 1
3
A J O 1
4
A J O 1
5
A J O 1
6
A J O 1
7
A J O 1
8
A J O 1
9
A J O 2
0
A J O 2
1
A J
San Francisco Homes: Sales Momentum
Sales Pricing © 2021 rereport.com
0
100
200
300
400
500
$300
$500
$700
$900
$1,100
$1,300
$1,500
1
0
A J O 1
1
A J O 1
2
A J O 1
3
A J O 1
4
A J O 1
5
A J O 1
6
A J O 1
7
A J O 1
8
A J O 1
9
A J O 2
0
A J O 2
1
A J
San Francisco Condos: Sold Prices & Unit Sales
(3-month moving average — $000's)
Ave Med Units © 2021 rereport.com
Unit
Median Average Sales DOM SP/LP Median Average Sales Median Average Sales
San Francisco $1,192,500 $1,326,645 352 40 104.6% -6.0% -5.8% 35.4% -4.6% -3.9% -21.4%
D1: Northwest $1,322,500 $1,398,500 16 10 118.2% -1.5% -0.4% 14.3% -13.8% -11.8% -20.0%
D2: Central West $1,372,500 $1,246,072 7 30 145.7% 1.1% -9.5% 16.7% 9.4% 1.8% 16.7%
D3: Southwest $710,000 $710,000 2 19 106.9% -27.0% -27.0% 0.0% -24.1% -33.0% -71.4%
D4: Twin Peaks $895,000 $1,045,000 5 24 108.1% 32.6% 22.4% 0.0% 23.4% 3.6% 66.7%
D5: Central $1,420,000 $1,427,198 50 21 111.7% -3.7% -3.2% 6.4% -4.7% -1.0% -20.6%
D6: Central North $1,274,100 $1,391,650 39 28 109.9% 7.5% 14.8% 77.3% -10.8% -6.0% -31.6%
D7: North $1,565,000 $1,745,713 40 25 104.1% -7.9% -11.3% 29.0% 3.1% -0.7% -13.0%
D8: Northeast $987,500 $1,090,625 66 48 99.6% -17.5% -26.2% 73.7% -3.7% -18.2% -5.7%
D9: Central East $1,092,500 $1,300,878 118 57 100.1% -2.5% 1.7% 45.7% -0.7% 1.7% -28.0%
D10: Southeast $915,000 $834,714 7 59 105.3% -6.0% -14.2% 40.0% 20.4% 4.0% -36.4%
July Sales Statistics
(Condos/TICs/Co-ops/Lofts)
Prices Yearly Change Monthly Change
4. Annie Williams
Sotheby's International Realty
117 Greenwich Street
San Francisco, CA 94111
sales don't pick up, it seems likely that home build-
ing will start to settle back a bit, although the funda-
mentals for housing remain solid. At least prices of
new housing stock eased a bit, sliding about 5%
from May's record high to $361,800 in June. Re-
treating lumber prices probably helped a bit here.
Existing home sales have been beset by inventory
issues for an extended period of time. There is
plenty of demand but supply continues to only
come onto the market at a metered pace,
keeping sales from rising. In turn, this
limited supply has sparked strong in-
creases in the costs of existing homes,
and with mortgage rates no longer falling
to help offset these increases, some buy-
ers are no doubt retreating to the side-
lines to await more favorable conditions.
Reflecting this, the National Association
of Realtors Pending Home Sales Index
retreated by 1.% in June from May, and
this indicator of contracts signed for the
purchase of an existing home saw de-
clines in 4 of the first 6 months of 2021.
With the "spring homebuying season"
fading in the rearview mirror, it seems
unlikely that a new flare for purchases will
(Continued from page 2) come anytime soon, but steady demand should
continue for a good while yet.
Applications for mortgage credit responded to the
recent dip in mortgage rates, rising by 5.7% in the
week ending July 23. The Mortgage Bankers Asso-
ciation reported that requests for purchase-money
mortgages declined by 1.6% -- the trend here pretty
soggy for the past month -- but requests for refi-
nancing kicked 9.3% higher, a second strong
bounce in the last three weeks. Mortgage rates are
not only closer to record lows than not, but Fannie
Mae and Freddie Mac dropping the "adverse mar-
ket refinance fee" starting August 1 helps to pass
lower costs to homeowners, too.
2009 2010 2011 2012 2013 2014 2015 2016 2017 2018 2019 2020 2021
Condos 943 1,426 1,549 1,817 1,905 1,852 1,719 1,564 1,659 1,817 1,703 1,219 2,586
Homes 1,074 1,368 1,389 1,474 1,626 1,323 1,501 1,430 1,250 1,264 1,252 961 1,629
0
500
1,000
1,500
2,000
2,500
3,000
3,500
4,000
4,500
Property Sales
(Year-to-Date)
© 2021 rereport.com