SlideShare a Scribd company logo
1 of 21
NUMERICAL MODELS AS MITIGATION MEASURES FOR RIVERINE AND URBAN FLOOD
 Riverine Flood
 Urban FlashFlood
Hydraulic (Numerical ) ModelsforRiver Flow ModellingandFloodInundation Simulation:
1. MIIKE FLOOD(coupled1D&2 D modelling)
2. MIKE 21 (2D-Modelling)
3. MIKE 11 (1D-Modelling)
4. MIKE Urban/MOUSE (Urban/FlashFloodStudy)
5. HEC-RAS (1D-Modelling)
6. ISIS_1D (1D-Modelling- Limited)
7. ISIS_2D (1D-Modelling- Limited)
8. Delft3D (1D-2D-3D modelling)
Hydrological modelsforrainfall-runoff include:
1. MIKE-SHE and NAM
2. HEC-HMS
3. SWAT
4. WMS
5. JAMS 2000
6. VIC
7. SRM (forSnowmelt Runoff)
FloodForecastinganddecisionsupportapplications
1. MIKE FLOODWATCH
2. DELTARES FEWS (FLOODEARLY WARNINGSYSTEM)
A brief descriptionof fewrobustmodelsalongwiththeirworkingmethodologyismentionedin
subsequentsections.
Freeware/Opensource
Commercial packages
Freeware/Opensource
Commercial package
MIKE FLOOD
INTRODUCTION
MIKE FLOOD isa tool that integratesthe one-dimensional modelsMIKEURBAN,MIKE 11 and the two-
dimensional modelMIKE21 intoa single,dynamicallycoupledmodellingsystem.Thiscoupledapproach
enablesthe bestfeaturesof bothaone -dimensional andtwodimensional modelstobe utilized,whilst
at the same time avoidingmanyof the limitationsof resolutionandaccuracy encounteredwhenusing
MIKE 11, MIKE URBAN or MIKE 21 separately.
FewModel Applicationsinclude:
 Floodplainapplications
 Storm surge studies
 Urban drainage
 Dam break
 Hydraulicdesignof structures
 Broad scale estuarine applications
SETTING UP MIKE FLOOD
MIKE FLOOD isa combinationof MIKE11/MOUSE andMIKE 21. Hence the individualmodels shouldbe
setupseparately,then joinedtogetherusingMIKEFLOOD.
MIKE 11 SETUP
A brief descriptionof modellingstepsisprovided withreferences/snapsfromstudyof few floodprone
North-Easternplaces.
The prerequisiteinanymodellingispreparation of the inputfiles.In DHI_MIKE models,the MIKEZERO
interface isprovidedforall inputfile preparation,projectsetupand organizing.
Figure 1 MIKE ZERO interface on New File creation
The basic filesneeded inMIKE11 Simulation are:
1. Simulation file(.sim11)
2. RiverNetworkfile (.nwk11)
3. Cross-sectionfile(.xns11)
4. BoundaryConditionfile (.bnd11)
5. Parameterfiles (Hydrodynamic,Rainfall-runoff,Advection-dispersion,SedimentTransport)
The firststepis the creationof a simulationfile(.sim11),whichcombinesall informationnecessaryto
performa simulation.Thisinformationcomprisestype of model torun,name andlocationof inputdata
files,simulationperiod,time step,etc.andname of resultfiles. Foreasy andsystematicworkinga
projectshouldbe createdinitiallywithblanknetworkeditors,cross-sectioneditors,boundaryfileand
parameterfilesandlinkingtheminthe Simulationfile.
Rivercan be manuallydigitizedorimportedfromshapefilescreatedinGISsoftware.Suitable numberof
nodesare createdin the processto whichthe rivercross-sectionsfromsurveydataor DEM can be
linked.The cross- sectioneditoristobe createdin the processwhere the cross-sectionsareadefined.
Figure 3 Network editor with main interface, tabular view and longitudinal profile view
RiverLine
Connected
Cross-sections
RiverNode
Figure 2 River nodes, lines and X-sec connected in Network Editor
TabularView
Main screen
with nodes
and riverline
Longitudinal profile
view
Due to unavailabilityof riverbed surveydatamostof the time,automaticcross-sectionextractionfrom
DEM data isfollowed.Thiscanbe done MIKE GIS,HEC-GeoRASor otherGIS tools.
Figure 4 Cross-section extraction using HEC-GeoRAS
Rivercross-section file containstwodatasets,raw and tabular. The raw data describesthe physical
shape of a cross-sectionusing(x,z) co-ordinates.The processeddata iscalculatedfromthe raw data and
containscorrespondingvaluesforlevel,cross-sectionarea,flow width,hydraulic/resistanceradius.
Also,eachcross-sectionisdefineduniquelybythe followingthree keys:
 RiverName
 TOPOID
 Chainage
ProvisionisgivenforuserdefinedDatum, definingresistance type anddistribution.Alsobankmarkers,
bedmarkersand userdefinedmarkersare providedtospecifythe banklines,resistance distribution
(channel andfloodplain).
The riverBoundary Editorscomprisesof the Time serieseditor (.dfs0) andboundaryeditor(.bnd11).
Times series of discharge,waterlevel,wind,temperature,etccanbe definedinthe time seriesfile at
specifiedintervalsorrandomperiods.
Boundarieslike open,closed,pointsource ,structuresordistributedsource canbe definedinthe
boundaryeditor.Also,boundarycanbe definedastype inflow,waterlevel,Q-h,etc.
HEC-GeoRAStoolbarinArcGIS
Cross-sectionalview
Figure 5 Time Series editor showing discharge-stage timeseries
Finally,the parameterfilesneedtobe createdwhichwill dependonthe type of computation.The MIKE
parametereditorsare -
 Hydrodynamic
 Advection-dispersion
 Water Quality
 SedimentTransport
 Rainfall-Runoff
For general floodmodelshydrodynamicmodule issufficient i.e.the HDparameterfile. Rainfall-runoff
module isnecessaryif we needacombinedhydrologicandhydrodynamic computation.Similarly,for
snowcharacteristicswe will need toincludethe ice parameter.
The HD parameterfile containsinitial conditionsforthe hydrodynamicsimulation.Thisincludes initial
waterlevel/depthanddischarge whichcanbe put as constantvalue or stage /discharge hydrographs.
The final stepis specifyingthe time step ,simulationstartandend date,the resultfile andvalidationof
the simulation.Anyerrorsinthe correspondingfileswill be mentionedinthe validationpage.
Aftercompletionof the simulationthe resultscanbe viewedusingMIKEView or MIKE ResultViewer.
MIKE 21 SETUP
Afterfinishingthe 1Dsetupwe needtosetupa 2D model forthe studyarea. The inputsneededforthe
purpose are-
 DEM data/Topographicsurveydata
 Bathymetric/riverdepthsurveydata
Properties
page
 Discharge hydrographsorDischarge-stage hydrographs(bothupstream&downstream)
- optional feature if settingupaMIKE FLOODmodel
 Precipitation/Evaporation data(optional)
 Resistance (Manning/Chezy)
 Winddata (optional)
 Structure data/types/locations(optional)
The firststepis identificationof the studyareaand clipping the imageriesandDEM insuitable GIS
software.MIKE21 supports *.dfs2 formatfiles,hence conversionof DEMto Ascii formatisessential
whichcan furtherbe convertedto *.dfs2 formatusingMIKE ZeroToolbox. Itis to be notedthatthe Raw
DEM usedshouldbe hydrocorrected to minimizeeffectsof sinksinthe data.
The primaryinputfor the simulationisBathymetry file,whichisingeneral termsisthe Topographicfile
combinedwiththe bathymetricsurveydata.Extreme care shouldbe takenwhilepreparationof the
bathymetricfile asaccuracyand stabilityof the whole setupdependsonthis. Some basicoperationsto
be usedinthe bathymetricfile include-
 Importinghighresolutionimageriesforproperstudyof the landuse and modifying the
DEM accordingly
 Importriver,banksand cross-sectionshapefilesfromMIKE11 setup
 Importbuildingslayerandsettinglandvalue inthe areas(forurbanflooding)
 Remove noise andotherDEMimperfectionsusinginbuiltfilteringtechniques
 Merge the riverbeddata withtopographicdata
 Correct suddenchanges of riverslope andbankswhichusuallyoccursdue toDEM
errors. Finallyenclosethe studyareawithgridlinesfilledwithlandvalues
Figure 2 Bathymetric file of Bharalu river near Zoo Road, Guwahati using CARTOSAT 1m hybrid DEM and Cartosat imagery as
background layer
Simulation in MIKE 21
 Module selection:MIKE21 Simulationconsistsof firstselectingthe suitablemodule.Forflood
inundationstudywe needto selectthe Hydrodynamicmodule.
 Bathymetry: The nextstepisspecifyingthe bathymetryfile.There isadditional optionof
providingafine bathymetrytostudyindetail aparticulararea.Thus a fine DEMis enclosedina
coarse DEM. Normallycoldstartprocedure isfollowed.Hotstartfacilityisnecessaryif we want
to run multiple simulationswithsimilarinitial conditions. CoriolisforcingisnotnecessaryforHD
withoutwindconditions.
 Simulationperiod:
Timestepcanbe minimum0.5 to anyas specifiedbyuser.Highertime stepdecreasessimulation
time significantly butthere isdecreaseinstabilityof the model due tothe increase incourant
numberfactor. The courantnumberisdefinedas -
CR = c (Δt/Δx)
where, c=celerity,Δtistime stepandΔx isthe gridspacing
The courant numberactuallyexpresseshow manytime stepthe informationmovesinone
timestep. Forflowstabilitycourantnumbershouldbe below 1,butnumbersupto5 isallowed
dependingonthe bathymetry.Smootherbathymetriescan have highercourantnumbers.
The warm-upperiodis a numberof time stepsoverwhichthe forcingfunctionsare gradually
increasedfromzeroto100% of theirtrue value.Model instabilityatinitialperiodcanbe
correctedby increasingthisvalue.
 Boundary: The boundaryconditionsneedstobe specifiedforthe upstreamanddownstream
reach.This can be discharge hydrographor stage hydrograph or constantdischarge/waterlevel.
For MIKE FLOOD simulationwe usuallykeepthe boundariesclosed.
 Source and Sink: Source and sinkpointscanbe specifiedcombinedorisolated.Sourcesare
pointsfromwhere constantspecifiedinflowinoccurring.Sinksare pointsforsuckingout
specifiedinflowoutof the model ata constantrate. Up to 256 source and sinkpointsare
allowedinthe model. Source andsinkpointsshould notbe placed onlocationswhichmightdry
out as itwill make the model unstable.
 Floodingand drying : For accuracy the floodinganddryingfacilityisintroducedinthe MIKE21
module. Dryingdepthis the minimumwaterdepthallowedinapointbefore itistakenoutof
calculation,andfloodingdepthisthe waterdepthatwhichthe pointwill be reenteredintothe
calculation. Infloodplainapplicationsgenerallydryingdepthof 0.005-0.1 and floodingdepthof
0.01-0.2 is used.
 Initial surface elevation:Inmanyfloodplainapplicationsthe initial surface elevationcanbe set
to be a constantvalue.Insome applicationshowever,itisbe necessarytouse an initial spatially
varyingwatersurface that matchesthe actual water distributionandlevelsinthe model domain
at the start of the model simulation.Insome cases,where the initial surface elevationcanbe
assumedtobe at groundlevel,the bathymetryfile mayalsobe usedasinitial surface condition.
 Precipitationand Evaporation: Precipitationandevaporationcanbe specifiedasconstantor
time seriesfile.Intensityisinmm/day.Also,whenusingrainfall,the userassumes100% runoff,
whichmay or maynot be appropriate if significantinfiltrationandstorage canoccur inthe soil
or groundmaterial. Double precisionmode isneededtocalculate appropriatelysmall
incrementsof rainfall andaccumulation.
 Eddy Viscosity: The eddyviscosity canbe specifiedasconstant,Smagorinskyornil. Also,types
can be flux basedorvelocitybased.But Smagorinsky andvelocitybasedcreates stability
problem,hence usuallyconstantflux basedviscosityisused. Also,if levels/velocityshowstoo
frequentchange,itshouldbe increased.
 Resistance/BedFriction:Two typesof resistance constantsnamelyManning orChezyisused.
Thiscan be definedconstantoverthe areaordifferentbasedonlanduse/landcovermaps. It
shouldbe notedthatMIKE 21 takesinverse of resistanceconstants,i.e. aManningresistance of
0.025 isusedas 40. Manning'sresistance increasesthe CPUtime ascalculationshappenin
h^(1/6) foreach grid.Chezytakescomparativelylessertime.Itshouldbe notedthatwithlow
resistance there isincrease inmodelinstability.
 Finallythe resultfile needstobe specified. The outputitemconsistsof Waterlevel,P-Flux,Q-
Flux, Surface elevation, U-velocity,V-velocity, Stillwaterdepth,ShearstressX-direction and
ShearstressY-direction.The resultcanbe savedas type *.dfs0,*.dfs1and *.dfs2 fileswhichis
defaultfile systemfortimeseries,profileseriesand gridseriesfile. There isoptionof savingat
specifiedtime steptoreduce diskspace.Also,optionallywe canselectandsave onlythose
areas where ourinterestlies.
Figure 6 Dhannsiri river flooding in NNagaland and Guwahati urban flooding study using MIKE 21
MIKE FLOOD Setup
Aftercompletingthe MIKE11 andMIKE 21 setup,the modelsneedtobe linkedusingMIKEFLOOD
couplingfile.Inpresence of MIKEURBAN setup,itcan alsobe linked. Itsgoodpractice to checkthe
individualstabilityof MIKE11 andMIKE 21 setupsas FLOODsimulationcannotrunif 1D-2D setups
cannot runisolated.
The general stepsinthe processare:
1. Create a new*.couple file.
2. As we are linkingMIKE11 and 21 setups,lateral linkcouplingneedstobe done.
3. To use the automatedlateral couplingtool,rightclickonthe maplayoutand choose the option
Linkriverbranch to MIKE21. Inthe dialogthatappears,choose Lateral Link,andselectLeft
bank.In the LinkInfosectioninputthe Rivername (Wamukhra),thenclickonthe TopoID field
and itwill automaticallyinsertTopoID,upstreamanddownstreamchainages.Repeatthisfor
rightbank of the river.Each time whenyouadda link,a new line will be addedinthe dialogjust
above the layout,anda greenline will show upinlayouttoindicate the locationof linkage.
Blocking out river cells:Insome cases(if yourrivercoversmore than one grid cell),cellslyingin
the mainriverbedbetweenthe leftandthe rightleveemaybe blockedout.Thismaybe done
to ensure thatmass isnot double counted.
4. Once we finishaddinglinkage,we shouldgotoLateral linkoptionsinNavigation,thenspecify
parameterslike depthtolerance,Friction,etc.Forasimple model we cankeepother
parametersasdefaultexceptresistance whichwe needtospecify asperourbedmaterial/area
landuse.
5. Finallywe canstart the Simulation fromRunmenu byclickingstartsimulationbutton.
The simulationcantake fewminutestohoursor evendaysdependinguponourstudyarea,
simulationtime,gridsize andselectionof variousparameters (suchasManningor Chezy
resistance).A numberof logfilesare createdinthe process. The detailsof simulationcanbe
checkedfromthese logfiles. Incase of model instabilityalso,errorlogsare createdinthese log
files,whichcanbe referredto make changesand bringstabilityinthe model.
6. Aftersuccessful simulationwe canview the resultsandchecktheiraccuracyusingMIKE Result
ViewerandAnimator(for3Dviewing). Properinterpretationof resultsneed relevantexperience
inthe fieldandknowledgeof hydrodynamics. Special care shouldbe takensothatassumed
parametersdonot have adverse effectonthe waterdepth,flux andvelocity. Also,the final
resultscanbe convertedto*.asc filesorkml/kmzfilesandimportedtoGISor Google Earth for
betterviewing.
RIVER FLOOD MODELLING using HEC-RAS and GeoRAS
HydrologicEngineeringCenter's RiverAnalysisSystem orHEC-RAS inshortisa one-dimensional steady
flowhydraulicmodel designedtoaidhydraulicengineersin channel flow analysisandfloodplain
determination. HEC-GeoRAS isatool forArcGIS for pre and/orpost-processingof GISdataand HEC-RAS
resultsforfloodinundationmapping.
HEC-RASand HEC-GeoRASisfreelyavailablefrom HydrologicEngineeringCenter,U.S.ArmyCorpsof
Engineerswebsite:
http://www.hec.usace.army.mil/
DifferentHEC-GeoRASinstallersare availableforArcGIS 9.3, 10 and10.1. Before installingwe have to
make sure that any oldversionsof HEC-GeoRAS,APFramework,MSXMLor XML Data Exchange Toolsare
properlyuninstalled.
In thistutorial we will explain briefly abasicsetupof HEC-RASmodel usingHEC-GeoRAStoolbarin
ArcGIS.
HEC-GeoRASsetupprocedure:
1. OpenArcMap. HEC-GeoRASwill be loadedasatoolbarinArcMap.
We should alsoactivate the Editortoolbar,Spatial Analystand3D Analyst ,as they will be
neededlater.
2. Create yourWorkingdirectory. Save youremptyArcMap map inyour workingdirectory.
3. The main data inputforcreatingfloodplainsforariverisa digital terrainmodel (DTM)/Digital
Elevationmodel (DEM)
4. We are now readyto create the RAS layersinArcMap, which are usedto create geometricdata
setsthat will be modeledin HEC-RAS.The RASlayerscreatedwill be storedcollectivelyina
GeoDatabase,whichHEC-GeoRAScreatesautomatically.Bydefault,thisGeoDatabase will be
DEM TIN
savedinthe same locationas the ArcMap projectwithwhichyouare workingandwill be given
the same name.
5. To create the RASlayers,onthe HEC-GeoRAStoolbar,selectRASGeometry/Create RASLayers
/ All.We can alsocreate layersone byone selectingonlythe oneswe need. The created layers
will be showninthe Table of ContentsinArcGIS.
6. Nowwe have to digitalize eachindividuallayersusingeditingtoolsinArcMap.
i) StreamCenterline Layer: Thislayerwill be used todigitize (draw)the riverreachnetwork
for the systemyouare studying. Multiple networksof streams canbe digitalizedand
modelled withHEC-GeoRAS
Note:Alwaysdigitizethe streaminthe directionof flow.Thatis,you mustbeginatthe most
upstreamendof the stream,and workyour waydownstreamendingat the outletor
beginningof the nextdownstreamreach.
ii) River Reach Name: Each riverand eachreach withineachrivermusthave a name which
uniquelyidentifiesit.The RiverReachIDtool on the HEC-GeoRAStoolbarwill allowyouto
numberthe reaches. Afterlabelingthe riverreach,openandexamine the attribute tablefor
the rivercenterline “River”.Notice thatmanyof the fieldsinthe attribute table have been
automaticallypopulated.
iii) NetworkConnectivity :Next,we will populate the “ToNode”and“From Node”fieldsinthe
Rivercenterlineattribute table.Fromthe HEC-GeoRAStoolbarselectRASGeometry/
StreamCenterlineAttributes/Topology. Selectthe name of yourstreamcenterlineand
terrainTIN inthe drop-downmenus andthenselectOK.
Next,todetermine the lengthof eachreachand populate the “FromSta”and“ToSta”
fieldsinthe attribute table,fromthe HEC-GeoRAStoolbarselectRASGeometry/
StreamCenterlineAttributes/ Lengths/Stationsfrom the menu.
iv) BankLines Layer : The purpose of creatingthislayeristodistinguishbetween the main
channel of the riverand the floodplains(overbanks) of the river.The banklines will be
createdinsimilarfashionasthe rivercenterlineandalsostartingfromupstream.Contour
linescan alsohelpguide youdigitizethe banklines.
v) FlowpathCenterlines : The flowpath centerline layerisasetof linesthatfollowsthe center
of massof the waterflowingdownthe river.Forthe mainchannel,the streamcenterlineis
the flowpathcenterline.Forthe channel overbanks(floodplains),the flowpathcenterlineis
locatedin the centerof the overbank,andissetslightlyoutsidethe mainchannel banklines.
Note that the widthsof the floodplainsare unknownthusfar.The flowpathcenterlinesare
usedto calculate the downstreamreachlengthsbetweencross-sections.
 SelectRASGeometry/Create RASLayers / FlowpathCenterlines.Anoptionwillbe
shownforcopyingthe streamcenterline asyourmainchannel flowpathline. You
still needtodigitizethe overbankflowpathlinesinthe downstream direction.
 Next,youneedtolabel eachflowpathlineusingthe AssignLine Type tool .
Afterclickingonthe AssignLine Type tool,clickona Flowpaths line,andthen
selectthe correctoption(i.e.,rightorleft) inthe window thatpopsup. Repeatwith
all three flowpaths. Note the rightflowpathisthe line onyourrightif
youwere lookingdownstreamandwaterwashittingyouinthe back.
vi) XS CutLines : Cross-sectional cutlines are usedtodefinecross-sectionsalongthe channel
networkbyusingvertical planes(i.e.,the XScutlines) to cutthe terrainTIN.There are a few
importantrulestokeepinmindwhen drawingcross-sectioncutlines.
• Cut linesshouldbe perpendiculartothe directionof flow.Youcan use boththe river
centerline andthe flowpathlinestoassistyouinthistask.
• Cut linesshouldbe drawndirectionallyfromlefttorightbank.
• Cut linesshouldextendfarenoughoneitherside of the channel toencompassthe entire
portionof the floodplainyouwanttomodel.Theyshouldendatthe same elevationatboth
ends.
• Cut linesshouldnotintersecteachother.
• Cut linesshouldbe spacedclose enoughtoaccountfor notable changesinthe
hydraulicsorgeometryof the stream, suchas changesin discharge,slope,cross
BanksdigitalizedRivercentreline
sectionshape,roughnessorpresence of hydraulicstructures(bridges,levees,
weirs.)
• Each bridge intersectionwillrequire4cut lines, 2upstreamof the bridge and2
downstreamof the bridge.
As youare drawingcut linesyoucanpreview the cross-sectionusingthe XSPlottool. This
feature will helpyouensure youare drawingyourcross-sectionslongenoughtocapture the
entire floodplain.
vii) Attributing Cross-Section CutLines& Creating a 3D FeatureClass : Now,we will populatethe
attribute table of the XSCutLinesfeatureclasswe justdigitized.Fromthe HEC-GeoRAS
toolbar,selectRASGeometry/XSCut Line Attributes/All.
Selectthe correctlayername for eachitem on the list.The first5 itemson the listwill be
usedto populate the emptyfieldsinthe attribute tableof the XSCutLinesfeature class.The
lastitem(i.e.,XSCutLinesProfiles)isthe name of anew feature classthatwill be created.
The 2Dfeature class XSCutLineswill be intersectedwiththe TIN tocreate a feature classwith
3Dcross-sectioncutlines. Aftercompleting, openthe attributetable of the new feature class
XSCutLines3Dandexamine the populatedfields.
viii) Bridges/Culverts: Bridgesandculvertsare treatedsimilarlytocreatingthe cross-section
layer.Beginaneditingsession,andthenselectCreate New Feature forthe TaskandBridges
as the Target layerinthe Editor toolbar.Digitize linestracingeachbridge/culvertcrossing
Cross-sections
for the stream.Bridges/culvertsfollowthe same directional rulesasthe cross-sectionlayer.
Remembertodrawthemfromleftoverbanktorightoverbank.Youcan use the TIN,the
contourslayer,or the aerial photoprovidedinthe datafoldertolocate eachbridge and
draw a line alongthe centerline of the bridge withoutintersectingthe crosssections.Extend
your line beyondthe endsof the bridge,sothatyouare sure to capture the topographyof
the section.Once finished,save editsandendyoureditsession.
ix) Attributing Bridges/Culverts& Creating a 3D FeatureClass : From the HEC-GeoRAStoolbar,
selectRASGeometry/Bridges/Culverts/ All.
x) OptionalRASLayers: Apartfrom layersmentionedabove,there are several emptyfeature
classes(SAConnections,StorageAreas,IneffAreas,BlockedObs, LandUse…) thatwere
createdat the beginning.Theycanbe populated whentheirapplicationis necessary and
complicacyneededinmodels.
7. ExportingGISData to HEC-RAS:
The final model shouldbe exportedfromGISintoHEC-RASformatfor Simulation.The export
procedure includes:
i. Selecting Datafor Export:Fromthe HEC-GeoRAStoolbar,selectRASGeometry/Layer
Setupfromthe menu.The LayerSetupwindow withfourtabs(RequiredSurface,
RequiredLayers,OptionalLayersandOptional Tables)willappear.The purpose of the
Layer Setupmenuistodefine whichlayerswill be exportedtoHEC-RAS. Inactive menu
itemsi.e.whichare notused will show aNull value.Once youhave made all your
selectionsinthe LayerSetuptabs,selectOK.
ii. Exporting GISData:From the HEC-GeoRAStoolbar,selectRASGeometry/ExtractGIS DATA menuitem.
Choose a file name anddirectorytosave the data in. By defaultthe name isGIS2RAS.Keepsame or
change and save it inyourworkingdirectory
Hydraulic Analysis in HEC-RAS
HEC-RAScan performsteadyandunsteady simulationof riverflow inone dimension. The current
versionis HEC-RAS4.1.0.
 Starting a project:
Start HEC-RASfrom programs. SelectFile/New Projectfromthe mainHEC-RASinterface.
Browse to yourworkingdirectoryandcreate a new folderinitto store the HEC-RAS files
separately.Enteratitle andfilename forthe project(theycanhave the same name) andselect
OK.Note that by defaultthe unitsare “US CustomaryUnits”,can be changedto "Metric" as per
necessity.
 Importing RAS LayersfromGIS: Openthe GeometricDatawindow byselecting
fromthe mainHEC-RASuserinterface.SelectFile /ImportGeometryData/ GIS
Format. In the browserwhichappears,navigate toyourworkingdirectorywhere you
storedthe RAS GIS importfile GIS2RAS(notice itiscalledGIS2RAS.RASImport.sdf)
and selectit.SelectOKinthe browsingwindow.
The Import Optionswindow withfourtabswill appear. Choose appropriate unitsystem,then
pressNext.The secondtabis forselectingriverreachstreamlines.The thirdtabisCross
SectionsandIB Nodes.Thistablistsall of our cross-sectionsaswell asthe structures.The fourth
tab isfor any storage areasor storage connections. Finally, selectFinished –ImportData from
the ImportOptionswindow.
Perform Steady
Simulation
Perform Unsteady
Simulation
Edit/Enter
Geometric data
Edit/Enter
Steadydata
Edit/Enter
Unsteadydata
View cross-
sections
View
Profiles
Stage andflow
hydrographs
EnteringAdditionalDatainthe HEC-RASModel:The GeometricDatawindow canbe usedto
entermore data aboutthe stream.
i. Cross-SectionPointsFilter:HEC-RASallowsamaximumof 500 data pointspercross-
section.HEC-RAShasa cross-sectionpointsfilter,whichwillallow ustodelete excess
and duplicate points.
ii. Manning’sRoughnessValues(n): We needtoenterManning’s n valuesforeachcross-
section.Inthe GeometricData window selectTables/Manning’s n or k values.Inthe
EditManning’s n or k Valueswindow,select(All Rivers)fromthe drop-downbox inthe
Riveroption.Youwill see all of yourcross-sections andanystructures listedinthe table,
withblankspaceswhere youwill type inyourn values.
The fields n#1 andn#3 are for the Manning’sn valuesforthe overbanks(floodplains).
Similarly,the field n#2is forthe mainchannel Manning’snvalue.Once you’ve
populatedthe whole table,selectOK.Make sure yousave yourgeometrydataagain to
retainthisinformation.
iii. Cross-Sectioneditor:The cross-sectioneditorisusedtosee the cross-sectionpointsand
modifyif needed.Clickonthe button(orbyrightclickingonthe cross-sectionsin
geometriceditor) tobringthe general/tabularcross-sectioneditorasshown below.The
leftside showsthe stationdistance andcorrespondingelevation.The button canbe
usedto show/hidethe cross-sectionplotonthe right.
Anymodificationtocross-sectioncanbe done by openingthe graphical cross-section
editorusing button.
iv. RiverProfile:The riverprofile plot,profile tableandxyzplotcan be seenbyleftclicking
on the riverin GeometricView.
HEC-RAS Simulation
UNSTEADY FLOW ANALYSIS
HEC-RAScan do steady,unsteadyandquasi-steadysimulation,althoughhere we will giveabrief tutorial
on unsteadysimulationonly.
 Unsteadydata input and editing:
Once the geometricdatais entered,the unsteadyflow dataforsimulationcanbe entered.The unsteady
flowdataeditorscreencan be broughtby selecting Unsteady Flow Data fromEditmenu.
Here we can enterboundaryconditionsatall the external boundariesof the systemaswell asany
desiredinternal locations,andsetthe initial flow andstorage areaconditionsatthe simulation.
BoundaryConditions:
The primaryboundaryconditionsavailable are -
 Stagehydrograph - Upstream/downstreamapplicable
 FlowHydrograph - mostlyusedasUpstreamcondition
 Rating Curve- downstreamcondition.Shouldbe usedsufficientlydownstreamfromstudyareato
minimize anyerrors
 NormalDepth - Can be usedas downstreamcondition.Similarlylikeratingcurve shouldbe used
sufficientlydownstreamfromstudyareato minimizeanyerrors
 Stage/Flowhydrograph - Mixedboundaryconditionwhere stage hydrographisinsertedas upstream
boundaryuntil the stage hydrographrunsoutof data, at whichtime the flow hydrographis
automaticallyswitchedtoasthe boundarycondition
Initial conditions: Initial conditions of the system atthe beginningof unsteadysimulationshould
be entered. Itconsistsof stage and flow informationateachof the cross-sectionaswell as
elevationfromanystorage areasdefinedinthe system.
 PerformingUnsteadyFlowcalculation
Afterenteringthe geometryandunsteadyflow data,the unsteadyflow calculationscanbe
performed. Thiscanbe done by clicking Unsteady flow analysis inRun menu.
There are three componentswhichare usedwhilerunningsimulationwithHEC-RAS
GeometricData Preprocessor,Unsteadyflow simulatorandOutputpost-processor.
The geometricpreprocessor isusedtoprocessthe geometricdataintoa seriesof hydraulic
propertiestables,ratingcurves,andfamilyof ratingcurves.Thisisdone tospeedupthe
unsteadyflowcalculations.
References:
C Goswami, R Pebam, D Chutia, SB Borah, S Sudhakar (2012). Mapping of Flood Inundated
Areas of Assam using RADARSAT-2 Satellite Imagery. Project Report; NESAC-SR-87-2012
CM Bhatt, G. Srinivasa Rao, Asiya Begum, P. Manjusree, S. V. S. P. Sharma, L. Prasanna, V.
Bhanumurthy (2013). Satellite Images for Extraction of Flood Disaster Footprints and Assessing
the Disaster impact: Brahmaputra floods of June–July 2012, Assam, India. Current science;
104(12):1692-1700.
UR Rao (1994). Floods and Droughts. IAF COSPAR Symposium on Space Applications for Disaster
Prevention, Warning, Mitigation and Relief. Viena Feburary 21-22.

More Related Content

What's hot

Design water supply scheme
Design water supply schemeDesign water supply scheme
Design water supply schemeAby Mundackal
 
Urban watershed management
Urban watershed managementUrban watershed management
Urban watershed managementpreetijaycobe
 
ASFPM 2016: Applications of 2D Surface flow Modeling in the New HEC-RAS Versi...
ASFPM 2016: Applications of 2D Surface flow Modeling in the New HEC-RAS Versi...ASFPM 2016: Applications of 2D Surface flow Modeling in the New HEC-RAS Versi...
ASFPM 2016: Applications of 2D Surface flow Modeling in the New HEC-RAS Versi...CDM Smith
 
RAINFALL RUNOFF MODELLING USING HEC-HMS
RAINFALL RUNOFF MODELLING                USING HEC-HMSRAINFALL RUNOFF MODELLING                USING HEC-HMS
RAINFALL RUNOFF MODELLING USING HEC-HMSPushp Aggarwal
 
Flood modelling and prediction 1
Flood modelling and prediction 1Flood modelling and prediction 1
Flood modelling and prediction 1tp jayamohan
 
Rule level & gate operation
Rule level & gate operationRule level & gate operation
Rule level & gate operationTushar Dholakia
 
Water resources management river basin manage
Water resources management river basin manageWater resources management river basin manage
Water resources management river basin manageMwl. Mapesa Nestory
 
Reservoir capacity
Reservoir capacityReservoir capacity
Reservoir capacityonyx3
 
17 - NIH_ReSyP_Present-Sep-17
17 - NIH_ReSyP_Present-Sep-1717 - NIH_ReSyP_Present-Sep-17
17 - NIH_ReSyP_Present-Sep-17indiawrm
 
Urban Stormwater modeling using MIKE URBAN
Urban Stormwater modeling using MIKE URBANUrban Stormwater modeling using MIKE URBAN
Urban Stormwater modeling using MIKE URBANNagadatt Sharma Nagilla
 
Why is water resources management critical
Why is water resources management criticalWhy is water resources management critical
Why is water resources management criticalKaium Chowdhury
 
Irrigation engineering module 1
Irrigation engineering module 1Irrigation engineering module 1
Irrigation engineering module 1lalit thakur
 
hydro chapter_4_b_pipe_network_by louy Al hami
hydro  chapter_4_b_pipe_network_by louy Al hami hydro  chapter_4_b_pipe_network_by louy Al hami
hydro chapter_4_b_pipe_network_by louy Al hami Louy Alhamy
 
Flood Risk Analysis for River Serio, Italy by using HECRAS & River 2D
Flood Risk Analysis for River Serio, Italy by using HECRAS & River 2DFlood Risk Analysis for River Serio, Italy by using HECRAS & River 2D
Flood Risk Analysis for River Serio, Italy by using HECRAS & River 2DArshia Mousavi
 
Groundwater modelling (an Introduction)
Groundwater modelling (an Introduction)Groundwater modelling (an Introduction)
Groundwater modelling (an Introduction)Putika Ashfar Khoiri
 
Water demand and factor affecting water demand
Water demand and factor affecting water demandWater demand and factor affecting water demand
Water demand and factor affecting water demandAnkit Gola
 

What's hot (20)

Hec ras
Hec rasHec ras
Hec ras
 
Design water supply scheme
Design water supply schemeDesign water supply scheme
Design water supply scheme
 
Urban watershed management
Urban watershed managementUrban watershed management
Urban watershed management
 
ASFPM 2016: Applications of 2D Surface flow Modeling in the New HEC-RAS Versi...
ASFPM 2016: Applications of 2D Surface flow Modeling in the New HEC-RAS Versi...ASFPM 2016: Applications of 2D Surface flow Modeling in the New HEC-RAS Versi...
ASFPM 2016: Applications of 2D Surface flow Modeling in the New HEC-RAS Versi...
 
RAINFALL RUNOFF MODELLING USING HEC-HMS
RAINFALL RUNOFF MODELLING                USING HEC-HMSRAINFALL RUNOFF MODELLING                USING HEC-HMS
RAINFALL RUNOFF MODELLING USING HEC-HMS
 
Flood modelling and prediction 1
Flood modelling and prediction 1Flood modelling and prediction 1
Flood modelling and prediction 1
 
Rule level & gate operation
Rule level & gate operationRule level & gate operation
Rule level & gate operation
 
Water resources management river basin manage
Water resources management river basin manageWater resources management river basin manage
Water resources management river basin manage
 
Reservoir capacity
Reservoir capacityReservoir capacity
Reservoir capacity
 
17 - NIH_ReSyP_Present-Sep-17
17 - NIH_ReSyP_Present-Sep-1717 - NIH_ReSyP_Present-Sep-17
17 - NIH_ReSyP_Present-Sep-17
 
HEC-RAS 5.0.5 Release Notes
HEC-RAS 5.0.5 Release NotesHEC-RAS 5.0.5 Release Notes
HEC-RAS 5.0.5 Release Notes
 
Urban Stormwater modeling using MIKE URBAN
Urban Stormwater modeling using MIKE URBANUrban Stormwater modeling using MIKE URBAN
Urban Stormwater modeling using MIKE URBAN
 
Why is water resources management critical
Why is water resources management criticalWhy is water resources management critical
Why is water resources management critical
 
Irrigation engineering module 1
Irrigation engineering module 1Irrigation engineering module 1
Irrigation engineering module 1
 
hydro chapter_4_b_pipe_network_by louy Al hami
hydro  chapter_4_b_pipe_network_by louy Al hami hydro  chapter_4_b_pipe_network_by louy Al hami
hydro chapter_4_b_pipe_network_by louy Al hami
 
Flood Risk Analysis for River Serio, Italy by using HECRAS & River 2D
Flood Risk Analysis for River Serio, Italy by using HECRAS & River 2DFlood Risk Analysis for River Serio, Italy by using HECRAS & River 2D
Flood Risk Analysis for River Serio, Italy by using HECRAS & River 2D
 
Integrated Water Resource Management
Integrated Water Resource ManagementIntegrated Water Resource Management
Integrated Water Resource Management
 
Groundwater modelling (an Introduction)
Groundwater modelling (an Introduction)Groundwater modelling (an Introduction)
Groundwater modelling (an Introduction)
 
Water demand and factor affecting water demand
Water demand and factor affecting water demandWater demand and factor affecting water demand
Water demand and factor affecting water demand
 
02 water demand
02 water demand02 water demand
02 water demand
 

Viewers also liked

Amaljit - Work Report 2016
Amaljit - Work Report 2016Amaljit - Work Report 2016
Amaljit - Work Report 2016Amaljit Bharali
 
Amaljit - Activities NESAC 2014-2015
Amaljit - Activities NESAC 2014-2015Amaljit - Activities NESAC 2014-2015
Amaljit - Activities NESAC 2014-2015Amaljit Bharali
 
NUMERICAL MODELS AS MITIGATION MEASURES FOR RIVERINE AND URBAN FLOOD
NUMERICAL MODELS AS MITIGATION MEASURES FOR RIVERINE AND URBAN FLOODNUMERICAL MODELS AS MITIGATION MEASURES FOR RIVERINE AND URBAN FLOOD
NUMERICAL MODELS AS MITIGATION MEASURES FOR RIVERINE AND URBAN FLOODAmaljit Bharali
 
Future up-gradations to Flood Warning Systems in Assam
Future up-gradations to Flood Warning Systems in AssamFuture up-gradations to Flood Warning Systems in Assam
Future up-gradations to Flood Warning Systems in AssamAmaljit Bharali
 
Flood - Mitigation & Management
Flood - Mitigation & ManagementFlood - Mitigation & Management
Flood - Mitigation & ManagementAmaljit Bharali
 
GIS PROCEDURE FOR PRELIMINARY EVALUATION OF POTENTIAL HYDROPOWER SITES
GIS PROCEDURE FOR PRELIMINARY EVALUATION OF POTENTIAL HYDROPOWER SITESGIS PROCEDURE FOR PRELIMINARY EVALUATION OF POTENTIAL HYDROPOWER SITES
GIS PROCEDURE FOR PRELIMINARY EVALUATION OF POTENTIAL HYDROPOWER SITESFrancis Mitchell
 
2015 Upload Campaigns Calendar - SlideShare
2015 Upload Campaigns Calendar - SlideShare2015 Upload Campaigns Calendar - SlideShare
2015 Upload Campaigns Calendar - SlideShareSlideShare
 
What to Upload to SlideShare
What to Upload to SlideShareWhat to Upload to SlideShare
What to Upload to SlideShareSlideShare
 
Getting Started With SlideShare
Getting Started With SlideShareGetting Started With SlideShare
Getting Started With SlideShareSlideShare
 

Viewers also liked (14)

Amaljit - Work Report 2016
Amaljit - Work Report 2016Amaljit - Work Report 2016
Amaljit - Work Report 2016
 
Amaljit - Activities NESAC 2014-2015
Amaljit - Activities NESAC 2014-2015Amaljit - Activities NESAC 2014-2015
Amaljit - Activities NESAC 2014-2015
 
NUMERICAL MODELS AS MITIGATION MEASURES FOR RIVERINE AND URBAN FLOOD
NUMERICAL MODELS AS MITIGATION MEASURES FOR RIVERINE AND URBAN FLOODNUMERICAL MODELS AS MITIGATION MEASURES FOR RIVERINE AND URBAN FLOOD
NUMERICAL MODELS AS MITIGATION MEASURES FOR RIVERINE AND URBAN FLOOD
 
Future up-gradations to Flood Warning Systems in Assam
Future up-gradations to Flood Warning Systems in AssamFuture up-gradations to Flood Warning Systems in Assam
Future up-gradations to Flood Warning Systems in Assam
 
Flash flood
Flash floodFlash flood
Flash flood
 
URBAN FLOOD - ISG 2014
URBAN FLOOD - ISG 2014URBAN FLOOD - ISG 2014
URBAN FLOOD - ISG 2014
 
Topology in ArcGIS
Topology in ArcGISTopology in ArcGIS
Topology in ArcGIS
 
Flood - Mitigation & Management
Flood - Mitigation & ManagementFlood - Mitigation & Management
Flood - Mitigation & Management
 
GIS PROCEDURE FOR PRELIMINARY EVALUATION OF POTENTIAL HYDROPOWER SITES
GIS PROCEDURE FOR PRELIMINARY EVALUATION OF POTENTIAL HYDROPOWER SITESGIS PROCEDURE FOR PRELIMINARY EVALUATION OF POTENTIAL HYDROPOWER SITES
GIS PROCEDURE FOR PRELIMINARY EVALUATION OF POTENTIAL HYDROPOWER SITES
 
SlideShare 101
SlideShare 101SlideShare 101
SlideShare 101
 
Succession “Losers”: What Happens to Executives Passed Over for the CEO Job?
Succession “Losers”: What Happens to Executives Passed Over for the CEO Job? Succession “Losers”: What Happens to Executives Passed Over for the CEO Job?
Succession “Losers”: What Happens to Executives Passed Over for the CEO Job?
 
2015 Upload Campaigns Calendar - SlideShare
2015 Upload Campaigns Calendar - SlideShare2015 Upload Campaigns Calendar - SlideShare
2015 Upload Campaigns Calendar - SlideShare
 
What to Upload to SlideShare
What to Upload to SlideShareWhat to Upload to SlideShare
What to Upload to SlideShare
 
Getting Started With SlideShare
Getting Started With SlideShareGetting Started With SlideShare
Getting Started With SlideShare
 

Similar to Training - Hydraulic Flood Modelling

Changes in dam break hydrodynamic modelling practice - Suter et al
Changes in dam break hydrodynamic modelling practice - Suter et alChanges in dam break hydrodynamic modelling practice - Suter et al
Changes in dam break hydrodynamic modelling practice - Suter et alStephen Flood
 
Gis based-hydrological-modeling.-a-comparative-study-of-hec-hms-and-the-xinan...
Gis based-hydrological-modeling.-a-comparative-study-of-hec-hms-and-the-xinan...Gis based-hydrological-modeling.-a-comparative-study-of-hec-hms-and-the-xinan...
Gis based-hydrological-modeling.-a-comparative-study-of-hec-hms-and-the-xinan...Sikandar Ali
 
DSD-INT 2023 Next-Generation Flood Inundation Mapping for Taiwan - Delft3D FM...
DSD-INT 2023 Next-Generation Flood Inundation Mapping for Taiwan - Delft3D FM...DSD-INT 2023 Next-Generation Flood Inundation Mapping for Taiwan - Delft3D FM...
DSD-INT 2023 Next-Generation Flood Inundation Mapping for Taiwan - Delft3D FM...Deltares
 
FlatBayou.HEC-RAS.1D2D.Markwood_
FlatBayou.HEC-RAS.1D2D.Markwood_FlatBayou.HEC-RAS.1D2D.Markwood_
FlatBayou.HEC-RAS.1D2D.Markwood_David R. Markwood
 
DSD-INT 2023 Leveraging the results of a 3D hydrodynamic model to improve the...
DSD-INT 2023 Leveraging the results of a 3D hydrodynamic model to improve the...DSD-INT 2023 Leveraging the results of a 3D hydrodynamic model to improve the...
DSD-INT 2023 Leveraging the results of a 3D hydrodynamic model to improve the...Deltares
 
DSD-INT 2023 Coupling RIBASIM to a MODFLOW groundwater model - Bootsma
DSD-INT 2023 Coupling RIBASIM to a MODFLOW groundwater model - BootsmaDSD-INT 2023 Coupling RIBASIM to a MODFLOW groundwater model - Bootsma
DSD-INT 2023 Coupling RIBASIM to a MODFLOW groundwater model - BootsmaDeltares
 
DIGITAL WAVE SIMULATION OF LOSSY LINES FOR MULTI-GIGABIT APPLICATION
DIGITAL WAVE SIMULATION OF LOSSY LINES FOR MULTI-GIGABIT APPLICATIONDIGITAL WAVE SIMULATION OF LOSSY LINES FOR MULTI-GIGABIT APPLICATION
DIGITAL WAVE SIMULATION OF LOSSY LINES FOR MULTI-GIGABIT APPLICATIONPiero Belforte
 
Workshop on Storm Water Modeling Approaches
Workshop on Storm Water Modeling ApproachesWorkshop on Storm Water Modeling Approaches
Workshop on Storm Water Modeling ApproachesM. Damon Weiss
 
IRJET- Estimation of Hydrological and Hydraulics Parameters for Bridge De...
IRJET-  	  Estimation of Hydrological and Hydraulics Parameters for Bridge De...IRJET-  	  Estimation of Hydrological and Hydraulics Parameters for Bridge De...
IRJET- Estimation of Hydrological and Hydraulics Parameters for Bridge De...IRJET Journal
 
Art 3 a10.1007-2fs11269-013-0407-z
Art 3 a10.1007-2fs11269-013-0407-zArt 3 a10.1007-2fs11269-013-0407-z
Art 3 a10.1007-2fs11269-013-0407-zZagazig University
 
Fluent and Gambit Workshop
Fluent and Gambit WorkshopFluent and Gambit Workshop
Fluent and Gambit Workshopkhalid_nitt
 
Dam Break Analysis of Peringalkuthu Dam, Thrissur Using HEC-RAS
Dam Break Analysis of Peringalkuthu Dam, Thrissur Using HEC-RASDam Break Analysis of Peringalkuthu Dam, Thrissur Using HEC-RAS
Dam Break Analysis of Peringalkuthu Dam, Thrissur Using HEC-RASIRJET Journal
 
journal of engineering and applied science 18.pdf
journal of engineering and applied science 18.pdfjournal of engineering and applied science 18.pdf
journal of engineering and applied science 18.pdfnareshkotra
 

Similar to Training - Hydraulic Flood Modelling (20)

Changes in dam break hydrodynamic modelling practice - Suter et al
Changes in dam break hydrodynamic modelling practice - Suter et alChanges in dam break hydrodynamic modelling practice - Suter et al
Changes in dam break hydrodynamic modelling practice - Suter et al
 
Gis based-hydrological-modeling.-a-comparative-study-of-hec-hms-and-the-xinan...
Gis based-hydrological-modeling.-a-comparative-study-of-hec-hms-and-the-xinan...Gis based-hydrological-modeling.-a-comparative-study-of-hec-hms-and-the-xinan...
Gis based-hydrological-modeling.-a-comparative-study-of-hec-hms-and-the-xinan...
 
Final Ppt.pdf
Final Ppt.pdfFinal Ppt.pdf
Final Ppt.pdf
 
Ijsea03031003
Ijsea03031003Ijsea03031003
Ijsea03031003
 
DSD-INT 2023 Next-Generation Flood Inundation Mapping for Taiwan - Delft3D FM...
DSD-INT 2023 Next-Generation Flood Inundation Mapping for Taiwan - Delft3D FM...DSD-INT 2023 Next-Generation Flood Inundation Mapping for Taiwan - Delft3D FM...
DSD-INT 2023 Next-Generation Flood Inundation Mapping for Taiwan - Delft3D FM...
 
FlatBayou.HEC-RAS.1D2D.Markwood_
FlatBayou.HEC-RAS.1D2D.Markwood_FlatBayou.HEC-RAS.1D2D.Markwood_
FlatBayou.HEC-RAS.1D2D.Markwood_
 
DSD-INT 2023 Leveraging the results of a 3D hydrodynamic model to improve the...
DSD-INT 2023 Leveraging the results of a 3D hydrodynamic model to improve the...DSD-INT 2023 Leveraging the results of a 3D hydrodynamic model to improve the...
DSD-INT 2023 Leveraging the results of a 3D hydrodynamic model to improve the...
 
DSD-INT 2023 Coupling RIBASIM to a MODFLOW groundwater model - Bootsma
DSD-INT 2023 Coupling RIBASIM to a MODFLOW groundwater model - BootsmaDSD-INT 2023 Coupling RIBASIM to a MODFLOW groundwater model - Bootsma
DSD-INT 2023 Coupling RIBASIM to a MODFLOW groundwater model - Bootsma
 
DIGITAL WAVE SIMULATION OF LOSSY LINES FOR MULTI-GIGABIT APPLICATION
DIGITAL WAVE SIMULATION OF LOSSY LINES FOR MULTI-GIGABIT APPLICATIONDIGITAL WAVE SIMULATION OF LOSSY LINES FOR MULTI-GIGABIT APPLICATION
DIGITAL WAVE SIMULATION OF LOSSY LINES FOR MULTI-GIGABIT APPLICATION
 
JGrass-NewAge water budget
JGrass-NewAge water budget JGrass-NewAge water budget
JGrass-NewAge water budget
 
Workshop on Storm Water Modeling Approaches
Workshop on Storm Water Modeling ApproachesWorkshop on Storm Water Modeling Approaches
Workshop on Storm Water Modeling Approaches
 
Jgrass newage-waterbudget
Jgrass newage-waterbudgetJgrass newage-waterbudget
Jgrass newage-waterbudget
 
Lecture 1.pptx
Lecture 1.pptxLecture 1.pptx
Lecture 1.pptx
 
IRJET- Estimation of Hydrological and Hydraulics Parameters for Bridge De...
IRJET-  	  Estimation of Hydrological and Hydraulics Parameters for Bridge De...IRJET-  	  Estimation of Hydrological and Hydraulics Parameters for Bridge De...
IRJET- Estimation of Hydrological and Hydraulics Parameters for Bridge De...
 
HYDRO 2013_Pradyumna
HYDRO 2013_PradyumnaHYDRO 2013_Pradyumna
HYDRO 2013_Pradyumna
 
Lecture3
Lecture3Lecture3
Lecture3
 
Art 3 a10.1007-2fs11269-013-0407-z
Art 3 a10.1007-2fs11269-013-0407-zArt 3 a10.1007-2fs11269-013-0407-z
Art 3 a10.1007-2fs11269-013-0407-z
 
Fluent and Gambit Workshop
Fluent and Gambit WorkshopFluent and Gambit Workshop
Fluent and Gambit Workshop
 
Dam Break Analysis of Peringalkuthu Dam, Thrissur Using HEC-RAS
Dam Break Analysis of Peringalkuthu Dam, Thrissur Using HEC-RASDam Break Analysis of Peringalkuthu Dam, Thrissur Using HEC-RAS
Dam Break Analysis of Peringalkuthu Dam, Thrissur Using HEC-RAS
 
journal of engineering and applied science 18.pdf
journal of engineering and applied science 18.pdfjournal of engineering and applied science 18.pdf
journal of engineering and applied science 18.pdf
 

Recently uploaded

Vision and reflection on Mining Software Repositories research in 2024
Vision and reflection on Mining Software Repositories research in 2024Vision and reflection on Mining Software Repositories research in 2024
Vision and reflection on Mining Software Repositories research in 2024AyushiRastogi48
 
Behavioral Disorder: Schizophrenia & it's Case Study.pdf
Behavioral Disorder: Schizophrenia & it's Case Study.pdfBehavioral Disorder: Schizophrenia & it's Case Study.pdf
Behavioral Disorder: Schizophrenia & it's Case Study.pdfSELF-EXPLANATORY
 
THE ROLE OF PHARMACOGNOSY IN TRADITIONAL AND MODERN SYSTEM OF MEDICINE.pptx
THE ROLE OF PHARMACOGNOSY IN TRADITIONAL AND MODERN SYSTEM OF MEDICINE.pptxTHE ROLE OF PHARMACOGNOSY IN TRADITIONAL AND MODERN SYSTEM OF MEDICINE.pptx
THE ROLE OF PHARMACOGNOSY IN TRADITIONAL AND MODERN SYSTEM OF MEDICINE.pptxNandakishor Bhaurao Deshmukh
 
Best Call Girls In Sector 29 Gurgaon❤️8860477959 EscorTs Service In 24/7 Delh...
Best Call Girls In Sector 29 Gurgaon❤️8860477959 EscorTs Service In 24/7 Delh...Best Call Girls In Sector 29 Gurgaon❤️8860477959 EscorTs Service In 24/7 Delh...
Best Call Girls In Sector 29 Gurgaon❤️8860477959 EscorTs Service In 24/7 Delh...lizamodels9
 
Forest laws, Indian forest laws, why they are important
Forest laws, Indian forest laws, why they are importantForest laws, Indian forest laws, why they are important
Forest laws, Indian forest laws, why they are importantadityabhardwaj282
 
Speech, hearing, noise, intelligibility.pptx
Speech, hearing, noise, intelligibility.pptxSpeech, hearing, noise, intelligibility.pptx
Speech, hearing, noise, intelligibility.pptxpriyankatabhane
 
Grafana in space: Monitoring Japan's SLIM moon lander in real time
Grafana in space: Monitoring Japan's SLIM moon lander  in real timeGrafana in space: Monitoring Japan's SLIM moon lander  in real time
Grafana in space: Monitoring Japan's SLIM moon lander in real timeSatoshi NAKAHIRA
 
Manassas R - Parkside Middle School 🌎🏫
Manassas R - Parkside Middle School 🌎🏫Manassas R - Parkside Middle School 🌎🏫
Manassas R - Parkside Middle School 🌎🏫qfactory1
 
Call Girls in Mayapuri Delhi 💯Call Us 🔝9953322196🔝 💯Escort.
Call Girls in Mayapuri Delhi 💯Call Us 🔝9953322196🔝 💯Escort.Call Girls in Mayapuri Delhi 💯Call Us 🔝9953322196🔝 💯Escort.
Call Girls in Mayapuri Delhi 💯Call Us 🔝9953322196🔝 💯Escort.aasikanpl
 
Artificial Intelligence In Microbiology by Dr. Prince C P
Artificial Intelligence In Microbiology by Dr. Prince C PArtificial Intelligence In Microbiology by Dr. Prince C P
Artificial Intelligence In Microbiology by Dr. Prince C PPRINCE C P
 
Call Girls in Hauz Khas Delhi 💯Call Us 🔝9953322196🔝 💯Escort.
Call Girls in Hauz Khas Delhi 💯Call Us 🔝9953322196🔝 💯Escort.Call Girls in Hauz Khas Delhi 💯Call Us 🔝9953322196🔝 💯Escort.
Call Girls in Hauz Khas Delhi 💯Call Us 🔝9953322196🔝 💯Escort.aasikanpl
 
LIGHT-PHENOMENA-BY-CABUALDIONALDOPANOGANCADIENTE-CONDEZA (1).pptx
LIGHT-PHENOMENA-BY-CABUALDIONALDOPANOGANCADIENTE-CONDEZA (1).pptxLIGHT-PHENOMENA-BY-CABUALDIONALDOPANOGANCADIENTE-CONDEZA (1).pptx
LIGHT-PHENOMENA-BY-CABUALDIONALDOPANOGANCADIENTE-CONDEZA (1).pptxmalonesandreagweneth
 
Twin's paradox experiment is a meassurement of the extra dimensions.pptx
Twin's paradox experiment is a meassurement of the extra dimensions.pptxTwin's paradox experiment is a meassurement of the extra dimensions.pptx
Twin's paradox experiment is a meassurement of the extra dimensions.pptxEran Akiva Sinbar
 
Harmful and Useful Microorganisms Presentation
Harmful and Useful Microorganisms PresentationHarmful and Useful Microorganisms Presentation
Harmful and Useful Microorganisms Presentationtahreemzahra82
 
Call Us ≽ 9953322196 ≼ Call Girls In Lajpat Nagar (Delhi) |
Call Us ≽ 9953322196 ≼ Call Girls In Lajpat Nagar (Delhi) |Call Us ≽ 9953322196 ≼ Call Girls In Lajpat Nagar (Delhi) |
Call Us ≽ 9953322196 ≼ Call Girls In Lajpat Nagar (Delhi) |aasikanpl
 
Bentham & Hooker's Classification. along with the merits and demerits of the ...
Bentham & Hooker's Classification. along with the merits and demerits of the ...Bentham & Hooker's Classification. along with the merits and demerits of the ...
Bentham & Hooker's Classification. along with the merits and demerits of the ...Nistarini College, Purulia (W.B) India
 
Transposable elements in prokaryotes.ppt
Transposable elements in prokaryotes.pptTransposable elements in prokaryotes.ppt
Transposable elements in prokaryotes.pptArshadWarsi13
 
RESPIRATORY ADAPTATIONS TO HYPOXIA IN HUMNAS.pptx
RESPIRATORY ADAPTATIONS TO HYPOXIA IN HUMNAS.pptxRESPIRATORY ADAPTATIONS TO HYPOXIA IN HUMNAS.pptx
RESPIRATORY ADAPTATIONS TO HYPOXIA IN HUMNAS.pptxFarihaAbdulRasheed
 
Analytical Profile of Coleus Forskohlii | Forskolin .pdf
Analytical Profile of Coleus Forskohlii | Forskolin .pdfAnalytical Profile of Coleus Forskohlii | Forskolin .pdf
Analytical Profile of Coleus Forskohlii | Forskolin .pdfSwapnil Therkar
 
Call Girls in Munirka Delhi 💯Call Us 🔝8264348440🔝
Call Girls in Munirka Delhi 💯Call Us 🔝8264348440🔝Call Girls in Munirka Delhi 💯Call Us 🔝8264348440🔝
Call Girls in Munirka Delhi 💯Call Us 🔝8264348440🔝soniya singh
 

Recently uploaded (20)

Vision and reflection on Mining Software Repositories research in 2024
Vision and reflection on Mining Software Repositories research in 2024Vision and reflection on Mining Software Repositories research in 2024
Vision and reflection on Mining Software Repositories research in 2024
 
Behavioral Disorder: Schizophrenia & it's Case Study.pdf
Behavioral Disorder: Schizophrenia & it's Case Study.pdfBehavioral Disorder: Schizophrenia & it's Case Study.pdf
Behavioral Disorder: Schizophrenia & it's Case Study.pdf
 
THE ROLE OF PHARMACOGNOSY IN TRADITIONAL AND MODERN SYSTEM OF MEDICINE.pptx
THE ROLE OF PHARMACOGNOSY IN TRADITIONAL AND MODERN SYSTEM OF MEDICINE.pptxTHE ROLE OF PHARMACOGNOSY IN TRADITIONAL AND MODERN SYSTEM OF MEDICINE.pptx
THE ROLE OF PHARMACOGNOSY IN TRADITIONAL AND MODERN SYSTEM OF MEDICINE.pptx
 
Best Call Girls In Sector 29 Gurgaon❤️8860477959 EscorTs Service In 24/7 Delh...
Best Call Girls In Sector 29 Gurgaon❤️8860477959 EscorTs Service In 24/7 Delh...Best Call Girls In Sector 29 Gurgaon❤️8860477959 EscorTs Service In 24/7 Delh...
Best Call Girls In Sector 29 Gurgaon❤️8860477959 EscorTs Service In 24/7 Delh...
 
Forest laws, Indian forest laws, why they are important
Forest laws, Indian forest laws, why they are importantForest laws, Indian forest laws, why they are important
Forest laws, Indian forest laws, why they are important
 
Speech, hearing, noise, intelligibility.pptx
Speech, hearing, noise, intelligibility.pptxSpeech, hearing, noise, intelligibility.pptx
Speech, hearing, noise, intelligibility.pptx
 
Grafana in space: Monitoring Japan's SLIM moon lander in real time
Grafana in space: Monitoring Japan's SLIM moon lander  in real timeGrafana in space: Monitoring Japan's SLIM moon lander  in real time
Grafana in space: Monitoring Japan's SLIM moon lander in real time
 
Manassas R - Parkside Middle School 🌎🏫
Manassas R - Parkside Middle School 🌎🏫Manassas R - Parkside Middle School 🌎🏫
Manassas R - Parkside Middle School 🌎🏫
 
Call Girls in Mayapuri Delhi 💯Call Us 🔝9953322196🔝 💯Escort.
Call Girls in Mayapuri Delhi 💯Call Us 🔝9953322196🔝 💯Escort.Call Girls in Mayapuri Delhi 💯Call Us 🔝9953322196🔝 💯Escort.
Call Girls in Mayapuri Delhi 💯Call Us 🔝9953322196🔝 💯Escort.
 
Artificial Intelligence In Microbiology by Dr. Prince C P
Artificial Intelligence In Microbiology by Dr. Prince C PArtificial Intelligence In Microbiology by Dr. Prince C P
Artificial Intelligence In Microbiology by Dr. Prince C P
 
Call Girls in Hauz Khas Delhi 💯Call Us 🔝9953322196🔝 💯Escort.
Call Girls in Hauz Khas Delhi 💯Call Us 🔝9953322196🔝 💯Escort.Call Girls in Hauz Khas Delhi 💯Call Us 🔝9953322196🔝 💯Escort.
Call Girls in Hauz Khas Delhi 💯Call Us 🔝9953322196🔝 💯Escort.
 
LIGHT-PHENOMENA-BY-CABUALDIONALDOPANOGANCADIENTE-CONDEZA (1).pptx
LIGHT-PHENOMENA-BY-CABUALDIONALDOPANOGANCADIENTE-CONDEZA (1).pptxLIGHT-PHENOMENA-BY-CABUALDIONALDOPANOGANCADIENTE-CONDEZA (1).pptx
LIGHT-PHENOMENA-BY-CABUALDIONALDOPANOGANCADIENTE-CONDEZA (1).pptx
 
Twin's paradox experiment is a meassurement of the extra dimensions.pptx
Twin's paradox experiment is a meassurement of the extra dimensions.pptxTwin's paradox experiment is a meassurement of the extra dimensions.pptx
Twin's paradox experiment is a meassurement of the extra dimensions.pptx
 
Harmful and Useful Microorganisms Presentation
Harmful and Useful Microorganisms PresentationHarmful and Useful Microorganisms Presentation
Harmful and Useful Microorganisms Presentation
 
Call Us ≽ 9953322196 ≼ Call Girls In Lajpat Nagar (Delhi) |
Call Us ≽ 9953322196 ≼ Call Girls In Lajpat Nagar (Delhi) |Call Us ≽ 9953322196 ≼ Call Girls In Lajpat Nagar (Delhi) |
Call Us ≽ 9953322196 ≼ Call Girls In Lajpat Nagar (Delhi) |
 
Bentham & Hooker's Classification. along with the merits and demerits of the ...
Bentham & Hooker's Classification. along with the merits and demerits of the ...Bentham & Hooker's Classification. along with the merits and demerits of the ...
Bentham & Hooker's Classification. along with the merits and demerits of the ...
 
Transposable elements in prokaryotes.ppt
Transposable elements in prokaryotes.pptTransposable elements in prokaryotes.ppt
Transposable elements in prokaryotes.ppt
 
RESPIRATORY ADAPTATIONS TO HYPOXIA IN HUMNAS.pptx
RESPIRATORY ADAPTATIONS TO HYPOXIA IN HUMNAS.pptxRESPIRATORY ADAPTATIONS TO HYPOXIA IN HUMNAS.pptx
RESPIRATORY ADAPTATIONS TO HYPOXIA IN HUMNAS.pptx
 
Analytical Profile of Coleus Forskohlii | Forskolin .pdf
Analytical Profile of Coleus Forskohlii | Forskolin .pdfAnalytical Profile of Coleus Forskohlii | Forskolin .pdf
Analytical Profile of Coleus Forskohlii | Forskolin .pdf
 
Call Girls in Munirka Delhi 💯Call Us 🔝8264348440🔝
Call Girls in Munirka Delhi 💯Call Us 🔝8264348440🔝Call Girls in Munirka Delhi 💯Call Us 🔝8264348440🔝
Call Girls in Munirka Delhi 💯Call Us 🔝8264348440🔝
 

Training - Hydraulic Flood Modelling

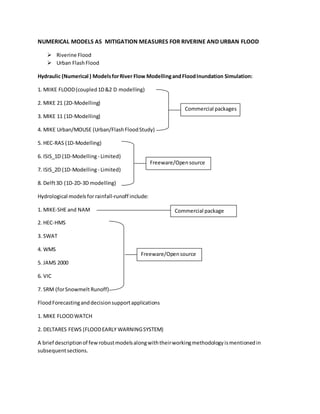
  • 1. NUMERICAL MODELS AS MITIGATION MEASURES FOR RIVERINE AND URBAN FLOOD  Riverine Flood  Urban FlashFlood Hydraulic (Numerical ) ModelsforRiver Flow ModellingandFloodInundation Simulation: 1. MIIKE FLOOD(coupled1D&2 D modelling) 2. MIKE 21 (2D-Modelling) 3. MIKE 11 (1D-Modelling) 4. MIKE Urban/MOUSE (Urban/FlashFloodStudy) 5. HEC-RAS (1D-Modelling) 6. ISIS_1D (1D-Modelling- Limited) 7. ISIS_2D (1D-Modelling- Limited) 8. Delft3D (1D-2D-3D modelling) Hydrological modelsforrainfall-runoff include: 1. MIKE-SHE and NAM 2. HEC-HMS 3. SWAT 4. WMS 5. JAMS 2000 6. VIC 7. SRM (forSnowmelt Runoff) FloodForecastinganddecisionsupportapplications 1. MIKE FLOODWATCH 2. DELTARES FEWS (FLOODEARLY WARNINGSYSTEM) A brief descriptionof fewrobustmodelsalongwiththeirworkingmethodologyismentionedin subsequentsections. Freeware/Opensource Commercial packages Freeware/Opensource Commercial package
  • 2. MIKE FLOOD INTRODUCTION MIKE FLOOD isa tool that integratesthe one-dimensional modelsMIKEURBAN,MIKE 11 and the two- dimensional modelMIKE21 intoa single,dynamicallycoupledmodellingsystem.Thiscoupledapproach enablesthe bestfeaturesof bothaone -dimensional andtwodimensional modelstobe utilized,whilst at the same time avoidingmanyof the limitationsof resolutionandaccuracy encounteredwhenusing MIKE 11, MIKE URBAN or MIKE 21 separately. FewModel Applicationsinclude:  Floodplainapplications  Storm surge studies  Urban drainage  Dam break  Hydraulicdesignof structures  Broad scale estuarine applications SETTING UP MIKE FLOOD MIKE FLOOD isa combinationof MIKE11/MOUSE andMIKE 21. Hence the individualmodels shouldbe setupseparately,then joinedtogetherusingMIKEFLOOD. MIKE 11 SETUP A brief descriptionof modellingstepsisprovided withreferences/snapsfromstudyof few floodprone North-Easternplaces. The prerequisiteinanymodellingispreparation of the inputfiles.In DHI_MIKE models,the MIKEZERO interface isprovidedforall inputfile preparation,projectsetupand organizing. Figure 1 MIKE ZERO interface on New File creation
  • 3. The basic filesneeded inMIKE11 Simulation are: 1. Simulation file(.sim11) 2. RiverNetworkfile (.nwk11) 3. Cross-sectionfile(.xns11) 4. BoundaryConditionfile (.bnd11) 5. Parameterfiles (Hydrodynamic,Rainfall-runoff,Advection-dispersion,SedimentTransport) The firststepis the creationof a simulationfile(.sim11),whichcombinesall informationnecessaryto performa simulation.Thisinformationcomprisestype of model torun,name andlocationof inputdata files,simulationperiod,time step,etc.andname of resultfiles. Foreasy andsystematicworkinga projectshouldbe createdinitiallywithblanknetworkeditors,cross-sectioneditors,boundaryfileand parameterfilesandlinkingtheminthe Simulationfile. Rivercan be manuallydigitizedorimportedfromshapefilescreatedinGISsoftware.Suitable numberof nodesare createdin the processto whichthe rivercross-sectionsfromsurveydataor DEM can be linked.The cross- sectioneditoristobe createdin the processwhere the cross-sectionsareadefined. Figure 3 Network editor with main interface, tabular view and longitudinal profile view RiverLine Connected Cross-sections RiverNode Figure 2 River nodes, lines and X-sec connected in Network Editor TabularView Main screen with nodes and riverline Longitudinal profile view
  • 4. Due to unavailabilityof riverbed surveydatamostof the time,automaticcross-sectionextractionfrom DEM data isfollowed.Thiscanbe done MIKE GIS,HEC-GeoRASor otherGIS tools. Figure 4 Cross-section extraction using HEC-GeoRAS Rivercross-section file containstwodatasets,raw and tabular. The raw data describesthe physical shape of a cross-sectionusing(x,z) co-ordinates.The processeddata iscalculatedfromthe raw data and containscorrespondingvaluesforlevel,cross-sectionarea,flow width,hydraulic/resistanceradius. Also,eachcross-sectionisdefineduniquelybythe followingthree keys:  RiverName  TOPOID  Chainage ProvisionisgivenforuserdefinedDatum, definingresistance type anddistribution.Alsobankmarkers, bedmarkersand userdefinedmarkersare providedtospecifythe banklines,resistance distribution (channel andfloodplain). The riverBoundary Editorscomprisesof the Time serieseditor (.dfs0) andboundaryeditor(.bnd11). Times series of discharge,waterlevel,wind,temperature,etccanbe definedinthe time seriesfile at specifiedintervalsorrandomperiods. Boundarieslike open,closed,pointsource ,structuresordistributedsource canbe definedinthe boundaryeditor.Also,boundarycanbe definedastype inflow,waterlevel,Q-h,etc. HEC-GeoRAStoolbarinArcGIS Cross-sectionalview
  • 5. Figure 5 Time Series editor showing discharge-stage timeseries Finally,the parameterfilesneedtobe createdwhichwill dependonthe type of computation.The MIKE parametereditorsare -  Hydrodynamic  Advection-dispersion  Water Quality  SedimentTransport  Rainfall-Runoff For general floodmodelshydrodynamicmodule issufficient i.e.the HDparameterfile. Rainfall-runoff module isnecessaryif we needacombinedhydrologicandhydrodynamic computation.Similarly,for snowcharacteristicswe will need toincludethe ice parameter. The HD parameterfile containsinitial conditionsforthe hydrodynamicsimulation.Thisincludes initial waterlevel/depthanddischarge whichcanbe put as constantvalue or stage /discharge hydrographs. The final stepis specifyingthe time step ,simulationstartandend date,the resultfile andvalidationof the simulation.Anyerrorsinthe correspondingfileswill be mentionedinthe validationpage. Aftercompletionof the simulationthe resultscanbe viewedusingMIKEView or MIKE ResultViewer. MIKE 21 SETUP Afterfinishingthe 1Dsetupwe needtosetupa 2D model forthe studyarea. The inputsneededforthe purpose are-  DEM data/Topographicsurveydata  Bathymetric/riverdepthsurveydata Properties page
  • 6.  Discharge hydrographsorDischarge-stage hydrographs(bothupstream&downstream) - optional feature if settingupaMIKE FLOODmodel  Precipitation/Evaporation data(optional)  Resistance (Manning/Chezy)  Winddata (optional)  Structure data/types/locations(optional) The firststepis identificationof the studyareaand clipping the imageriesandDEM insuitable GIS software.MIKE21 supports *.dfs2 formatfiles,hence conversionof DEMto Ascii formatisessential whichcan furtherbe convertedto *.dfs2 formatusingMIKE ZeroToolbox. Itis to be notedthatthe Raw DEM usedshouldbe hydrocorrected to minimizeeffectsof sinksinthe data. The primaryinputfor the simulationisBathymetry file,whichisingeneral termsisthe Topographicfile combinedwiththe bathymetricsurveydata.Extreme care shouldbe takenwhilepreparationof the bathymetricfile asaccuracyand stabilityof the whole setupdependsonthis. Some basicoperationsto be usedinthe bathymetricfile include-  Importinghighresolutionimageriesforproperstudyof the landuse and modifying the DEM accordingly  Importriver,banksand cross-sectionshapefilesfromMIKE11 setup  Importbuildingslayerandsettinglandvalue inthe areas(forurbanflooding)  Remove noise andotherDEMimperfectionsusinginbuiltfilteringtechniques  Merge the riverbeddata withtopographicdata  Correct suddenchanges of riverslope andbankswhichusuallyoccursdue toDEM errors. Finallyenclosethe studyareawithgridlinesfilledwithlandvalues Figure 2 Bathymetric file of Bharalu river near Zoo Road, Guwahati using CARTOSAT 1m hybrid DEM and Cartosat imagery as background layer
  • 7. Simulation in MIKE 21  Module selection:MIKE21 Simulationconsistsof firstselectingthe suitablemodule.Forflood inundationstudywe needto selectthe Hydrodynamicmodule.  Bathymetry: The nextstepisspecifyingthe bathymetryfile.There isadditional optionof providingafine bathymetrytostudyindetail aparticulararea.Thus a fine DEMis enclosedina coarse DEM. Normallycoldstartprocedure isfollowed.Hotstartfacilityisnecessaryif we want to run multiple simulationswithsimilarinitial conditions. CoriolisforcingisnotnecessaryforHD withoutwindconditions.  Simulationperiod: Timestepcanbe minimum0.5 to anyas specifiedbyuser.Highertime stepdecreasessimulation time significantly butthere isdecreaseinstabilityof the model due tothe increase incourant numberfactor. The courantnumberisdefinedas - CR = c (Δt/Δx) where, c=celerity,Δtistime stepandΔx isthe gridspacing The courant numberactuallyexpresseshow manytime stepthe informationmovesinone timestep. Forflowstabilitycourantnumbershouldbe below 1,butnumbersupto5 isallowed dependingonthe bathymetry.Smootherbathymetriescan have highercourantnumbers. The warm-upperiodis a numberof time stepsoverwhichthe forcingfunctionsare gradually increasedfromzeroto100% of theirtrue value.Model instabilityatinitialperiodcanbe correctedby increasingthisvalue.  Boundary: The boundaryconditionsneedstobe specifiedforthe upstreamanddownstream reach.This can be discharge hydrographor stage hydrograph or constantdischarge/waterlevel. For MIKE FLOOD simulationwe usuallykeepthe boundariesclosed.  Source and Sink: Source and sinkpointscanbe specifiedcombinedorisolated.Sourcesare pointsfromwhere constantspecifiedinflowinoccurring.Sinksare pointsforsuckingout specifiedinflowoutof the model ata constantrate. Up to 256 source and sinkpointsare allowedinthe model. Source andsinkpointsshould notbe placed onlocationswhichmightdry out as itwill make the model unstable.  Floodingand drying : For accuracy the floodinganddryingfacilityisintroducedinthe MIKE21 module. Dryingdepthis the minimumwaterdepthallowedinapointbefore itistakenoutof calculation,andfloodingdepthisthe waterdepthatwhichthe pointwill be reenteredintothe calculation. Infloodplainapplicationsgenerallydryingdepthof 0.005-0.1 and floodingdepthof 0.01-0.2 is used.
  • 8.  Initial surface elevation:Inmanyfloodplainapplicationsthe initial surface elevationcanbe set to be a constantvalue.Insome applicationshowever,itisbe necessarytouse an initial spatially varyingwatersurface that matchesthe actual water distributionandlevelsinthe model domain at the start of the model simulation.Insome cases,where the initial surface elevationcanbe assumedtobe at groundlevel,the bathymetryfile mayalsobe usedasinitial surface condition.  Precipitationand Evaporation: Precipitationandevaporationcanbe specifiedasconstantor time seriesfile.Intensityisinmm/day.Also,whenusingrainfall,the userassumes100% runoff, whichmay or maynot be appropriate if significantinfiltrationandstorage canoccur inthe soil or groundmaterial. Double precisionmode isneededtocalculate appropriatelysmall incrementsof rainfall andaccumulation.  Eddy Viscosity: The eddyviscosity canbe specifiedasconstant,Smagorinskyornil. Also,types can be flux basedorvelocitybased.But Smagorinsky andvelocitybasedcreates stability problem,hence usuallyconstantflux basedviscosityisused. Also,if levels/velocityshowstoo frequentchange,itshouldbe increased.  Resistance/BedFriction:Two typesof resistance constantsnamelyManning orChezyisused. Thiscan be definedconstantoverthe areaordifferentbasedonlanduse/landcovermaps. It shouldbe notedthatMIKE 21 takesinverse of resistanceconstants,i.e. aManningresistance of 0.025 isusedas 40. Manning'sresistance increasesthe CPUtime ascalculationshappenin h^(1/6) foreach grid.Chezytakescomparativelylessertime.Itshouldbe notedthatwithlow resistance there isincrease inmodelinstability.  Finallythe resultfile needstobe specified. The outputitemconsistsof Waterlevel,P-Flux,Q- Flux, Surface elevation, U-velocity,V-velocity, Stillwaterdepth,ShearstressX-direction and ShearstressY-direction.The resultcanbe savedas type *.dfs0,*.dfs1and *.dfs2 fileswhichis defaultfile systemfortimeseries,profileseriesand gridseriesfile. There isoptionof savingat specifiedtime steptoreduce diskspace.Also,optionallywe canselectandsave onlythose areas where ourinterestlies. Figure 6 Dhannsiri river flooding in NNagaland and Guwahati urban flooding study using MIKE 21
  • 9. MIKE FLOOD Setup Aftercompletingthe MIKE11 andMIKE 21 setup,the modelsneedtobe linkedusingMIKEFLOOD couplingfile.Inpresence of MIKEURBAN setup,itcan alsobe linked. Itsgoodpractice to checkthe individualstabilityof MIKE11 andMIKE 21 setupsas FLOODsimulationcannotrunif 1D-2D setups cannot runisolated. The general stepsinthe processare: 1. Create a new*.couple file. 2. As we are linkingMIKE11 and 21 setups,lateral linkcouplingneedstobe done. 3. To use the automatedlateral couplingtool,rightclickonthe maplayoutand choose the option Linkriverbranch to MIKE21. Inthe dialogthatappears,choose Lateral Link,andselectLeft bank.In the LinkInfosectioninputthe Rivername (Wamukhra),thenclickonthe TopoID field and itwill automaticallyinsertTopoID,upstreamanddownstreamchainages.Repeatthisfor rightbank of the river.Each time whenyouadda link,a new line will be addedinthe dialogjust above the layout,anda greenline will show upinlayouttoindicate the locationof linkage. Blocking out river cells:Insome cases(if yourrivercoversmore than one grid cell),cellslyingin the mainriverbedbetweenthe leftandthe rightleveemaybe blockedout.Thismaybe done to ensure thatmass isnot double counted. 4. Once we finishaddinglinkage,we shouldgotoLateral linkoptionsinNavigation,thenspecify parameterslike depthtolerance,Friction,etc.Forasimple model we cankeepother parametersasdefaultexceptresistance whichwe needtospecify asperourbedmaterial/area landuse. 5. Finallywe canstart the Simulation fromRunmenu byclickingstartsimulationbutton. The simulationcantake fewminutestohoursor evendaysdependinguponourstudyarea, simulationtime,gridsize andselectionof variousparameters (suchasManningor Chezy resistance).A numberof logfilesare createdinthe process. The detailsof simulationcanbe checkedfromthese logfiles. Incase of model instabilityalso,errorlogsare createdinthese log files,whichcanbe referredto make changesand bringstabilityinthe model.
  • 10. 6. Aftersuccessful simulationwe canview the resultsandchecktheiraccuracyusingMIKE Result ViewerandAnimator(for3Dviewing). Properinterpretationof resultsneed relevantexperience inthe fieldandknowledgeof hydrodynamics. Special care shouldbe takensothatassumed parametersdonot have adverse effectonthe waterdepth,flux andvelocity. Also,the final resultscanbe convertedto*.asc filesorkml/kmzfilesandimportedtoGISor Google Earth for betterviewing.
  • 11. RIVER FLOOD MODELLING using HEC-RAS and GeoRAS HydrologicEngineeringCenter's RiverAnalysisSystem orHEC-RAS inshortisa one-dimensional steady flowhydraulicmodel designedtoaidhydraulicengineersin channel flow analysisandfloodplain determination. HEC-GeoRAS isatool forArcGIS for pre and/orpost-processingof GISdataand HEC-RAS resultsforfloodinundationmapping. HEC-RASand HEC-GeoRASisfreelyavailablefrom HydrologicEngineeringCenter,U.S.ArmyCorpsof Engineerswebsite: http://www.hec.usace.army.mil/ DifferentHEC-GeoRASinstallersare availableforArcGIS 9.3, 10 and10.1. Before installingwe have to make sure that any oldversionsof HEC-GeoRAS,APFramework,MSXMLor XML Data Exchange Toolsare properlyuninstalled. In thistutorial we will explain briefly abasicsetupof HEC-RASmodel usingHEC-GeoRAStoolbarin ArcGIS. HEC-GeoRASsetupprocedure: 1. OpenArcMap. HEC-GeoRASwill be loadedasatoolbarinArcMap. We should alsoactivate the Editortoolbar,Spatial Analystand3D Analyst ,as they will be neededlater. 2. Create yourWorkingdirectory. Save youremptyArcMap map inyour workingdirectory. 3. The main data inputforcreatingfloodplainsforariverisa digital terrainmodel (DTM)/Digital Elevationmodel (DEM) 4. We are now readyto create the RAS layersinArcMap, which are usedto create geometricdata setsthat will be modeledin HEC-RAS.The RASlayerscreatedwill be storedcollectivelyina GeoDatabase,whichHEC-GeoRAScreatesautomatically.Bydefault,thisGeoDatabase will be DEM TIN
  • 12. savedinthe same locationas the ArcMap projectwithwhichyouare workingandwill be given the same name. 5. To create the RASlayers,onthe HEC-GeoRAStoolbar,selectRASGeometry/Create RASLayers / All.We can alsocreate layersone byone selectingonlythe oneswe need. The created layers will be showninthe Table of ContentsinArcGIS. 6. Nowwe have to digitalize eachindividuallayersusingeditingtoolsinArcMap. i) StreamCenterline Layer: Thislayerwill be used todigitize (draw)the riverreachnetwork for the systemyouare studying. Multiple networksof streams canbe digitalizedand modelled withHEC-GeoRAS Note:Alwaysdigitizethe streaminthe directionof flow.Thatis,you mustbeginatthe most upstreamendof the stream,and workyour waydownstreamendingat the outletor beginningof the nextdownstreamreach. ii) River Reach Name: Each riverand eachreach withineachrivermusthave a name which uniquelyidentifiesit.The RiverReachIDtool on the HEC-GeoRAStoolbarwill allowyouto numberthe reaches. Afterlabelingthe riverreach,openandexamine the attribute tablefor the rivercenterline “River”.Notice thatmanyof the fieldsinthe attribute table have been automaticallypopulated. iii) NetworkConnectivity :Next,we will populate the “ToNode”and“From Node”fieldsinthe Rivercenterlineattribute table.Fromthe HEC-GeoRAStoolbarselectRASGeometry/ StreamCenterlineAttributes/Topology. Selectthe name of yourstreamcenterlineand terrainTIN inthe drop-downmenus andthenselectOK. Next,todetermine the lengthof eachreachand populate the “FromSta”and“ToSta” fieldsinthe attribute table,fromthe HEC-GeoRAStoolbarselectRASGeometry/ StreamCenterlineAttributes/ Lengths/Stationsfrom the menu.
  • 13. iv) BankLines Layer : The purpose of creatingthislayeristodistinguishbetween the main channel of the riverand the floodplains(overbanks) of the river.The banklines will be createdinsimilarfashionasthe rivercenterlineandalsostartingfromupstream.Contour linescan alsohelpguide youdigitizethe banklines. v) FlowpathCenterlines : The flowpath centerline layerisasetof linesthatfollowsthe center of massof the waterflowingdownthe river.Forthe mainchannel,the streamcenterlineis the flowpathcenterline.Forthe channel overbanks(floodplains),the flowpathcenterlineis locatedin the centerof the overbank,andissetslightlyoutsidethe mainchannel banklines. Note that the widthsof the floodplainsare unknownthusfar.The flowpathcenterlinesare usedto calculate the downstreamreachlengthsbetweencross-sections.  SelectRASGeometry/Create RASLayers / FlowpathCenterlines.Anoptionwillbe shownforcopyingthe streamcenterline asyourmainchannel flowpathline. You still needtodigitizethe overbankflowpathlinesinthe downstream direction.  Next,youneedtolabel eachflowpathlineusingthe AssignLine Type tool . Afterclickingonthe AssignLine Type tool,clickona Flowpaths line,andthen selectthe correctoption(i.e.,rightorleft) inthe window thatpopsup. Repeatwith all three flowpaths. Note the rightflowpathisthe line onyourrightif youwere lookingdownstreamandwaterwashittingyouinthe back. vi) XS CutLines : Cross-sectional cutlines are usedtodefinecross-sectionsalongthe channel networkbyusingvertical planes(i.e.,the XScutlines) to cutthe terrainTIN.There are a few importantrulestokeepinmindwhen drawingcross-sectioncutlines. • Cut linesshouldbe perpendiculartothe directionof flow.Youcan use boththe river centerline andthe flowpathlinestoassistyouinthistask. • Cut linesshouldbe drawndirectionallyfromlefttorightbank. • Cut linesshouldextendfarenoughoneitherside of the channel toencompassthe entire portionof the floodplainyouwanttomodel.Theyshouldendatthe same elevationatboth ends. • Cut linesshouldnotintersecteachother. • Cut linesshouldbe spacedclose enoughtoaccountfor notable changesinthe hydraulicsorgeometryof the stream, suchas changesin discharge,slope,cross BanksdigitalizedRivercentreline
  • 14. sectionshape,roughnessorpresence of hydraulicstructures(bridges,levees, weirs.) • Each bridge intersectionwillrequire4cut lines, 2upstreamof the bridge and2 downstreamof the bridge. As youare drawingcut linesyoucanpreview the cross-sectionusingthe XSPlottool. This feature will helpyouensure youare drawingyourcross-sectionslongenoughtocapture the entire floodplain. vii) Attributing Cross-Section CutLines& Creating a 3D FeatureClass : Now,we will populatethe attribute table of the XSCutLinesfeatureclasswe justdigitized.Fromthe HEC-GeoRAS toolbar,selectRASGeometry/XSCut Line Attributes/All. Selectthe correctlayername for eachitem on the list.The first5 itemson the listwill be usedto populate the emptyfieldsinthe attribute tableof the XSCutLinesfeature class.The lastitem(i.e.,XSCutLinesProfiles)isthe name of anew feature classthatwill be created. The 2Dfeature class XSCutLineswill be intersectedwiththe TIN tocreate a feature classwith 3Dcross-sectioncutlines. Aftercompleting, openthe attributetable of the new feature class XSCutLines3Dandexamine the populatedfields. viii) Bridges/Culverts: Bridgesandculvertsare treatedsimilarlytocreatingthe cross-section layer.Beginaneditingsession,andthenselectCreate New Feature forthe TaskandBridges as the Target layerinthe Editor toolbar.Digitize linestracingeachbridge/culvertcrossing Cross-sections
  • 15. for the stream.Bridges/culvertsfollowthe same directional rulesasthe cross-sectionlayer. Remembertodrawthemfromleftoverbanktorightoverbank.Youcan use the TIN,the contourslayer,or the aerial photoprovidedinthe datafoldertolocate eachbridge and draw a line alongthe centerline of the bridge withoutintersectingthe crosssections.Extend your line beyondthe endsof the bridge,sothatyouare sure to capture the topographyof the section.Once finished,save editsandendyoureditsession. ix) Attributing Bridges/Culverts& Creating a 3D FeatureClass : From the HEC-GeoRAStoolbar, selectRASGeometry/Bridges/Culverts/ All. x) OptionalRASLayers: Apartfrom layersmentionedabove,there are several emptyfeature classes(SAConnections,StorageAreas,IneffAreas,BlockedObs, LandUse…) thatwere createdat the beginning.Theycanbe populated whentheirapplicationis necessary and complicacyneededinmodels. 7. ExportingGISData to HEC-RAS: The final model shouldbe exportedfromGISintoHEC-RASformatfor Simulation.The export procedure includes: i. Selecting Datafor Export:Fromthe HEC-GeoRAStoolbar,selectRASGeometry/Layer Setupfromthe menu.The LayerSetupwindow withfourtabs(RequiredSurface, RequiredLayers,OptionalLayersandOptional Tables)willappear.The purpose of the Layer Setupmenuistodefine whichlayerswill be exportedtoHEC-RAS. Inactive menu itemsi.e.whichare notused will show aNull value.Once youhave made all your selectionsinthe LayerSetuptabs,selectOK. ii. Exporting GISData:From the HEC-GeoRAStoolbar,selectRASGeometry/ExtractGIS DATA menuitem. Choose a file name anddirectorytosave the data in. By defaultthe name isGIS2RAS.Keepsame or change and save it inyourworkingdirectory Hydraulic Analysis in HEC-RAS HEC-RAScan performsteadyandunsteady simulationof riverflow inone dimension. The current versionis HEC-RAS4.1.0.  Starting a project: Start HEC-RASfrom programs. SelectFile/New Projectfromthe mainHEC-RASinterface. Browse to yourworkingdirectoryandcreate a new folderinitto store the HEC-RAS files separately.Enteratitle andfilename forthe project(theycanhave the same name) andselect OK.Note that by defaultthe unitsare “US CustomaryUnits”,can be changedto "Metric" as per necessity.
  • 16.  Importing RAS LayersfromGIS: Openthe GeometricDatawindow byselecting fromthe mainHEC-RASuserinterface.SelectFile /ImportGeometryData/ GIS Format. In the browserwhichappears,navigate toyourworkingdirectorywhere you storedthe RAS GIS importfile GIS2RAS(notice itiscalledGIS2RAS.RASImport.sdf) and selectit.SelectOKinthe browsingwindow. The Import Optionswindow withfourtabswill appear. Choose appropriate unitsystem,then pressNext.The secondtabis forselectingriverreachstreamlines.The thirdtabisCross SectionsandIB Nodes.Thistablistsall of our cross-sectionsaswell asthe structures.The fourth tab isfor any storage areasor storage connections. Finally, selectFinished –ImportData from the ImportOptionswindow. Perform Steady Simulation Perform Unsteady Simulation Edit/Enter Geometric data Edit/Enter Steadydata Edit/Enter Unsteadydata View cross- sections View Profiles Stage andflow hydrographs
  • 17. EnteringAdditionalDatainthe HEC-RASModel:The GeometricDatawindow canbe usedto entermore data aboutthe stream. i. Cross-SectionPointsFilter:HEC-RASallowsamaximumof 500 data pointspercross- section.HEC-RAShasa cross-sectionpointsfilter,whichwillallow ustodelete excess and duplicate points. ii. Manning’sRoughnessValues(n): We needtoenterManning’s n valuesforeachcross- section.Inthe GeometricData window selectTables/Manning’s n or k values.Inthe EditManning’s n or k Valueswindow,select(All Rivers)fromthe drop-downbox inthe Riveroption.Youwill see all of yourcross-sections andanystructures listedinthe table, withblankspaceswhere youwill type inyourn values. The fields n#1 andn#3 are for the Manning’sn valuesforthe overbanks(floodplains). Similarly,the field n#2is forthe mainchannel Manning’snvalue.Once you’ve populatedthe whole table,selectOK.Make sure yousave yourgeometrydataagain to retainthisinformation.
  • 18. iii. Cross-Sectioneditor:The cross-sectioneditorisusedtosee the cross-sectionpointsand modifyif needed.Clickonthe button(orbyrightclickingonthe cross-sectionsin geometriceditor) tobringthe general/tabularcross-sectioneditorasshown below.The leftside showsthe stationdistance andcorrespondingelevation.The button canbe usedto show/hidethe cross-sectionplotonthe right. Anymodificationtocross-sectioncanbe done by openingthe graphical cross-section editorusing button. iv. RiverProfile:The riverprofile plot,profile tableandxyzplotcan be seenbyleftclicking on the riverin GeometricView. HEC-RAS Simulation UNSTEADY FLOW ANALYSIS HEC-RAScan do steady,unsteadyandquasi-steadysimulation,althoughhere we will giveabrief tutorial on unsteadysimulationonly.  Unsteadydata input and editing: Once the geometricdatais entered,the unsteadyflow dataforsimulationcanbe entered.The unsteady flowdataeditorscreencan be broughtby selecting Unsteady Flow Data fromEditmenu.
  • 19. Here we can enterboundaryconditionsatall the external boundariesof the systemaswell asany desiredinternal locations,andsetthe initial flow andstorage areaconditionsatthe simulation. BoundaryConditions: The primaryboundaryconditionsavailable are -  Stagehydrograph - Upstream/downstreamapplicable  FlowHydrograph - mostlyusedasUpstreamcondition  Rating Curve- downstreamcondition.Shouldbe usedsufficientlydownstreamfromstudyareato minimize anyerrors  NormalDepth - Can be usedas downstreamcondition.Similarlylikeratingcurve shouldbe used sufficientlydownstreamfromstudyareato minimizeanyerrors  Stage/Flowhydrograph - Mixedboundaryconditionwhere stage hydrographisinsertedas upstream boundaryuntil the stage hydrographrunsoutof data, at whichtime the flow hydrographis automaticallyswitchedtoasthe boundarycondition Initial conditions: Initial conditions of the system atthe beginningof unsteadysimulationshould be entered. Itconsistsof stage and flow informationateachof the cross-sectionaswell as elevationfromanystorage areasdefinedinthe system.  PerformingUnsteadyFlowcalculation Afterenteringthe geometryandunsteadyflow data,the unsteadyflow calculationscanbe performed. Thiscanbe done by clicking Unsteady flow analysis inRun menu. There are three componentswhichare usedwhilerunningsimulationwithHEC-RAS GeometricData Preprocessor,Unsteadyflow simulatorandOutputpost-processor. The geometricpreprocessor isusedtoprocessthe geometricdataintoa seriesof hydraulic propertiestables,ratingcurves,andfamilyof ratingcurves.Thisisdone tospeedupthe unsteadyflowcalculations.
  • 20.
  • 21. References: C Goswami, R Pebam, D Chutia, SB Borah, S Sudhakar (2012). Mapping of Flood Inundated Areas of Assam using RADARSAT-2 Satellite Imagery. Project Report; NESAC-SR-87-2012 CM Bhatt, G. Srinivasa Rao, Asiya Begum, P. Manjusree, S. V. S. P. Sharma, L. Prasanna, V. Bhanumurthy (2013). Satellite Images for Extraction of Flood Disaster Footprints and Assessing the Disaster impact: Brahmaputra floods of June–July 2012, Assam, India. Current science; 104(12):1692-1700. UR Rao (1994). Floods and Droughts. IAF COSPAR Symposium on Space Applications for Disaster Prevention, Warning, Mitigation and Relief. Viena Feburary 21-22.