SlideShare a Scribd company logo
1 of 24
North Eastern Space Applications Centre (NESAC)
HYDROLOGY & WATER RESOURCES GROUP
Dr. Ng Romeji, Amaljit Bharali, and Dr. S. Sudhakar
NORTH EASTERN SPACE APPLICATIONS CENTRE
Department of Space, Government of India
Umiam – 793103, Meghalaya (India)
URBAN FLOOD MODELLING – ISG RC 2014
Aspects - URBAN & FLASH FLOODS
Urban flood is one of the emerging hydro-meteorological disasters which has been
causing huge socio-economic losses and disruption to the urbanization process.
Urban flash floods are generally characterized by surge in runoff volumes and flow
velocities, resulting in high flow peaks and water depths
The most common effects of urbanization in hydrological context are reduced
infiltration and decreased travel time, which significantly increase peak discharges
and runoff.
Hydrologic and hydraulic models integrated with geomatic methods (as ground
survey inputs as RTK/ETS/LIDAR/ALTM, etc) provide a viable solution to simulate
the movement of flood waters in intricate urban catchments.
2
Flash Flooding
 Catchment response is very fast
and allows very short lead times
(< 3 to 9 hrs in general)
 A truly hydro-meteorological
forecasting problem
 Coordination of forecasting and
response is challenging over short
times.
Amongst the urban conglomerates of the North East, GUWAHATI city, which serves
as the gateway to most of the other states in the region, perpetually suffer from
urban flash flooding almost every year. The recent flood event between 26 – 27June
2014 witnessed huge grievance to the public and socio-economic losses.
3
URBAN FLOOD HAZARD - GUWAHATI
4
The premise of the study is-
a) Establish flood runoff thresholds in urban catchments – Guwahati City
b) Simulate the flooding process using adaptive hydraulic flood propagation models
c) Compose urban flood hazard zones using integration of ground flood database
(historical database and RTK/ETS survey) and simulated flood layers.
The next attempt is to delve for an operational flood forecasting mechanism in urban
context with ample lead time to assist administrators in flood disaster preparedness using
a coupling of hydro-meteorological modelling aided by real-time radar (as Doppler
Weather Radar) observations.
Numerical Weather Prediction (NWP) models along with nowcasting (RADAR-based
real time observations) aided rainfall early detection can be adopted as one of the
potential tools for urban flash flood forecasting.
STUDY OBJECTIVES - URBAN FLOOD MODELLING
5
1. Historical flood records (files, chronicles etc.) - These are extremely
important sources of information about where these phenomena have occurred in
the past, and what their extent was.
2. Meteorological and hydrological data – This information allows us to
evaluate with a fairly high degree of accuracy where floods have taken place and
what their extent was.
Rainfall data (hourly, daily) for last 10 - 25 years, and predicted NWP rainfall
values
Discharge and water level data of rivers and major drainage channels/storm
sewers
Sewer and drainage network of urban sphere
Cross-section and Longitudinal profiles of rivers and major drainage / sewer
channels
3. Spatial and Ancillary Data
Digital Elevation Model (DEM) in fine resolution, and satellite imagery
Design Flood
Land Use Land Cover
Soil Map
Building Footprints, Streets, and Urban layout layer, etc
DATABASE- URBAN FLOOD MODELLING
URBAN FLOOD MODELLING – METHODOLOGY OUTLINE
Hydro-Meteorological Data Analysis
(Intensity Duration Frequency (IDF),
Storm & Flood Frequency, etc)
Ground Data Collection for Actual Urban
Flooding events that occurred – hydro-met
database for the various event dates (Storm
records, Flooding extents and depths, etc)
HYDROLOGICAL
MODELLING for computing
Flood Hydrographs (using
real-time AWS & WRF data)
Ground Reconciliation Survey
using ETS/RTK/DGPS –
Z-Flood Points and Base Flood
Elevation (BFE) for spatial database
build-up & hydraulic model
integration/calibration
Spatial Database derivatives for urban
flood simulation: Hybrid DEM 1m
Z-flood zones, drainage active
computation areas, etcHYDRUALIC MODEL
SIMULATION for Urban Flood
Inundation Simulation
Schematization of the Simulated Flood Inundation
layers using scale of flood discharges from
hydrographs and ground-based flood extents/depths
(example - Guwahati FHZ, HRVA project © NESAC)
RADAR real-time
observations
(DWR)
Flood Quantitative
thresholding (rainfall
and urban runoff):
possible Flood Alert
situation
Hydro-Meteorological Data Analysis
Monthly total rainfall peaks ranged between 200 mm and 400 mm in the last 10
years. From an assay of daily rainfall data, storm peaks were recorded in around
5th June, 26th June, 30th July and 11th Sept in 2012 at Guwahati (source:
AWS_ISRO1107 Christian Basti & AWS_ISRO1101 Khanapara).
These rainfall storm events have induced flood inundation and waterlogging in
parcels of Guwahati metropolitan.
The analysis of the monthly rainfall data showed that the average annual rainfall
is about 2355mm and out of this about 22% of the annual precipitation occurs in
April & May and about 65% of the precipitation occurs in the period of June, July,
August and September.
It can be introspected that the rainfall intensity has a bearing with the induced
surface overland flow and drainage discharge capacities.
The rainfall data analysis showed that there are storms and surges in the annual
intensity-duration-frequency (IDF) trend in the last 10 years as shown in following
figures.
Daily (2012)
May Jun Jul Aug Sep Oct Nov
Rainfall(mm)
0
20
40
60
80
100
URBAN FLOOD MODELLING
Nowcasting systems use RADAR
(Radio Detection and Ranging) as
DWR to provide quantitative precipitation
forecasts that can potentially afford great
benefits to flood warning and short-term
forecasting in urban settings related with
extreme storm events.
RADAR uses electro-magnetic waves in microwave region to
detect location (range & direction), height (altitude), intensity (in
case of weather systems) and movement of moving and non-
moving targets.
In case of weather echoes like clouds it depends also on physical
state (raindrops, snow, hail etc.) and drop size distribution hydro
meteors. The amount of return power provides information about
the intensity of weather systems and azimuth & elevation of the
antenna gives the location and height of the cloud systems. Modern
day radars, viz., Doppler Weather Radars, employ Doppler principle
to provide information about the speed and direction of the moving
targets.
A combination of high-resolution weather radar precipitation
estimates, physically based distributed hydrological modelling, and
quantitative precipitation nowcasting may be taken as one effective
standard procedure to address urban flood hydrological disaster.
Nowcasting with Doppler Weather Radar (DWR) real-time observation
Max Z Profile
Precipitation Accumulation
Surface Rainfall Intensity
URBAN FLOOD MODELLING – ISG RC 2014 9
GUWAHATI Metropolitan – Ground Survey using RTK/ETS/DGPS
Ground Reconciliation Survey using ETS/RTK/DGPS was conducted to in
selected Z-Flood zones of Guwahati urban catchment.
These ground survey was used to provide vital inputs in the flood hazard
zonation in structuring of Base Flood Elevations (BFE) and structuring of a
hybrid DEM (1 m spatial resolution).
Hybrid Digital Elevation Model (DEM)
The DEM was a fundamental dataset used for development of the urban
catchment hydrological model component in HEC-HMS platform and the
hydraulic flood simulation model in the MIKE FLOOD/HEC-RAS platform. This
dataset formed a vital input in the hydrological-hydraulic model build-up,
and flood hazard layer generation.
URBAN FLOOD HAZARD - GUWAHATIURBAN FLOOD MODELLING
HRVA - URBAN FLOOD HAZARD © NESAC 10
Z-Flood Ground Survey using RTK/ETS/DGPS & Hybrid Digital Elevation Model (DEM) – 1m
URBAN FLOOD HAZARD - GUWAHATI
GUWAHATI : FLOOD HAZARD
Rivers_Channels
Guwahati_FLOOD_Inundation_GMC_2011
FHZ_VeryHigh
FHZ_High
FHZ_Moderate
FHZ_Low
tin1mz
Edge type
Soft Edge
Elevation
500 - 571.572
400 - 500
300 - 400
250 - 300
200 - 250
150 - 200
100 - 150
90 - 100
80 - 90
75 - 80
70 - 75
68 - 70
66 - 68
64 - 66
62 - 64
60 - 62
58 - 60
56 - 58
54 - 56
52 - 54
50 - 52
47.5 - 50
45 - 47.5
42.5 - 45
40 - 42.5
35 - 40
30 - 35
20 - 30
10 - 20
5.747 - 10
URBAN FLOOD MODELLING
HYDROLOGIC & HYDRAULIC MODELLING
11HRVA - URBAN FLOOD HAZARD © NESAC
HRVA - URBAN FLOOD HAZARD © NESAC 12
GUWAHATI Urban Catchment – HYDROLOGICAL MODEL
for Flood Discharge Computations of actual flood events
A quasi-distributed hydrological
model was developed in HEC-HMS
environment for Guwahati urban
catchment and model runs were
carried out for the particular event
dates when actual flood inundation
has taken place in parts and
parcels of Guwahati city.
 Derived flow hydrographs at
drainage reaches, junctions and
outlets for selected storm events
which have actually triggered flash
floods.
URBAN FLOOD MODELLING
HRVA - URBAN FLOOD HAZARD © NESAC 13
GUWAHATI Urban Catchment – Flood Discharge Hydrographs for actual flood events
HRVA: GUWAHATI – Urban Flood Inundation simulation
Flood simulation was carried out for Guwahati urban catchment using the
derived flood hydrographs as the boundary conditions of actual flood
events during 2012 to 2014.
The hydraulic model platform was used to simulate the urban flooding
conditions with the derived Z-flood points from ground survey. The local
drainages (both natural and man-made) leading to the major drainage
channels as Bharalu, Bahini, Bonda, etc were adopted as pilot channels.
Drainage nodes and congestion points were identified and statured based
on the drainage gradient and confluences. These nodes/points were used as
junctions in during the hydraulic model simulation.
Simulation environments were adopted in MIKE FLOOD (DHI) environment.
URBAN FLOOD MODELLING
Urban Flood Simulation – Bathymetry (Topographic) File Preparation
The primary input for the simulation is Bathymetry file, which is in general terms is
the Topographic file combined with the bathymetric survey data.
Extreme care should be taken while preparation of the bathymetric file as accuracy
and stability of the whole setup depends on this. Some basic operations to be used
in the bathymetric file include –
Importing high resolution imageries for proper study of the land use and modifying
the DEM accordingly
Import river, banks and cross-section shapefiles from MIKE 11 setup
Import buildings layer and setting land value in the areas(for urban flooding)
Remove noise and other DEM imperfections using inbuilt filtering techniques
Merge the river bed data with topographic data
Correct sudden changes of river slope and banks which usually occurs due to
DEM errors. Finally enclose the study area with grid lines filled with land values
URBAN FLOOD MODELLING
HRVA - URBAN FLOOD HAZARD © NESAC 16
GUWAHATI Urban Catchment – Hydraulic Flood Modelling
Urban Bathymetry Grid (1m) of one of the selected flood zone (Zoo Tiniali,
Ganeshguri) in Guwahati for the study as processed in MIKE 21
URBAN FLOOD MODELLING
TYPICAL HYDROGRAPHS &
STAGE-DISCHARGE CURVES
USED
HMS obtained Stage &
discharge hydrograph at
Upstream & downstream
of Bharalu
Bharalu @ Zoo
URBAN FLOOD MODELLING – SIMULATION
GUWAHATI: Flood Inundation Simulation of actual flood event using MIKE 21/FLOOD
(DEM/DTM 1m hybrid, AWS rainfall data, etc) – integrated into the spatial FHZ layer
18
URBAN FLOOD INUNDATION SIMULATION
Recent Flood Event in GUWAHATI Metropolitan (26 – 27 June 2014):
Constant discharge was used as boundary condition for Isolated sources and HEC-
HMS obtained hydrographs (Qp = 569 m3/s) as boundaries in Source/Sink pairs
URBAN FLOOD MODELLING – SIMULATION 02
Recent Flood Event in GUWAHATI Metropolitan (26 – 27 June 2014): using Source/Sink pairs
21
URBAN FLOOD MODELLING – CONCLUSIONS & FINDINGS
It was found that floods have occurred with daily total rainfall peaks ranging
between 80 mm to 400 mm (analysis of storm records 2000 - 2014). For instance,
extreme storm events were recorded in and around 5th June, 26th June, 30th July
and 11th Sept in 2012 which have caused flooding in Guwahati metropolitan (source:
AWS_ISRO, AWS_IMD).
Flood frequency and IDF analysis were carried out but not for an extensive period
due to lack of flood discharge data.
The magnitude and time of flood inundation were also analyzed in the MIKE VIEW
& Animator platforms. Specific simulation for the urban flood events of 26 June in
Guwahati (accumulated rainfall of the scale of 57-116 mm in 3 hours) were carried
out to comparatively assess the magnitude and scale of the flooding that were
reported from ground.
 Specific flood zones were selected and simulations carried out with building
footprints, minor drainages/sewers, etc imposed on the bathymetry. From the above
steps, the computed flood runoff peak values and runoff hydrographs was correlated
with the magnitude and spatial extent of flooding in the urban catchment.
22
URBAN FLOOD MODELLING – CONCLUSIONS & FINDINGS
Guwahati metropolitan region has a major land cover of interspersed hillocks and
elevated areas, more than 70% It has been found that parcels of Rajgarh, Anil
Nagar, Nabin Nagar localities and its bye-lanes suffer from perpetual flooding and
were classed as high to very high flood prone zones.
These are used to benchmark flooding thresholds and develop flood forecasting
criterion in urban environments aided with nowcasting ground-based RADAR (as
DWR) integration in support of the quantitative precipitation estimates (QPE),
surface rainfall intensity, etc.
Very High flood hazard ---- Peak Flow, Qp > 120 m3/s
High flood hazard ---- 120 m3/s ≥ Qp > 80 m3/s
Moderate flood hazard ---- 80 m3/s ≥ Qp ≥ 40 m3/s
Low flood hazard ---- Qp < 40 m3/s
(partial outcome of the Hazard Risk & Vulnerability Assessment Project)
23
URBAN FLOOD MODELLING – BOTTOMLINE
Flood prediction needs are unique for any given urban catchment.
The relationship between rainfall estimation error, errors in in-situ rainfall
measurement and consequent runoff computation inaccuracy. Thereby for the flood
forecasting and early warning exercise, a lot of skill and knowledge of the hydro-
meteorological and hydraulic derivatives of the urban catchment system and
transforming it to the ground conditions is essential.
A flood model by linking NWP precipitation forecast, Distributed Hydrological
Model derived flood runoff hydrographs, robust flood threshold database and
real-time Precipitation Estimates from DWR is the core towards prediction and
early warning of eventual urban flash floods.
The urban flood modelling and forecasting imperative is presently in R&D
mode in NER-DRR and under test for selected urban locations in NER
THANKYOUALL
24
Dr. Ngangbam Romeji#1, Amaljit Bharali2, and Dr. Sudhakar Singuluri3
1 Scientist/Engr SD, 2Research Scientist, 3Director
NORTH EASTERN SPACE APPLICATIONS CENTRE
GOVT OF INDIA, DEPT OF SPACE
Umiam – 793103, Meghalaya

More Related Content

What's hot

Flood risk assessment and management
Flood risk assessment and managementFlood risk assessment and management
Flood risk assessment and managementfloodimpat project
 
Estimating Missing Rainfall Data.pptx
Estimating Missing Rainfall Data.pptxEstimating Missing Rainfall Data.pptx
Estimating Missing Rainfall Data.pptxRajdipPaul5
 
1 introduction to hydrology
1 introduction to hydrology1 introduction to hydrology
1 introduction to hydrologyAbdulhakim Mobin
 
population forecasting
population forecastingpopulation forecasting
population forecastingMir Zafarullah
 
variation in demand of water
variation in demand of water variation in demand of water
variation in demand of water Hayat khan
 
Watershed management: Role of Geospatial Technology
Watershed management: Role of Geospatial TechnologyWatershed management: Role of Geospatial Technology
Watershed management: Role of Geospatial Technologyamritpaldigra30
 
Drought - Disaster management
Drought - Disaster managementDrought - Disaster management
Drought - Disaster managementDhruv Saxena
 
Methods of measuring rainfall
Methods of measuring rainfallMethods of measuring rainfall
Methods of measuring rainfallhlksd
 
Seminar on Hydrological modelling
Seminar on Hydrological modellingSeminar on Hydrological modelling
Seminar on Hydrological modellingvishvam Pancholi
 
Precipitation unit 2
Precipitation unit 2 Precipitation unit 2
Precipitation unit 2 Parimal Jha
 
Flood forecasting presentation final
Flood forecasting presentation finalFlood forecasting presentation final
Flood forecasting presentation finalAbir Mohammad
 
Water resources planning and development m5
Water resources planning and development m5Water resources planning and development m5
Water resources planning and development m5Bibhabasu Mohanty
 
Class lecture on Hydrology by Rabindra Ranjan saha Lecture 10
Class lecture on Hydrology by Rabindra Ranjan saha Lecture 10Class lecture on Hydrology by Rabindra Ranjan saha Lecture 10
Class lecture on Hydrology by Rabindra Ranjan saha Lecture 10World University of Bangladesh
 
Flood Mapping using GIS
Flood Mapping using GISFlood Mapping using GIS
Flood Mapping using GISPrabhas Gupta
 

What's hot (20)

Flood risk assessment and management
Flood risk assessment and managementFlood risk assessment and management
Flood risk assessment and management
 
Estimating Missing Rainfall Data.pptx
Estimating Missing Rainfall Data.pptxEstimating Missing Rainfall Data.pptx
Estimating Missing Rainfall Data.pptx
 
1 introduction to hydrology
1 introduction to hydrology1 introduction to hydrology
1 introduction to hydrology
 
population forecasting
population forecastingpopulation forecasting
population forecasting
 
variation in demand of water
variation in demand of water variation in demand of water
variation in demand of water
 
Hydrograph
HydrographHydrograph
Hydrograph
 
Watershed management: Role of Geospatial Technology
Watershed management: Role of Geospatial TechnologyWatershed management: Role of Geospatial Technology
Watershed management: Role of Geospatial Technology
 
Drought - Disaster management
Drought - Disaster managementDrought - Disaster management
Drought - Disaster management
 
Methods of measuring rainfall
Methods of measuring rainfallMethods of measuring rainfall
Methods of measuring rainfall
 
Precipitation and rain gauges
Precipitation and rain gaugesPrecipitation and rain gauges
Precipitation and rain gauges
 
Seminar on Hydrological modelling
Seminar on Hydrological modellingSeminar on Hydrological modelling
Seminar on Hydrological modelling
 
Hydrological modelling
Hydrological modellingHydrological modelling
Hydrological modelling
 
Sediment transport
Sediment transportSediment transport
Sediment transport
 
Introduction to Engineering Hydrology
Introduction to Engineering HydrologyIntroduction to Engineering Hydrology
Introduction to Engineering Hydrology
 
Precipitation unit 2
Precipitation unit 2 Precipitation unit 2
Precipitation unit 2
 
Flood forecasting presentation final
Flood forecasting presentation finalFlood forecasting presentation final
Flood forecasting presentation final
 
Water resources planning and development m5
Water resources planning and development m5Water resources planning and development m5
Water resources planning and development m5
 
Class lecture on Hydrology by Rabindra Ranjan saha Lecture 10
Class lecture on Hydrology by Rabindra Ranjan saha Lecture 10Class lecture on Hydrology by Rabindra Ranjan saha Lecture 10
Class lecture on Hydrology by Rabindra Ranjan saha Lecture 10
 
Flood Mapping using GIS
Flood Mapping using GISFlood Mapping using GIS
Flood Mapping using GIS
 
02 water demand
02 water demand02 water demand
02 water demand
 

Viewers also liked

Training - Hydraulic Flood Modelling
Training - Hydraulic Flood ModellingTraining - Hydraulic Flood Modelling
Training - Hydraulic Flood ModellingAmaljit Bharali
 
Amaljit - Work Report 2016
Amaljit - Work Report 2016Amaljit - Work Report 2016
Amaljit - Work Report 2016Amaljit Bharali
 
Flood - Mitigation & Management
Flood - Mitigation & ManagementFlood - Mitigation & Management
Flood - Mitigation & ManagementAmaljit Bharali
 
Future up-gradations to Flood Warning Systems in Assam
Future up-gradations to Flood Warning Systems in AssamFuture up-gradations to Flood Warning Systems in Assam
Future up-gradations to Flood Warning Systems in AssamAmaljit Bharali
 
Amaljit - Activities NESAC 2014-2015
Amaljit - Activities NESAC 2014-2015Amaljit - Activities NESAC 2014-2015
Amaljit - Activities NESAC 2014-2015Amaljit Bharali
 
NUMERICAL MODELS AS MITIGATION MEASURES FOR RIVERINE AND URBAN FLOOD
NUMERICAL MODELS AS MITIGATION MEASURES FOR RIVERINE AND URBAN FLOODNUMERICAL MODELS AS MITIGATION MEASURES FOR RIVERINE AND URBAN FLOOD
NUMERICAL MODELS AS MITIGATION MEASURES FOR RIVERINE AND URBAN FLOODAmaljit Bharali
 
GIS PROCEDURE FOR PRELIMINARY EVALUATION OF POTENTIAL HYDROPOWER SITES
GIS PROCEDURE FOR PRELIMINARY EVALUATION OF POTENTIAL HYDROPOWER SITESGIS PROCEDURE FOR PRELIMINARY EVALUATION OF POTENTIAL HYDROPOWER SITES
GIS PROCEDURE FOR PRELIMINARY EVALUATION OF POTENTIAL HYDROPOWER SITESFrancis Mitchell
 
2015 Upload Campaigns Calendar - SlideShare
2015 Upload Campaigns Calendar - SlideShare2015 Upload Campaigns Calendar - SlideShare
2015 Upload Campaigns Calendar - SlideShareSlideShare
 
What to Upload to SlideShare
What to Upload to SlideShareWhat to Upload to SlideShare
What to Upload to SlideShareSlideShare
 
Getting Started With SlideShare
Getting Started With SlideShareGetting Started With SlideShare
Getting Started With SlideShareSlideShare
 

Viewers also liked (14)

Training - Hydraulic Flood Modelling
Training - Hydraulic Flood ModellingTraining - Hydraulic Flood Modelling
Training - Hydraulic Flood Modelling
 
Topology in ArcGIS
Topology in ArcGISTopology in ArcGIS
Topology in ArcGIS
 
Flash flood
Flash floodFlash flood
Flash flood
 
Amaljit - Work Report 2016
Amaljit - Work Report 2016Amaljit - Work Report 2016
Amaljit - Work Report 2016
 
Flood - Mitigation & Management
Flood - Mitigation & ManagementFlood - Mitigation & Management
Flood - Mitigation & Management
 
Future up-gradations to Flood Warning Systems in Assam
Future up-gradations to Flood Warning Systems in AssamFuture up-gradations to Flood Warning Systems in Assam
Future up-gradations to Flood Warning Systems in Assam
 
Amaljit - Activities NESAC 2014-2015
Amaljit - Activities NESAC 2014-2015Amaljit - Activities NESAC 2014-2015
Amaljit - Activities NESAC 2014-2015
 
NUMERICAL MODELS AS MITIGATION MEASURES FOR RIVERINE AND URBAN FLOOD
NUMERICAL MODELS AS MITIGATION MEASURES FOR RIVERINE AND URBAN FLOODNUMERICAL MODELS AS MITIGATION MEASURES FOR RIVERINE AND URBAN FLOOD
NUMERICAL MODELS AS MITIGATION MEASURES FOR RIVERINE AND URBAN FLOOD
 
GIS PROCEDURE FOR PRELIMINARY EVALUATION OF POTENTIAL HYDROPOWER SITES
GIS PROCEDURE FOR PRELIMINARY EVALUATION OF POTENTIAL HYDROPOWER SITESGIS PROCEDURE FOR PRELIMINARY EVALUATION OF POTENTIAL HYDROPOWER SITES
GIS PROCEDURE FOR PRELIMINARY EVALUATION OF POTENTIAL HYDROPOWER SITES
 
SlideShare 101
SlideShare 101SlideShare 101
SlideShare 101
 
Succession “Losers”: What Happens to Executives Passed Over for the CEO Job?
Succession “Losers”: What Happens to Executives Passed Over for the CEO Job? Succession “Losers”: What Happens to Executives Passed Over for the CEO Job?
Succession “Losers”: What Happens to Executives Passed Over for the CEO Job?
 
2015 Upload Campaigns Calendar - SlideShare
2015 Upload Campaigns Calendar - SlideShare2015 Upload Campaigns Calendar - SlideShare
2015 Upload Campaigns Calendar - SlideShare
 
What to Upload to SlideShare
What to Upload to SlideShareWhat to Upload to SlideShare
What to Upload to SlideShare
 
Getting Started With SlideShare
Getting Started With SlideShareGetting Started With SlideShare
Getting Started With SlideShare
 

Similar to URBAN FLOOD - ISG 2014

Mathematical modeling approach for flood management
Mathematical modeling approach for flood managementMathematical modeling approach for flood management
Mathematical modeling approach for flood managementprjpublications
 
Data Goldmines
Data GoldminesData Goldmines
Data GoldminesDon Talend
 
A Study on Intensity of Rainfall in Urban Bangalore Areas
A Study on Intensity of Rainfall in Urban Bangalore AreasA Study on Intensity of Rainfall in Urban Bangalore Areas
A Study on Intensity of Rainfall in Urban Bangalore AreasIRJET Journal
 
Rainfall Runoff Modelling on the Lower Tapi Basin using HEC-HMS
Rainfall Runoff Modelling on the Lower Tapi Basin using HEC-HMSRainfall Runoff Modelling on the Lower Tapi Basin using HEC-HMS
Rainfall Runoff Modelling on the Lower Tapi Basin using HEC-HMSAnkit Balyan MBA, B.Tech.
 
Floodplain Modelling Materials and Methodology
Floodplain Modelling Materials and MethodologyFloodplain Modelling Materials and Methodology
Floodplain Modelling Materials and MethodologyIDES Editor
 
213180005 Seminar presentation.pptx
213180005 Seminar presentation.pptx213180005 Seminar presentation.pptx
213180005 Seminar presentation.pptxKUNDESHWARPUNDALIK
 
IUKWC Workshop Nov16: Developing Hydro-climatic Services for Water Security –...
IUKWC Workshop Nov16: Developing Hydro-climatic Services for Water Security –...IUKWC Workshop Nov16: Developing Hydro-climatic Services for Water Security –...
IUKWC Workshop Nov16: Developing Hydro-climatic Services for Water Security –...India UK Water Centre (IUKWC)
 
journal of engineering and applied science 18.pdf
journal of engineering and applied science 18.pdfjournal of engineering and applied science 18.pdf
journal of engineering and applied science 18.pdfnareshkotra
 
journal of applied science and engineering.pdf
journal of applied science and engineering.pdfjournal of applied science and engineering.pdf
journal of applied science and engineering.pdfnareshkotra
 
DEM GENERATION AND RIVER ANALYSIS USING HEC-RAS MODEL, HARIDWAR DISTRICT, UTT...
DEM GENERATION AND RIVER ANALYSIS USING HEC-RAS MODEL, HARIDWAR DISTRICT, UTT...DEM GENERATION AND RIVER ANALYSIS USING HEC-RAS MODEL, HARIDWAR DISTRICT, UTT...
DEM GENERATION AND RIVER ANALYSIS USING HEC-RAS MODEL, HARIDWAR DISTRICT, UTT...IRJET Journal
 
FLOOD FREQUENCY ANALYSIS FOR RIVER GAUGING STATION OF MEENACHIL RIVER, KOTTAY...
FLOOD FREQUENCY ANALYSIS FOR RIVER GAUGING STATION OF MEENACHIL RIVER, KOTTAY...FLOOD FREQUENCY ANALYSIS FOR RIVER GAUGING STATION OF MEENACHIL RIVER, KOTTAY...
FLOOD FREQUENCY ANALYSIS FOR RIVER GAUGING STATION OF MEENACHIL RIVER, KOTTAY...IRJET Journal
 
Ice flooding 2015 - dhi delegate pack-v2
Ice flooding 2015 - dhi delegate pack-v2Ice flooding 2015 - dhi delegate pack-v2
Ice flooding 2015 - dhi delegate pack-v2Stephen Flood
 
Flood estimation
Flood estimation Flood estimation
Flood estimation RAJ BAIRWA
 
Santillan assessing the-impacts_of_flooding_caused_by_extreme_rainfall_events...
Santillan assessing the-impacts_of_flooding_caused_by_extreme_rainfall_events...Santillan assessing the-impacts_of_flooding_caused_by_extreme_rainfall_events...
Santillan assessing the-impacts_of_flooding_caused_by_extreme_rainfall_events...Vanrosco
 

Similar to URBAN FLOOD - ISG 2014 (20)

Mathematical modeling approach for flood management
Mathematical modeling approach for flood managementMathematical modeling approach for flood management
Mathematical modeling approach for flood management
 
Mathematical modeling
Mathematical modelingMathematical modeling
Mathematical modeling
 
Data Goldmines
Data GoldminesData Goldmines
Data Goldmines
 
A Study on Intensity of Rainfall in Urban Bangalore Areas
A Study on Intensity of Rainfall in Urban Bangalore AreasA Study on Intensity of Rainfall in Urban Bangalore Areas
A Study on Intensity of Rainfall in Urban Bangalore Areas
 
Rainfall Runoff Modelling on the Lower Tapi Basin using HEC-HMS
Rainfall Runoff Modelling on the Lower Tapi Basin using HEC-HMSRainfall Runoff Modelling on the Lower Tapi Basin using HEC-HMS
Rainfall Runoff Modelling on the Lower Tapi Basin using HEC-HMS
 
Floodplain Modelling Materials and Methodology
Floodplain Modelling Materials and MethodologyFloodplain Modelling Materials and Methodology
Floodplain Modelling Materials and Methodology
 
213180005 Seminar presentation.pptx
213180005 Seminar presentation.pptx213180005 Seminar presentation.pptx
213180005 Seminar presentation.pptx
 
IUKWC Workshop Nov16: Developing Hydro-climatic Services for Water Security –...
IUKWC Workshop Nov16: Developing Hydro-climatic Services for Water Security –...IUKWC Workshop Nov16: Developing Hydro-climatic Services for Water Security –...
IUKWC Workshop Nov16: Developing Hydro-climatic Services for Water Security –...
 
journal of engineering and applied science 18.pdf
journal of engineering and applied science 18.pdfjournal of engineering and applied science 18.pdf
journal of engineering and applied science 18.pdf
 
journal of applied science and engineering.pdf
journal of applied science and engineering.pdfjournal of applied science and engineering.pdf
journal of applied science and engineering.pdf
 
Smart ICT for Weather and Water
Smart ICT for Weather and WaterSmart ICT for Weather and Water
Smart ICT for Weather and Water
 
DEM GENERATION AND RIVER ANALYSIS USING HEC-RAS MODEL, HARIDWAR DISTRICT, UTT...
DEM GENERATION AND RIVER ANALYSIS USING HEC-RAS MODEL, HARIDWAR DISTRICT, UTT...DEM GENERATION AND RIVER ANALYSIS USING HEC-RAS MODEL, HARIDWAR DISTRICT, UTT...
DEM GENERATION AND RIVER ANALYSIS USING HEC-RAS MODEL, HARIDWAR DISTRICT, UTT...
 
Hwre en nu 35,44
Hwre en nu 35,44Hwre en nu 35,44
Hwre en nu 35,44
 
CE573_Poster2
CE573_Poster2CE573_Poster2
CE573_Poster2
 
FLOOD FREQUENCY ANALYSIS FOR RIVER GAUGING STATION OF MEENACHIL RIVER, KOTTAY...
FLOOD FREQUENCY ANALYSIS FOR RIVER GAUGING STATION OF MEENACHIL RIVER, KOTTAY...FLOOD FREQUENCY ANALYSIS FOR RIVER GAUGING STATION OF MEENACHIL RIVER, KOTTAY...
FLOOD FREQUENCY ANALYSIS FOR RIVER GAUGING STATION OF MEENACHIL RIVER, KOTTAY...
 
Swat model
Swat model Swat model
Swat model
 
Final Ppt.pdf
Final Ppt.pdfFinal Ppt.pdf
Final Ppt.pdf
 
Ice flooding 2015 - dhi delegate pack-v2
Ice flooding 2015 - dhi delegate pack-v2Ice flooding 2015 - dhi delegate pack-v2
Ice flooding 2015 - dhi delegate pack-v2
 
Flood estimation
Flood estimation Flood estimation
Flood estimation
 
Santillan assessing the-impacts_of_flooding_caused_by_extreme_rainfall_events...
Santillan assessing the-impacts_of_flooding_caused_by_extreme_rainfall_events...Santillan assessing the-impacts_of_flooding_caused_by_extreme_rainfall_events...
Santillan assessing the-impacts_of_flooding_caused_by_extreme_rainfall_events...
 

Recently uploaded

Forest laws, Indian forest laws, why they are important
Forest laws, Indian forest laws, why they are importantForest laws, Indian forest laws, why they are important
Forest laws, Indian forest laws, why they are importantadityabhardwaj282
 
Recombinant DNA technology( Transgenic plant and animal)
Recombinant DNA technology( Transgenic plant and animal)Recombinant DNA technology( Transgenic plant and animal)
Recombinant DNA technology( Transgenic plant and animal)DHURKADEVIBASKAR
 
Is RISC-V ready for HPC workload? Maybe?
Is RISC-V ready for HPC workload? Maybe?Is RISC-V ready for HPC workload? Maybe?
Is RISC-V ready for HPC workload? Maybe?Patrick Diehl
 
Best Call Girls In Sector 29 Gurgaon❤️8860477959 EscorTs Service In 24/7 Delh...
Best Call Girls In Sector 29 Gurgaon❤️8860477959 EscorTs Service In 24/7 Delh...Best Call Girls In Sector 29 Gurgaon❤️8860477959 EscorTs Service In 24/7 Delh...
Best Call Girls In Sector 29 Gurgaon❤️8860477959 EscorTs Service In 24/7 Delh...lizamodels9
 
Twin's paradox experiment is a meassurement of the extra dimensions.pptx
Twin's paradox experiment is a meassurement of the extra dimensions.pptxTwin's paradox experiment is a meassurement of the extra dimensions.pptx
Twin's paradox experiment is a meassurement of the extra dimensions.pptxEran Akiva Sinbar
 
Microphone- characteristics,carbon microphone, dynamic microphone.pptx
Microphone- characteristics,carbon microphone, dynamic microphone.pptxMicrophone- characteristics,carbon microphone, dynamic microphone.pptx
Microphone- characteristics,carbon microphone, dynamic microphone.pptxpriyankatabhane
 
Call Girls in Munirka Delhi 💯Call Us 🔝9953322196🔝 💯Escort.
Call Girls in Munirka Delhi 💯Call Us 🔝9953322196🔝 💯Escort.Call Girls in Munirka Delhi 💯Call Us 🔝9953322196🔝 💯Escort.
Call Girls in Munirka Delhi 💯Call Us 🔝9953322196🔝 💯Escort.aasikanpl
 
SOLUBLE PATTERN RECOGNITION RECEPTORS.pptx
SOLUBLE PATTERN RECOGNITION RECEPTORS.pptxSOLUBLE PATTERN RECOGNITION RECEPTORS.pptx
SOLUBLE PATTERN RECOGNITION RECEPTORS.pptxkessiyaTpeter
 
Cytokinin, mechanism and its application.pptx
Cytokinin, mechanism and its application.pptxCytokinin, mechanism and its application.pptx
Cytokinin, mechanism and its application.pptxVarshiniMK
 
Gas_Laws_powerpoint_notes.ppt for grade 10
Gas_Laws_powerpoint_notes.ppt for grade 10Gas_Laws_powerpoint_notes.ppt for grade 10
Gas_Laws_powerpoint_notes.ppt for grade 10ROLANARIBATO3
 
Speech, hearing, noise, intelligibility.pptx
Speech, hearing, noise, intelligibility.pptxSpeech, hearing, noise, intelligibility.pptx
Speech, hearing, noise, intelligibility.pptxpriyankatabhane
 
Grafana in space: Monitoring Japan's SLIM moon lander in real time
Grafana in space: Monitoring Japan's SLIM moon lander  in real timeGrafana in space: Monitoring Japan's SLIM moon lander  in real time
Grafana in space: Monitoring Japan's SLIM moon lander in real timeSatoshi NAKAHIRA
 
Call Girls in Aiims Metro Delhi 💯Call Us 🔝9953322196🔝 💯Escort.
Call Girls in Aiims Metro Delhi 💯Call Us 🔝9953322196🔝 💯Escort.Call Girls in Aiims Metro Delhi 💯Call Us 🔝9953322196🔝 💯Escort.
Call Girls in Aiims Metro Delhi 💯Call Us 🔝9953322196🔝 💯Escort.aasikanpl
 
Module 4: Mendelian Genetics and Punnett Square
Module 4:  Mendelian Genetics and Punnett SquareModule 4:  Mendelian Genetics and Punnett Square
Module 4: Mendelian Genetics and Punnett SquareIsiahStephanRadaza
 
Call Girls in Munirka Delhi 💯Call Us 🔝8264348440🔝
Call Girls in Munirka Delhi 💯Call Us 🔝8264348440🔝Call Girls in Munirka Delhi 💯Call Us 🔝8264348440🔝
Call Girls in Munirka Delhi 💯Call Us 🔝8264348440🔝soniya singh
 
Call Girls In Nihal Vihar Delhi ❤️8860477959 Looking Escorts In 24/7 Delhi NCR
Call Girls In Nihal Vihar Delhi ❤️8860477959 Looking Escorts In 24/7 Delhi NCRCall Girls In Nihal Vihar Delhi ❤️8860477959 Looking Escorts In 24/7 Delhi NCR
Call Girls In Nihal Vihar Delhi ❤️8860477959 Looking Escorts In 24/7 Delhi NCRlizamodels9
 
TOTAL CHOLESTEROL (lipid profile test).pptx
TOTAL CHOLESTEROL (lipid profile test).pptxTOTAL CHOLESTEROL (lipid profile test).pptx
TOTAL CHOLESTEROL (lipid profile test).pptxdharshini369nike
 
Solution chemistry, Moral and Normal solutions
Solution chemistry, Moral and Normal solutionsSolution chemistry, Moral and Normal solutions
Solution chemistry, Moral and Normal solutionsHajira Mahmood
 
Heredity: Inheritance and Variation of Traits
Heredity: Inheritance and Variation of TraitsHeredity: Inheritance and Variation of Traits
Heredity: Inheritance and Variation of TraitsCharlene Llagas
 

Recently uploaded (20)

Forest laws, Indian forest laws, why they are important
Forest laws, Indian forest laws, why they are importantForest laws, Indian forest laws, why they are important
Forest laws, Indian forest laws, why they are important
 
Recombinant DNA technology( Transgenic plant and animal)
Recombinant DNA technology( Transgenic plant and animal)Recombinant DNA technology( Transgenic plant and animal)
Recombinant DNA technology( Transgenic plant and animal)
 
Is RISC-V ready for HPC workload? Maybe?
Is RISC-V ready for HPC workload? Maybe?Is RISC-V ready for HPC workload? Maybe?
Is RISC-V ready for HPC workload? Maybe?
 
Best Call Girls In Sector 29 Gurgaon❤️8860477959 EscorTs Service In 24/7 Delh...
Best Call Girls In Sector 29 Gurgaon❤️8860477959 EscorTs Service In 24/7 Delh...Best Call Girls In Sector 29 Gurgaon❤️8860477959 EscorTs Service In 24/7 Delh...
Best Call Girls In Sector 29 Gurgaon❤️8860477959 EscorTs Service In 24/7 Delh...
 
Twin's paradox experiment is a meassurement of the extra dimensions.pptx
Twin's paradox experiment is a meassurement of the extra dimensions.pptxTwin's paradox experiment is a meassurement of the extra dimensions.pptx
Twin's paradox experiment is a meassurement of the extra dimensions.pptx
 
Microphone- characteristics,carbon microphone, dynamic microphone.pptx
Microphone- characteristics,carbon microphone, dynamic microphone.pptxMicrophone- characteristics,carbon microphone, dynamic microphone.pptx
Microphone- characteristics,carbon microphone, dynamic microphone.pptx
 
Call Girls in Munirka Delhi 💯Call Us 🔝9953322196🔝 💯Escort.
Call Girls in Munirka Delhi 💯Call Us 🔝9953322196🔝 💯Escort.Call Girls in Munirka Delhi 💯Call Us 🔝9953322196🔝 💯Escort.
Call Girls in Munirka Delhi 💯Call Us 🔝9953322196🔝 💯Escort.
 
SOLUBLE PATTERN RECOGNITION RECEPTORS.pptx
SOLUBLE PATTERN RECOGNITION RECEPTORS.pptxSOLUBLE PATTERN RECOGNITION RECEPTORS.pptx
SOLUBLE PATTERN RECOGNITION RECEPTORS.pptx
 
Cytokinin, mechanism and its application.pptx
Cytokinin, mechanism and its application.pptxCytokinin, mechanism and its application.pptx
Cytokinin, mechanism and its application.pptx
 
Gas_Laws_powerpoint_notes.ppt for grade 10
Gas_Laws_powerpoint_notes.ppt for grade 10Gas_Laws_powerpoint_notes.ppt for grade 10
Gas_Laws_powerpoint_notes.ppt for grade 10
 
Speech, hearing, noise, intelligibility.pptx
Speech, hearing, noise, intelligibility.pptxSpeech, hearing, noise, intelligibility.pptx
Speech, hearing, noise, intelligibility.pptx
 
Grafana in space: Monitoring Japan's SLIM moon lander in real time
Grafana in space: Monitoring Japan's SLIM moon lander  in real timeGrafana in space: Monitoring Japan's SLIM moon lander  in real time
Grafana in space: Monitoring Japan's SLIM moon lander in real time
 
Call Girls in Aiims Metro Delhi 💯Call Us 🔝9953322196🔝 💯Escort.
Call Girls in Aiims Metro Delhi 💯Call Us 🔝9953322196🔝 💯Escort.Call Girls in Aiims Metro Delhi 💯Call Us 🔝9953322196🔝 💯Escort.
Call Girls in Aiims Metro Delhi 💯Call Us 🔝9953322196🔝 💯Escort.
 
Module 4: Mendelian Genetics and Punnett Square
Module 4:  Mendelian Genetics and Punnett SquareModule 4:  Mendelian Genetics and Punnett Square
Module 4: Mendelian Genetics and Punnett Square
 
Call Girls in Munirka Delhi 💯Call Us 🔝8264348440🔝
Call Girls in Munirka Delhi 💯Call Us 🔝8264348440🔝Call Girls in Munirka Delhi 💯Call Us 🔝8264348440🔝
Call Girls in Munirka Delhi 💯Call Us 🔝8264348440🔝
 
Hot Sexy call girls in Moti Nagar,🔝 9953056974 🔝 escort Service
Hot Sexy call girls in  Moti Nagar,🔝 9953056974 🔝 escort ServiceHot Sexy call girls in  Moti Nagar,🔝 9953056974 🔝 escort Service
Hot Sexy call girls in Moti Nagar,🔝 9953056974 🔝 escort Service
 
Call Girls In Nihal Vihar Delhi ❤️8860477959 Looking Escorts In 24/7 Delhi NCR
Call Girls In Nihal Vihar Delhi ❤️8860477959 Looking Escorts In 24/7 Delhi NCRCall Girls In Nihal Vihar Delhi ❤️8860477959 Looking Escorts In 24/7 Delhi NCR
Call Girls In Nihal Vihar Delhi ❤️8860477959 Looking Escorts In 24/7 Delhi NCR
 
TOTAL CHOLESTEROL (lipid profile test).pptx
TOTAL CHOLESTEROL (lipid profile test).pptxTOTAL CHOLESTEROL (lipid profile test).pptx
TOTAL CHOLESTEROL (lipid profile test).pptx
 
Solution chemistry, Moral and Normal solutions
Solution chemistry, Moral and Normal solutionsSolution chemistry, Moral and Normal solutions
Solution chemistry, Moral and Normal solutions
 
Heredity: Inheritance and Variation of Traits
Heredity: Inheritance and Variation of TraitsHeredity: Inheritance and Variation of Traits
Heredity: Inheritance and Variation of Traits
 

URBAN FLOOD - ISG 2014

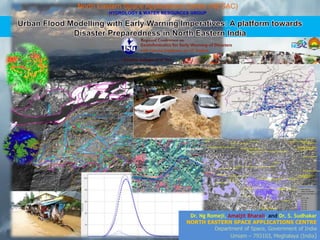
  • 1. North Eastern Space Applications Centre (NESAC) HYDROLOGY & WATER RESOURCES GROUP Dr. Ng Romeji, Amaljit Bharali, and Dr. S. Sudhakar NORTH EASTERN SPACE APPLICATIONS CENTRE Department of Space, Government of India Umiam – 793103, Meghalaya (India)
  • 2. URBAN FLOOD MODELLING – ISG RC 2014 Aspects - URBAN & FLASH FLOODS Urban flood is one of the emerging hydro-meteorological disasters which has been causing huge socio-economic losses and disruption to the urbanization process. Urban flash floods are generally characterized by surge in runoff volumes and flow velocities, resulting in high flow peaks and water depths The most common effects of urbanization in hydrological context are reduced infiltration and decreased travel time, which significantly increase peak discharges and runoff. Hydrologic and hydraulic models integrated with geomatic methods (as ground survey inputs as RTK/ETS/LIDAR/ALTM, etc) provide a viable solution to simulate the movement of flood waters in intricate urban catchments. 2 Flash Flooding  Catchment response is very fast and allows very short lead times (< 3 to 9 hrs in general)  A truly hydro-meteorological forecasting problem  Coordination of forecasting and response is challenging over short times.
  • 3. Amongst the urban conglomerates of the North East, GUWAHATI city, which serves as the gateway to most of the other states in the region, perpetually suffer from urban flash flooding almost every year. The recent flood event between 26 – 27June 2014 witnessed huge grievance to the public and socio-economic losses. 3 URBAN FLOOD HAZARD - GUWAHATI
  • 4. 4 The premise of the study is- a) Establish flood runoff thresholds in urban catchments – Guwahati City b) Simulate the flooding process using adaptive hydraulic flood propagation models c) Compose urban flood hazard zones using integration of ground flood database (historical database and RTK/ETS survey) and simulated flood layers. The next attempt is to delve for an operational flood forecasting mechanism in urban context with ample lead time to assist administrators in flood disaster preparedness using a coupling of hydro-meteorological modelling aided by real-time radar (as Doppler Weather Radar) observations. Numerical Weather Prediction (NWP) models along with nowcasting (RADAR-based real time observations) aided rainfall early detection can be adopted as one of the potential tools for urban flash flood forecasting. STUDY OBJECTIVES - URBAN FLOOD MODELLING
  • 5. 5 1. Historical flood records (files, chronicles etc.) - These are extremely important sources of information about where these phenomena have occurred in the past, and what their extent was. 2. Meteorological and hydrological data – This information allows us to evaluate with a fairly high degree of accuracy where floods have taken place and what their extent was. Rainfall data (hourly, daily) for last 10 - 25 years, and predicted NWP rainfall values Discharge and water level data of rivers and major drainage channels/storm sewers Sewer and drainage network of urban sphere Cross-section and Longitudinal profiles of rivers and major drainage / sewer channels 3. Spatial and Ancillary Data Digital Elevation Model (DEM) in fine resolution, and satellite imagery Design Flood Land Use Land Cover Soil Map Building Footprints, Streets, and Urban layout layer, etc DATABASE- URBAN FLOOD MODELLING
  • 6. URBAN FLOOD MODELLING – METHODOLOGY OUTLINE Hydro-Meteorological Data Analysis (Intensity Duration Frequency (IDF), Storm & Flood Frequency, etc) Ground Data Collection for Actual Urban Flooding events that occurred – hydro-met database for the various event dates (Storm records, Flooding extents and depths, etc) HYDROLOGICAL MODELLING for computing Flood Hydrographs (using real-time AWS & WRF data) Ground Reconciliation Survey using ETS/RTK/DGPS – Z-Flood Points and Base Flood Elevation (BFE) for spatial database build-up & hydraulic model integration/calibration Spatial Database derivatives for urban flood simulation: Hybrid DEM 1m Z-flood zones, drainage active computation areas, etcHYDRUALIC MODEL SIMULATION for Urban Flood Inundation Simulation Schematization of the Simulated Flood Inundation layers using scale of flood discharges from hydrographs and ground-based flood extents/depths (example - Guwahati FHZ, HRVA project © NESAC) RADAR real-time observations (DWR) Flood Quantitative thresholding (rainfall and urban runoff): possible Flood Alert situation
  • 7. Hydro-Meteorological Data Analysis Monthly total rainfall peaks ranged between 200 mm and 400 mm in the last 10 years. From an assay of daily rainfall data, storm peaks were recorded in around 5th June, 26th June, 30th July and 11th Sept in 2012 at Guwahati (source: AWS_ISRO1107 Christian Basti & AWS_ISRO1101 Khanapara). These rainfall storm events have induced flood inundation and waterlogging in parcels of Guwahati metropolitan. The analysis of the monthly rainfall data showed that the average annual rainfall is about 2355mm and out of this about 22% of the annual precipitation occurs in April & May and about 65% of the precipitation occurs in the period of June, July, August and September. It can be introspected that the rainfall intensity has a bearing with the induced surface overland flow and drainage discharge capacities. The rainfall data analysis showed that there are storms and surges in the annual intensity-duration-frequency (IDF) trend in the last 10 years as shown in following figures. Daily (2012) May Jun Jul Aug Sep Oct Nov Rainfall(mm) 0 20 40 60 80 100 URBAN FLOOD MODELLING
  • 8. Nowcasting systems use RADAR (Radio Detection and Ranging) as DWR to provide quantitative precipitation forecasts that can potentially afford great benefits to flood warning and short-term forecasting in urban settings related with extreme storm events. RADAR uses electro-magnetic waves in microwave region to detect location (range & direction), height (altitude), intensity (in case of weather systems) and movement of moving and non- moving targets. In case of weather echoes like clouds it depends also on physical state (raindrops, snow, hail etc.) and drop size distribution hydro meteors. The amount of return power provides information about the intensity of weather systems and azimuth & elevation of the antenna gives the location and height of the cloud systems. Modern day radars, viz., Doppler Weather Radars, employ Doppler principle to provide information about the speed and direction of the moving targets. A combination of high-resolution weather radar precipitation estimates, physically based distributed hydrological modelling, and quantitative precipitation nowcasting may be taken as one effective standard procedure to address urban flood hydrological disaster. Nowcasting with Doppler Weather Radar (DWR) real-time observation Max Z Profile Precipitation Accumulation Surface Rainfall Intensity
  • 9. URBAN FLOOD MODELLING – ISG RC 2014 9 GUWAHATI Metropolitan – Ground Survey using RTK/ETS/DGPS Ground Reconciliation Survey using ETS/RTK/DGPS was conducted to in selected Z-Flood zones of Guwahati urban catchment. These ground survey was used to provide vital inputs in the flood hazard zonation in structuring of Base Flood Elevations (BFE) and structuring of a hybrid DEM (1 m spatial resolution). Hybrid Digital Elevation Model (DEM) The DEM was a fundamental dataset used for development of the urban catchment hydrological model component in HEC-HMS platform and the hydraulic flood simulation model in the MIKE FLOOD/HEC-RAS platform. This dataset formed a vital input in the hydrological-hydraulic model build-up, and flood hazard layer generation. URBAN FLOOD HAZARD - GUWAHATIURBAN FLOOD MODELLING
  • 10. HRVA - URBAN FLOOD HAZARD © NESAC 10 Z-Flood Ground Survey using RTK/ETS/DGPS & Hybrid Digital Elevation Model (DEM) – 1m URBAN FLOOD HAZARD - GUWAHATI GUWAHATI : FLOOD HAZARD Rivers_Channels Guwahati_FLOOD_Inundation_GMC_2011 FHZ_VeryHigh FHZ_High FHZ_Moderate FHZ_Low tin1mz Edge type Soft Edge Elevation 500 - 571.572 400 - 500 300 - 400 250 - 300 200 - 250 150 - 200 100 - 150 90 - 100 80 - 90 75 - 80 70 - 75 68 - 70 66 - 68 64 - 66 62 - 64 60 - 62 58 - 60 56 - 58 54 - 56 52 - 54 50 - 52 47.5 - 50 45 - 47.5 42.5 - 45 40 - 42.5 35 - 40 30 - 35 20 - 30 10 - 20 5.747 - 10 URBAN FLOOD MODELLING
  • 11. HYDROLOGIC & HYDRAULIC MODELLING 11HRVA - URBAN FLOOD HAZARD © NESAC
  • 12. HRVA - URBAN FLOOD HAZARD © NESAC 12 GUWAHATI Urban Catchment – HYDROLOGICAL MODEL for Flood Discharge Computations of actual flood events A quasi-distributed hydrological model was developed in HEC-HMS environment for Guwahati urban catchment and model runs were carried out for the particular event dates when actual flood inundation has taken place in parts and parcels of Guwahati city.  Derived flow hydrographs at drainage reaches, junctions and outlets for selected storm events which have actually triggered flash floods. URBAN FLOOD MODELLING
  • 13. HRVA - URBAN FLOOD HAZARD © NESAC 13 GUWAHATI Urban Catchment – Flood Discharge Hydrographs for actual flood events
  • 14. HRVA: GUWAHATI – Urban Flood Inundation simulation Flood simulation was carried out for Guwahati urban catchment using the derived flood hydrographs as the boundary conditions of actual flood events during 2012 to 2014. The hydraulic model platform was used to simulate the urban flooding conditions with the derived Z-flood points from ground survey. The local drainages (both natural and man-made) leading to the major drainage channels as Bharalu, Bahini, Bonda, etc were adopted as pilot channels. Drainage nodes and congestion points were identified and statured based on the drainage gradient and confluences. These nodes/points were used as junctions in during the hydraulic model simulation. Simulation environments were adopted in MIKE FLOOD (DHI) environment. URBAN FLOOD MODELLING
  • 15. Urban Flood Simulation – Bathymetry (Topographic) File Preparation The primary input for the simulation is Bathymetry file, which is in general terms is the Topographic file combined with the bathymetric survey data. Extreme care should be taken while preparation of the bathymetric file as accuracy and stability of the whole setup depends on this. Some basic operations to be used in the bathymetric file include – Importing high resolution imageries for proper study of the land use and modifying the DEM accordingly Import river, banks and cross-section shapefiles from MIKE 11 setup Import buildings layer and setting land value in the areas(for urban flooding) Remove noise and other DEM imperfections using inbuilt filtering techniques Merge the river bed data with topographic data Correct sudden changes of river slope and banks which usually occurs due to DEM errors. Finally enclose the study area with grid lines filled with land values URBAN FLOOD MODELLING
  • 16. HRVA - URBAN FLOOD HAZARD © NESAC 16 GUWAHATI Urban Catchment – Hydraulic Flood Modelling Urban Bathymetry Grid (1m) of one of the selected flood zone (Zoo Tiniali, Ganeshguri) in Guwahati for the study as processed in MIKE 21 URBAN FLOOD MODELLING
  • 17. TYPICAL HYDROGRAPHS & STAGE-DISCHARGE CURVES USED HMS obtained Stage & discharge hydrograph at Upstream & downstream of Bharalu Bharalu @ Zoo URBAN FLOOD MODELLING – SIMULATION
  • 18. GUWAHATI: Flood Inundation Simulation of actual flood event using MIKE 21/FLOOD (DEM/DTM 1m hybrid, AWS rainfall data, etc) – integrated into the spatial FHZ layer 18 URBAN FLOOD INUNDATION SIMULATION
  • 19. Recent Flood Event in GUWAHATI Metropolitan (26 – 27 June 2014): Constant discharge was used as boundary condition for Isolated sources and HEC- HMS obtained hydrographs (Qp = 569 m3/s) as boundaries in Source/Sink pairs URBAN FLOOD MODELLING – SIMULATION 02
  • 20. URBAN FLOOD MODELLING – SIMULATION 02 Recent Flood Event in GUWAHATI Metropolitan (26 – 27 June 2014): using Source/Sink pairs
  • 21. 21 URBAN FLOOD MODELLING – CONCLUSIONS & FINDINGS It was found that floods have occurred with daily total rainfall peaks ranging between 80 mm to 400 mm (analysis of storm records 2000 - 2014). For instance, extreme storm events were recorded in and around 5th June, 26th June, 30th July and 11th Sept in 2012 which have caused flooding in Guwahati metropolitan (source: AWS_ISRO, AWS_IMD). Flood frequency and IDF analysis were carried out but not for an extensive period due to lack of flood discharge data. The magnitude and time of flood inundation were also analyzed in the MIKE VIEW & Animator platforms. Specific simulation for the urban flood events of 26 June in Guwahati (accumulated rainfall of the scale of 57-116 mm in 3 hours) were carried out to comparatively assess the magnitude and scale of the flooding that were reported from ground.  Specific flood zones were selected and simulations carried out with building footprints, minor drainages/sewers, etc imposed on the bathymetry. From the above steps, the computed flood runoff peak values and runoff hydrographs was correlated with the magnitude and spatial extent of flooding in the urban catchment.
  • 22. 22 URBAN FLOOD MODELLING – CONCLUSIONS & FINDINGS Guwahati metropolitan region has a major land cover of interspersed hillocks and elevated areas, more than 70% It has been found that parcels of Rajgarh, Anil Nagar, Nabin Nagar localities and its bye-lanes suffer from perpetual flooding and were classed as high to very high flood prone zones. These are used to benchmark flooding thresholds and develop flood forecasting criterion in urban environments aided with nowcasting ground-based RADAR (as DWR) integration in support of the quantitative precipitation estimates (QPE), surface rainfall intensity, etc. Very High flood hazard ---- Peak Flow, Qp > 120 m3/s High flood hazard ---- 120 m3/s ≥ Qp > 80 m3/s Moderate flood hazard ---- 80 m3/s ≥ Qp ≥ 40 m3/s Low flood hazard ---- Qp < 40 m3/s (partial outcome of the Hazard Risk & Vulnerability Assessment Project)
  • 23. 23 URBAN FLOOD MODELLING – BOTTOMLINE Flood prediction needs are unique for any given urban catchment. The relationship between rainfall estimation error, errors in in-situ rainfall measurement and consequent runoff computation inaccuracy. Thereby for the flood forecasting and early warning exercise, a lot of skill and knowledge of the hydro- meteorological and hydraulic derivatives of the urban catchment system and transforming it to the ground conditions is essential. A flood model by linking NWP precipitation forecast, Distributed Hydrological Model derived flood runoff hydrographs, robust flood threshold database and real-time Precipitation Estimates from DWR is the core towards prediction and early warning of eventual urban flash floods. The urban flood modelling and forecasting imperative is presently in R&D mode in NER-DRR and under test for selected urban locations in NER
  • 24. THANKYOUALL 24 Dr. Ngangbam Romeji#1, Amaljit Bharali2, and Dr. Sudhakar Singuluri3 1 Scientist/Engr SD, 2Research Scientist, 3Director NORTH EASTERN SPACE APPLICATIONS CENTRE GOVT OF INDIA, DEPT OF SPACE Umiam – 793103, Meghalaya