Understanding Flood Risk Using Surface Flood Extent Modelling. This study used ArcMap and HECRAS to evaluate flood risk exposure of River Wansbeck in Morpeth, UK.
3. Introduction
• Floods in the United Kingdom (UK) are one of the
most notable climate-related disasters and also
the costliest natural disaster.
• In 2009, 5.2 million residential and commercial
properties in England were identified as being in
areas at risk of flooding from rivers, the sea and
surface water (Defra and EA, 2012).
• According to EA (2009), there is an estimate 2.4
million properties already built in the floodplain.
• Increase in Population and Urbanization =
Increase exposure to flood risk.
• Since Risk = Hazard * Vulnerability * Exposure
• Morpeth is located on the down stream
section of the River Wansbeck catchment.
• Catchment area = 287.3 km2
• Elevation: Lowest - 31.4m , Highest - 440
4. Overview of the HEC-RAS
• HEC-RAS is hydrological modelling software developed by the U.S. Army Corps of
Engineers (USACE)
• The HEC-RAS system contains four one-dimensional river analysis components
for:
• Steady flow water surface profile computations;
• Unsteady flow simulation;
• Movable boundary sediment transport computations; and
• Water quality analysis.
(Horritt and Bates, 2002)
5. Why model?
• Flood modelling makes it possible to analyse the behaviour of rivers
• Extrapolated extreme (peak) flow behaviour of the river and its impact
on the flood plain.
• To understand risk you now can MODEL it, NOT experience it
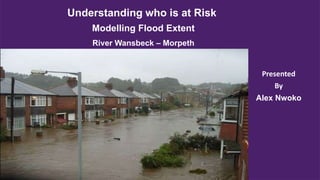
6. The 2008 Morpeth Flood
• Caused by heavy sustained rainfall in the
preceding 24 hours.
• The River Wansbeck burst its banks and
inundated the town’s flood defences, causing
damage to 995 properties, 906 of which were
residential.
• 56% of rain fall was converted into surface
runoff (increase in urbanisation since 1963!)
• 400 residents were evacuated.
• Total losses estimated at £40 million.
• 6 September 2008 : Largest event on record.
• Other recent Severe Events
• 25 September 2012 : 10’s of properties
affected
8. Methodology
Manning's Selection for Channels
- Irregularity in the Channel – Width and Depth
- Variations in channel cross section
- Obstruction to flow (i.e. Boulders, debris and bridges)- Shape and Size
- Vegetation in channel (depends on depth of flow and vegetation density)
- Meandering
This could increase the “n” value by 30% but mostly in confined channels.
In open channel with floodplains like Morpeth, effect of meanders is reduced (Chow,
1959)
Manning's Selection for flood plains
• Vegetation Density
• Vegetation type
• Obstruction to flow - Isolated boulders
• Surface Irregularity
• Nature of Bedrock- E.g urban areas.
• "Roughness" is represented in using flow velocity equations such as the Manning's equation
16. Optimized cross section output
Flood event Flood extent
2008 flood 408536.21
50 Year 530788.07
100 Year 684392.54
1000 Year 963599.04
17. Definition Appropriate uses Policy Aims
Zone 1 (Low Probability):
Land assessed as having a less than 1 in 1000
annual probability of river or sea flooding in any
year (<0.1%).
All uses of land are appropriate in this zone. In this zone, developers and local authorities should seek
opportunities to reduce the overall level of food risk in the area
and beyond through the layout and form of the
development, and the appropriate application of sustainable
drainage techniques.
Zone 2 (Medium Probability):
Land having between 1 in 100 and 1 in 1000
annual probability of river flooding (1%- 0.1%) or
between a 1 in 200 and 1 in1000 annual probability
of sea flooding (0.5% - 0.1%)In any year.
The water-compatible, less vulnerable and more vulnerable
uses of land and essential infrastructure in Table D.2 are
appropriate in this zone. Subject to the Sequential Test being
applied, the highly vulnerable uses in Table d.2 are only
appropriate in this zone if the Exception Test is passed.
In this zone, developers and local authorities should seek
opportunities to reduce the overall level of flood risk in the
area through the layout and form of the development, and the
appropriate application of sustainable drainage techniques.
Zone 3a (High Probability):
Land assessed as having a 1 in 100 year or greater
annual probability of river flooding (>1%) or a 1 in
200 or greater annual probability of flooding from
the sea (>0.5%) in any year.
The water-compatible and less vulnerable uses of land in Table
D.2 are appropriate in this zone. The highly vulnerable uses in
Table D.2 should not be permitted in this zone.
In this zone, developers and local authorities should seek
opportunities to:
Reduce the overall level of flood risk in the area through the
layout and form of the development and the appropriate
application of sustainable drainage techniques.
Zone 3b (The Functional Floodplain):
Land with a an annual flood probability of 1 in 20
(5%) or greater in any year, or is designed to flood in
an extreme (0.1%) flood, should provide a starting
point for consideration and discussions to identify
the functional floodplain.
Only the water-compatible uses and the essential
infrastructure listed in Table D.2 that has to be there should
be permitted in this zone
In this zone, developers and local authorities should seek
opportunities to:
Reduce the overall level of flood risk in the area through the
layout and form of the development and the appropriate
application of sustainable drainage techniques
Planning Policy - The Sequential Test (PPS 25) (Pardoe et al. 2011; DCLG 2006)
18. Flood Alleviation Scheme (FAS)
• Combination of : – Upstream storage and Town
defences (new and upgraded)
• Flood Management Strategies and implications
• Structural
Cost- benefit-based
High maintenance cost
• Non structural
Land-demanding
Costly over large area.
• 50 year return period flood defences
• 1m -1.5m flood defences given our results
19. Climate Change Effect
• The effects of climate change are expected to
increase the frequency and intensity of flooding in
Morpeth.
• Current defences and culverts were not designed
to accommodate increased river flows and
therefore cannot deal with the effects of climate
change.
• The catchment maybe sensitive to climate change
and due to the relatively quick response to rainfall
and little natural attenuation in the catchment.
• Hence, any increases in rainfall would be reflected
in immediate increased river flow.
• 20% increase in river flow as a result of climate
change (Defra’s climate change guidance )
• Increase the flood risk to properties in Morpeth.
20. Environmental Considerations
• Flood defences and channel dredging
pose threat to biodiversity.
• Crayfish and Fisheries – River
Wansbeck is the most important
water course in North East for these
species.
• High priority –Bed diversity
important for sustainability of
channel for crayfish
21. Flood Risk Assessment Limitations
• Errors in digitizing river geometry
• Number of Cross-Sections
• Errors in Data acquisition (data accuracy/ missing data)
• Effect of tributaries on flow energy assumption
• Flood defence.
22. Summary
• Flood extent modelling involves a lot of parameterization to improve accuracy of
abstraction – Hence, Expert judgement is key.
• Every catchment (channel & floodplain) is complex – Spatial and temporal variability in manning’s
R estimation.
• Spatial and time resolution of data affects our understanding of flood risk
• - DEM resolution would affect flood inundation output (Tate et al, 2002; Haile and Rientjes, 2005; Sanders,
2007)
- Return period and predicted discharge calculation
- Flood modelling parameters have serious land use planning and insurance policy implications (de MOEL and
Aerts, 2011; Pardoe et al., 2011)
- Flood alleviation Scheme usually involve ethical and cost benefit considerations in flood
protection and mitigation.
- Environmental Considerations
23. References
• de MOEL, H. and Aerts, J.C.J.H., 2011. Effect of uncertainty in land use, damage models and inundation depth on flood
damage estimates. Natural Hazards, 58(1), pp.407-425.
• DEFRA & EA, 2012. Understanding the risks , empowering communities , building resilience : the national flood and coastal
erosion risk management strategy for England Unnumbered Act paper Correction required for the map on page 8 , figure 3
- Main urban areas at risk of su. Water Management, pp.2010–2012.
• Department for Communities and Local Government (CLG): Plan- ning Policy Statement 25: Development and Flood Risk,
CLG, London, 2006a
• Environmental Agency (EA), 2009. Flooding in England. Environment, p.36.
• Haile, A.T. and Rientjes, T.H.M., 2005. Effects of LiDAR DEM resolution in flood modelling: a model sensitivity study for the
city of Tegucigalpa, Honduras. ISPRS WG III/3, III/4, 3, pp.12-14.
• Horritt, M.S. and Bates, P.D., 2002. Evaluation of 1D and 2D numerical models for predicting river flood inundation. Journal
of hydrology, 268(1), pp.87-99.
• Pardoe, J., Penning-Rowsell, E. and Tunstall, S., 2011. Floodplain conflicts: regulation and negotiation. Natural Hazards and
Earth System Sciences,11(10), pp.2889-2902.
• Sanders, B.F., 2007. Evaluation of on-line DEMs for flood inundation modeling. Advances in Water Resources, 30(8),
pp.1831-1843.
• Tate, E.C., Maidment, D.R., Olivera, F. and Anderson, D.J., 2002. Creating a terrain model for floodplain mapping. Journal of
Hydrologic Engineering, 7(2), pp.100-108.