Simulating hydrologic response to climate change and drought with an integrat...
Hillslope poster_PAEP_finaldraft2
1. Sarah M. Lavin1, Daniel J. Bain1, Erin Copeland2
Background Methods
At left are scaled soil profiles for
each site showing hue, texture, and
location of soil moisture sensors.
Four HOBO® EC-5 Smart Sensors
were installed at each site
throughout the soil profile.
The sensors measured volumetric
water content (θV) at 1 - 5 minute
intervals. Soil moisture data from the
probes was recorded using a HOBO®
U-30 data logger.
300 600 900 1200 1500
Time (min)
0.25
0.27
0.29
0.31
0.33
0.35
VolumetricWaterContent
0.6
0.4
0.2
Precipitation(in)
Peak Duration
Drainage
Peak Soil
Moisture
Antecedent
Soil Moisture
0
Storm events > 0.05in were analyzed for duration, size, and time since last storm.
If the soil moisture data showed a response to these storm events, it was further analyzed
for antecedent soil moisture condition, wetting rate, time to peak after start of storm, peak
soil moisture, peak duration, and drainage rate. The image below shows a storm response in
soil moisture and the factors of interest.
Beacon Street – Bottom-middle
Results
Soil Moisture MeasurementStormwater Management
Impermeable cover in urban areas prevents the
infiltration of precipitation into soils and instead
redirects surface run-off from storm events into
sewer systems
In Pittsburgh, aging sewer infrastructure is less
capable of managing the large volumes of
stormwater entering these systems and leads to
degradation of structures, flood events, and
overflow into the local waterways from an
antiquated combined sewer system (See image at
right).
Stormwater management practices utilize green
infrastructure to help mitigate the amount of
runoff entering the sewers
Image Credit: EPA
Infiltration-based green infrastructure,
such as infiltration trenches
(represented at left), enhance
infiltration of water into the subsurface,
thus decreasing the amount of runoff
entering local waterways and sewer
systems.
Here we present pre-treatment soil
moisture data characterizing soil water
dynamics in Pittsburgh where
infiltration-based green infrastructure
was installed
Uncompacted
soils
Trench with
gravel fill
Perforated
pipe redirects
overflow
Infiltration Trench
Swale assists with
retention
Site Description
Relative Saturation Time Series
5/1/2012 5/24/2012 6/16/2012 7/9/2012 8/1/2012
Date
20
40
60
80
100
120
RelativeSaturation(%)
0.6
0.4
0.2
Precipitation(in)
Schenley Drive
Top
Top-middle
Bottom-middle
Bottom
Rainfall
5/1/2012 5/24/2012 6/16/2012 7/9/2012 8/1/2012
Date
20
40
60
80
100
120
RelativeSaturation(%)
0.6
0.4
0.2
Precipitation(in)
Beacon Street
Top
Top-middle
Bottom-middle
Bottom
Rainfall
Slow
Drainage
High variance
in top layer
Lower layers commonly
80-100% saturated
Rapid
Drainage
Lower layers commonly
70-100% saturated
High variance
in top layer
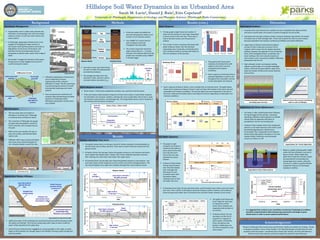
The graphs below show a continuous record of relative saturation and precipitation at
the two study sites for May-July 2012. There were a total of 38 storm events over this
period of time.
At Beacon Street, the top layer shows the greatest variance in soil moisture and drains
more rapidly than deeper layers. Deeper soils remain relatively saturated, and even
after draining, the soils retain more water than upper layers.
At Schenley Drive, the top layer also shows the greatest variance in soil moisture , but
each layer shows similar responses to storm events and similar drainage patterns. The
site overall displays more rapid and complete drainage than soils at Beacon Street.
Schenley Driver- Top-middle
Volumetric Water Content
Frequency(103)
Saturation values were determined
for each soil layer through graphical
and statistical analyses.
The average was taken from the
saturation mode, and then used to
calculate relative saturation (θsat).
Storm Response Analysis
The two study sites are located on
hillslopes in Schenley Park, Pittsburgh,
on Schenley Drive and Beacon Street.
The University of Pittsburgh rain gauge
provides daily precipitation records at
15min intervals, and is located close to
the park.
NRCS Soil Survey classifies the soils at
each site as deep, well-drained Gilpin-
Upshur soils.
Hillshade relief maps are pictured below;
the arrows show relative flowpaths of
soil- and groundwater around the sites.
Appalachian Plateau Hillslopes
Uplift and erosion of the landscape has caused vertical stress-relief fracturing in both
the valleys and hillsides. The fractures along valley walls make an ideal conduit for
water to flow downhill to the valley floor
Vertical fracture flow becomes negligible at increasing depths in the valley, so water
begins to flow laterally out through seeps in the hillsides, forming contact springs and
perched aquifers
Local soils made of
colluvial silts and
clays
Tensile fractures
promote vertical
movement of
water
Near-horizontal layers of
interbedded shale,
limestone, and sandstone
Soilwater and
groundwater drains
downslope to valleys
Seepage from
contact springs
Results (cont.)
Storm Response
Soil Water Dynamics
The graph at right
compares soil moisture
conditions (θV) before a
storm event to the time
since the last storm
(hrs) at the two sites,
separated by sensor
location.
At Beacon Street (blue),
the top soils dry faster
over time than deeper
soils. Drainage rate
decreases for each
successive layer, with
the bottom layers
retaining more of their
soil water over time.
Discussion
Saturation
Mode
The bar graph at right shows the number of
times the soil moisture in each layer responded
to storm events at the two sites. There were a
total of 38 storm events over the period of
analysis.
The number of storm responses decreased with
depth at Beacon Street, with the top layer
responding most. Conversely, at Schenley Drive
storm response tends to increase with depth at,
with the exception of the top layer.
Storm response at Beacon Street is more complex than at Schenley Drive. The graph below
shows storm responses at Beacon Street in each soil layer with respect to the storm size and
antecedent soil moisture conditions. The top two layers are more responsive to the size of
the storm, whereas the bottom layers only respond to storms depending on antecedent soil
moisture conditions.
At Schenley Drive (red), the top soils drain faster, and the bottom layer retains more soil water
over time. This is similar to the pattern observed at Beacon Street, however, soils at Beacon
Street are generally wetter than at Schenley Drive and drain slower between storm events.
1University of Pittsburgh, Department of Geology and Planetary Science; 2Pittsburgh Parks Conservancy
Silty-clay
loam
Clay loam
Sandy Clay
Sandy Clay
Silty-clay
Silty-clay
Clay
Clay
96 cm
70 cm
40 cm
15 cm11 cm
37 cm
64 cm
83 cm
Beacon Street Schenley Drive
Top
Top-
Middle
Bottom-
Middle
Bottom
The graph at left shows the
time it takes for each layer
to respond to a storm
event. Storm numbers are
sequential with the date of
occurrence.
At Beacon Street, the top
two layers are the first to
respond to a majority of
storm events. At Schenley
Drive, the bottom and
bottom-middle layers are
the first to respond to most
storm events.
Rain Gauge
Schenley Drive
Beacon Street
Schenley Drive Beacon Street
Image adapted from Sheetz & Kozar 2000.
Diagram is not to scale*
Hydrological Analyses
Implications for Green Infrastructure
Schenley DriveBeacon Street
Schenley Drive soils drained more rapidly and more completely than Beacon Street,
and had an overall lower soil moisture content throughout the soil profile.
Soils below the top layer at Beacon Street remained relatively saturated for the period
of analysis due to slow drainage rates. These soils respond less often to storm events
because antecedent soil moisture conditions prohibited stormwaterinfiltration.
Upper layers at Beacon Street had the highest
number of storm responses and were first to
respond, which means the site display top-down
wetting. However, the opposite is true at Schenley
Drive, which displayed bottom-up wetting. Top-
down wetting is the more natural response to
storm events, and is caused by rainwater infiltrating
downwards into the soil.
High soilwater content and atypical wetting
regimes could be signs of a complex hydrologic
system, influenced by groundwater inputs from
leaky stormwater infrastructure and/or bedrock
fracture flow.
Cracked stormwater infrastructure could
be leaking water into soils.
Bedrock fracture flow may be contributing
water to soils on hillslopes.
• Soil water is often redistributed down hillslopes
during drainage and dry periods. A properly
operating infiltration trench placed on a hillside
should allow for adequate infiltration of
precipitation into the surrounding soils.
• However, these analyses show that unexpected
patterns in soil water dynamics exist which could
potentially degrade green infrastructure
functionality. This is especially true for Beacon
Street where high relative saturation in the soils
already inhibits infiltration and stormwater
returns as surface run-off.
• Below is a graph showing water height
within the two infiltration trenches at
Beacon Street. Water height data
taken from inside the trenches reveals
the potential for functionality loss
during large storm events, when the
structure is unable to quickly infiltrate
substantial volumes of stormwater,
leading to overflow.
Expectations for Trench Operation
Expectations Given Observations
Trench overflow
during large storm
event
• It is suggested that continuous pre-installation monitoring of hydrological conditions
should be conducted before determining proper placement and design of green
infrastructure in order to assure optimum performance.
Acknowledgments
Thanks to Pittsburgh Parks Conservancy and Richard K. Mellon Foundation for funding. Thanks
to lab group members such as Krissy Hopkins, Erin Pfeil-McCullough, and Rob Rossi for their
assistance with the project. I would also like to thank Tyler Paulina, Joe Pold, Bruk Berhanu,
Kristen Fenati, Justin Hynicka, and Trevor Bublitz for assistance with field work.
The graph at left shows storm
response at Schenley Drive with
respect to the storm size and
antecedent soil moisture
conditions.
Storm response at Schenley Drive is
primarily dependent on storm size
throughout the soil profile, and not
on the antecedent soil moisture.