
Recommended
Recommended
More Related Content
What's hot
What's hot (20)
Similar to Consumer behaviour for soft drinks
Similar to Consumer behaviour for soft drinks (20)
More from AishwaryaSinha29
Recently uploaded
Recently uploaded (20)
Consumer behaviour for soft drinks
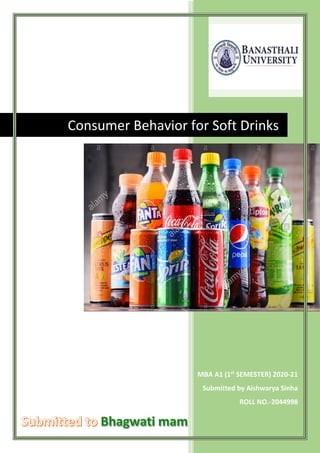
- 1. MBA A1 (1st SEMESTER) 2020-21 Submitted by Aishwarya Sinha ROLL NO.-2044998 Consumer Behavior for Soft Drinks
- 2. AISHWARYA SINHA ROLL NO-2044998 AISHWARYA SINHA ROLL NO-2044998 CONTENT Introduction Literature Review Methodology Research Findings Conclusion Suggestions Questionnaire
- 3. AISHWARYA SINHA ROLL NO-2044998 AISHWARYA SINHA ROLL NO-2044998 Introduction The soft-drink industry incorporates organizations that produce non-alcoholic refreshments and carbonated mineral waters or thinks and syrups for the assembling of carbonated drinks. Soft products have been well accepted by consumers and gradually overtaking hot drinks as the biggest beverage sector in the world. Amidst the quickly developing soft drink interest, the industry overall is encountering new opportunities and challenges. Changing purchaser requests and inclinations require better approaches for keeping up current clients and drawing in new ones because of weighty competition, the beverage companies much focus towards customers and companies have to offer high quality products, efficiently distribute them, ensure safety and keep prices low all while stayingnimble enough to exploit new markets by launching new products. The major constituent of our body is fluid, it is an essential requirement that need to be fulfilled. In modern life there are different kind of soft drinks are available in market such as carbonated drinks, juice, fruits drinks.
- 4. AISHWARYA SINHA ROLL NO-2044998 AISHWARYA SINHA ROLL NO-2044998 Now a days these drinks have been part of the life of all of us, we all are well aware of these awards: ❖Mountain dew - darr ke aage jeet Hai ❖Coca cola - taste the feeling ❖Thumbs up - taste the thunder ❖Mazza - har ghoont ras bhara aam ❖Fanta - drink fanta, stay bamboocha ❖7UP - do more with 7up ❖Sprite - obey your thirst Today soft drink not only reduce the thirst but also has become style and fashion. The interest of survey is to know what people like most about soft drinks and what attracts them toward these products.
- 5. AISHWARYA SINHA ROLL NO-2044998 AISHWARYA SINHA ROLL NO-2044998 Literature Review There are numerous studies on buying behaviour but there are only few studies on buying behaviour towards soft drinks in a study. The study examines regularly purchase products and focused on largest supermarket assortment categories such as carbonated soft drinks, canned soups, cereals. Within the category, consumers often purchase multiple products and multiple units of each alternative selected on a given trip. Currently the world is rising competition where there are numerous brands selling the homogenous products, consumers have a plentiful number of choices and many diverse factors influence their buying behaviour. In such a scenario, this analysis can help in structuring and formulating different strategies for maximizing profit. This study tried to find the factors affecting consumer's buying behaviour, with the focus on two commonly used products. The brand and media played a significant role to influence consumer towards a specific brand. Because of convenience in carrying, tetra pack was most preferred one studied factor influencing consumer preferences for milk. They were milk quality, convenient availability, supply in quantity desired, flavour, colour, freshness and mode of payment showed higher levels of consumer satisfaction. But packaging and
- 6. AISHWARYA SINHA ROLL NO-2044998 AISHWARYA SINHA ROLL NO-2044998 labelling are not as important for winning over consumers, according to findings published in the journal Food Quality and Preference, the study involved consumers at distinct stages of development and highlights the importance of adopting a “sensory marketing approach,” said the researchers from French research organization. The consumption of soft drinks is influenced by multiple factors that can be categorised as environmental, social, and personal factors. Additionally, when consumption is dependent on multiple factors, an ecological approach to the study of consumption behaviour has been suggested as the most effective.
- 7. AISHWARYA SINHA ROLL NO-2044998 AISHWARYA SINHA ROLL NO-2044998 Methodology of The Research OBJECTIVES 1. To understand consumer perception toward soft drinks. 2. To understand purchase behaviour of consumer. 3.To understand relationship between demography of population and purchase behaviour. 4. To understand what people prefer most towards soft drinks. SIGNIFICANCE To gain knowledge and this study will serve as a theoretical model for future studies of the same nature if ever the existing problem has penetrated in this case will exist in the future. Future researchers will benefit from this study, and it will provide them the facts needed to compare their study during their respective time and usability. RESEARCH The primary data was obtained by administering survey method, guided by questionnaire to the customers. The two types of questions, were asked in the questionnaire such as Rank and Multiple-choice questions. The Secondary data was
- 8. AISHWARYA SINHA ROLL NO-2044998 AISHWARYA SINHA ROLL NO-2044998 collected through articles, journals, magazines, newspapers and internet etc. The study is restricted to five products of Coco Cola brand such as Coco-Cola, Thumps up, Limca, Sprite and Mazza. There were seven factors sorted out from previous studies such as Taste, Price, Advertisement, Brand name, Friends Circle, Quality and Availability. Research Design Descriptive research Research Method Survey method Research Instrument Structured questionnaire Sample size 82 Sample unit Geographical sample unit Sampling Convenient sampling (non-probability) Parameter of interest Most popular soft drinks among people. criteria of selection of selection of soft drinks by people. Data Collection Data collection is a methodical process of gathering and analysing specific information to proffer solutions to relevant questions and evaluate the results. It focuses on finding out all there is to a particular subject matter. For collectors of data, there is a range of outcomes for which the data is collected. But the key purpose for which data is collected is to put a researcher in a vantage position to make predictions about future probabilities and trends.
- 9. AISHWARYA SINHA ROLL NO-2044998 AISHWARYA SINHA ROLL NO-2044998 Consumer’s age group Ages Frequency Percent Valid percent Cumulative percent 0-10 03 2 2 2 10-20 08 10 10 12 20-30 60 73 73 85 30-40 05 6 6 91 40-50 02 4 4 95 50-60 04 5 5 100 Total 82 4% 10% 73% 6% 2% 5% Consumer's age group 0--10 10--20 20--30 30--40 40--50 50--60
- 10. AISHWARYA SINHA ROLL NO-2044998 AISHWARYA SINHA ROLL NO-2044998 Assumed Mean Method The formula of the assumed mean method is: Here, a = assumed mean fi = frequency of 6th class di = xi – a = deviation of 6th class Σfi = n = Total number of observations Ages Frequency xi di = xi – a fi di 0-10 03 5 -2 -6 10-20 08 15 -1 -8 20-30 60 25=a 0 0 30-40 05 35 1 5 40-50 02 45 2 4 50-60 04 55 3 12 n=82 Σfi di = 7 Mean= 25+(10*7)/82 = 25+0.85 = 25.85
- 11. AISHWARYA SINHA ROLL NO-2044998 AISHWARYA SINHA ROLL NO-2044998 Median Here, l = the lower limit of the median class n = total frequency cf = the cumulative frequency of the preceding the medium class f = the frequency of the median class h = the magnitude of median class Ages Frequency cf 0-10 03 3 10-20 08 11=cf 20-30 60 71 30-40 05 76 40-50 02 78 50-60 04 82 n=82 Median= 20+(82/2-11) *10/60 = 20+(41-11) *10/60 = 20+300/60 =20+5 = 25
- 12. AISHWARYA SINHA ROLL NO-2044998 AISHWARYA SINHA ROLL NO-2044998 Mode Here, l = lower limit of the modal class f1 = Frequency of the modal class f0 = Frequency of the class just preceding the modal class f-1 = Frequency of the class just succeeding the modal class c = the magnitude of median class Ages Frequency 0-10 03 10-20 08=f-1 20-30 60=f0 30-40 05=f1 40-50 02 50-60 04 n=82 Mode=20+10[(60-8)/(2*60-8-5)] = 20+10*(52/107) = 20+4.85 =24.85
- 13. AISHWARYA SINHA ROLL NO-2044998 AISHWARYA SINHA ROLL NO-2044998 Consumer’s occupation Occupation Frequency Percent Valid percent Cumulative percent Businessman 5 6.1 6.1 6.1 Student 58 70.7 70.7 76.8 Private job 8 9.8 9.8 86.6 Government job 5 6.1 6.1 92.7 Other 6 7.3 7.3 100 Total 82
- 14. AISHWARYA SINHA ROLL NO-2044998 AISHWARYA SINHA ROLL NO-2044998 Gender of consumer Gender Frequency Percent Valid percent Cumulative percent Male 38 46.3 46.3 46.3 Female 44 53.7 53.7 100 Total 82 Do you consume soft drink?
- 15. AISHWARYA SINHA ROLL NO-2044998 AISHWARYA SINHA ROLL NO-2044998 Preference of soft drinks Soft drinks Frequency Percent Valid percent Cumulative percent Coca cola 14 17.3 17.3 17.3 Pepsi 7 8.6 8.6 25.9 Thumbs up 9 11.1 11.1 37 Fanta 1 1.23 1.23 38.23 Slice 5 6.17 6.17 44.4 Mazza 14 17.3 17.3 61.7 Sprite 12 14.8 14.8 76.5 Limca 2 2.5 2.5 79 Fruity 2 2.5 2.5 81.5 7 up 3 3.7 3.7 85.2 Mountain dew 5 6.17 6.17 91.37 Mirinda 1 1.23 1.23 92.6 Dr. Pepper 0 0 0 92.6 Frooti 6 7.4 7.4 100 Total 81
- 16. AISHWARYA SINHA ROLL NO-2044998 AISHWARYA SINHA ROLL NO-2044998 Consume soft drink Consume Soft drinks Frequency Percent Valid percent Cumulative percent Daily 4 4.9 4.9 4.9 Less than 5 times 54 66.7 66.7 71.6 6-10 times 16 19.8 19.8 91.4 10-15 times 5 6.1 6.1 97.5 More than 15 times 2 2.5 2.5 100 Total 81
- 17. AISHWARYA SINHA ROLL NO-2044998 AISHWARYA SINHA ROLL NO-2044998 Prefer soft drink most When prefer Soft drinks Frequency Percent Valid percent Cumulative percent Feeling thirsty 11 13.4 13.4 13.4 Party or celebrations 25 30.5 30.5 43.9 Without any reason 28 34.1 34.1 78 With guests 7 8.6 8.6 86.6 Other 11 13.4 13.4 100 Total 82
- 18. AISHWARYA SINHA ROLL NO-2044998 AISHWARYA SINHA ROLL NO-2044998 Package preferred by consumer Packaging Frequency Percent Valid percent Cumulative percent PET bottle 34 42 42 42 Small can 30 37 37 79 Glass bottle 17 21 21 100 Total 81 Does consumer always consume same soft drink?
- 19. AISHWARYA SINHA ROLL NO-2044998 AISHWARYA SINHA ROLL NO-2044998 Purchases from which place Places Frequency Percent Valid percent Cumulative percent Canteen 2 2.5 2.5 2.5 Restaurants 7 8.5 8.5 11 Bus stand 0 0 0 11 Nearby store 64 78 78 89 Movie theater 2 2.5 2.5 91.5 Other 7 8.5 8.5 100 Total 82
- 20. AISHWARYA SINHA ROLL NO-2044998 AISHWARYA SINHA ROLL NO-2044998 Consumer attracts towards advertisement Advertisement Frequency Percent Valid percent Cumulative percent To lesser extent 15 19 19 19 To less extent 16 20.3 20.3 39.3 Neutral 45 57 57 96.3 To great extent 3 3.7 3.7 100 To greater extent 0 0 0 100 Total 79
- 21. AISHWARYA SINHA ROLL NO-2044998 AISHWARYA SINHA ROLL NO-2044998 Time of consumption Time consumption Frequency Percent Valid percent Cumulative percent Morning 0 0 0 0 Afternoon 10 12.2 12.2 12.2 Evening 20 24.4 24.4 36.6 Night 3 3.6 3.6 40.2 No fix time 49 59.8 59.8 100 Total 82 Consuming soft drinks has negative effect on your health
- 22. AISHWARYA SINHA ROLL NO-2044998 AISHWARYA SINHA ROLL NO-2044998 Findings · Majority of respondents are female. · Most of the respondents belong to the age group of 20 to 30. · Most of the students prefer soft drinks. · During survey we know most of the people prefer Coca cola and Mazza. · Many customers prefer soft drink without any reason. · Many customers prefer PET bottle. · Most of them purchase soft drink from nearby store. · There is no fix time for drinking soft drink. · Most of the customer knows the negative effect of soft drinks on health but still they drink.
- 23. AISHWARYA SINHA ROLL NO-2044998 AISHWARYA SINHA ROLL NO-2044998 Conclusion 1.Youngsters prefers carbonated drinks whereas most of older and service people prefers juice and milk products. 2.Brand name plays major role in selection of product followed by taste and flavour. 3.Most of the consumer were found in age group 20-30 years with 73.17%,10-20years with 9.77. 4.The view of consumer on the consumption of the soft drink on the basis of time is as follow, No specific time 59.8%, evening 24.4%, afternoon 12.2%, morning 0%, night 3.6%. 5.We came to conclusion that visibility affects the sales in a very special way and in term of advertisement the brand ambassador, creativity, Idea of sending message is most attracting feature. 6.In today’s scenario customer is the King, they have got various choice around him, they prefer their taste and price.
- 24. AISHWARYA SINHA ROLL NO-2044998 AISHWARYA SINHA ROLL NO-2044998 Suggestions ❖ They should make such a slogan that attracts the consumers of all ages and gender. ❖ They should keep in mind the different age groups. ❖ As the demand of carbonated drink is more, they should use this point for attracting customers. ❖ They should ensure the availability of soft drinks around playground etc because people use soft drinks when they feel thirsty. ❖ They should attract people by a most likes ambassador.
- 25. AISHWARYA SINHA ROLL NO-2044998 AISHWARYA SINHA ROLL NO-2044998 Questionnaire
- 26. AISHWARYA SINHA ROLL NO-2044998 AISHWARYA SINHA ROLL NO-2044998
- 27. AISHWARYA SINHA ROLL NO-2044998 AISHWARYA SINHA ROLL NO-2044998 Link of questionnaire: https://docs.google.com/forms/d/e/1FAIpQLSdxQpzs3eLWM oNnVGg2akLYAdUmDg_tFmOGsOxx5EaaVFt6BA/viewform?v c=0&c=0&w=1&flr=0