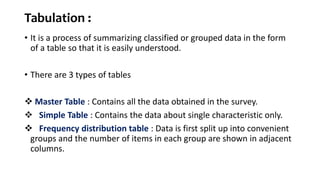
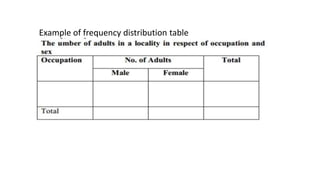
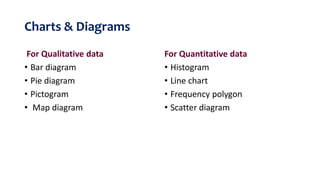
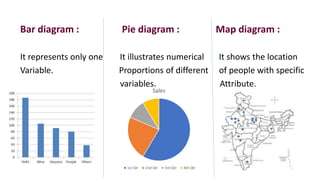
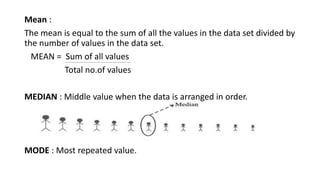
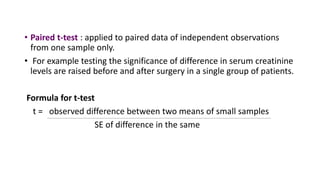
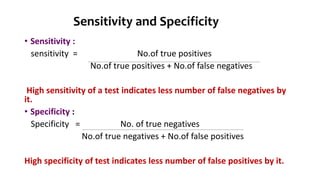
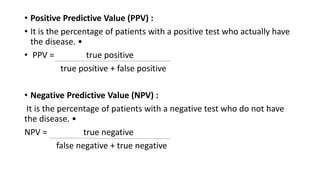
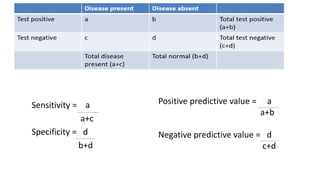
STATISTICS
Dr . M.ANUSWARU
Post Graduate
Statistics is concerned with scientific methods for
 Collecting the data.
 Organising the data.
 Summarizing the data.
 Presenting and analysing data.
 Deriving valid conclusions and making reasonable decisions on the basis
of this analysis.
 Definition :
Statistics is defined as collection, presentation ,
analysis and interpretation of numerical data.
What is data ?????
• Data is pieces of information.
• Collective recording of observations is data.
• Data can be mainly of two types
1. Quantitative
2. Qualitative
Quantitative ( Measurable ) : Can be measured by scales.
Ex: Height , Weight etc.,
Qualitative ( Not Measurable ) : Cannot be measured by scales.
Ex: Gender , Religion etc.,
Presentation Of Data
• Data should be made concise and helpful for further analysis. This is
called Presentation of data.
• Presentation of data can be mainly done by
 Tabulations
 Charts & Diagrams
Tabulation :
• It is a process of summarizing classified or grouped data in the form
of a table so that it is easily understood.
• There are 3 types of tables
 Master Table : Contains all the data obtained in the survey.
 Simple Table : Contains the data about single characteristic only.
 Frequency distribution table : Data is first split up into convenient
groups and the number of items in each group are shown in adjacent
columns.
Example of frequency distribution table
Charts & Diagrams
For Qualitative data
• Bar diagram
• Pie diagram
• Pictogram
• Map diagram
For Quantitative data
• Histogram
• Line chart
• Frequency polygon
• Scatter diagram
Bar diagram : Pie diagram : Map diagram :
It represents only one It illustrates numerical It shows the location
Variable. Proportions of different of people with specific
variables. Attribute.
Sales
1st Qtr 2nd Qtr 3rd Qtr 4th Qtr
Histogram : Line Graph : Frequency Polygon :
Depicts the frequencies of Useful in depicting give a clear picture of
observations occurring in trends over time. distribution of data.
certain ranges of values.
Measures of Central Tendency
• We may get a large number of observations , to obtain a
representative value and to make it more concise we need measures
of central tendency.
• Important measures of central tendencies are
 MEAN
 MEDIAN
 MODE
Mean :
The mean is equal to the sum of all the values in the data set divided by
the number of values in the data set.
MEAN = Sum of all values
Total no.of values
MEDIAN : Middle value when the data is arranged in order.
MODE : Most repeated value.
• For example serum creatinine values of 7 patients are as follows
1mg/dl, 2mg/dl,1.4mg/dl,1mg/dl, 1.3mg/dl, 1.6mg/dl, 1.7mg/dl.
MEAN = 1+1+1.3+1.4+1.6+1.7+2 = 10 = 1.42 mg/dl
7 7
MEDIAN : values to be arranged in order.i.e, 1,1,1.3,1.4,1.6,1.7,2
so the middle value 1.4 mg/dl is median.
MODE : most repeated value is 1 mg/dl .
so mode is 1 mg/dl.
Measures of variability
• A measure of variability is a summary statistic that represents the
amount of dispersion in a dataset.
• While a measure of central tendency describes the typical value,
measures of variability define how far away the data points tend to
fall from the center.
Two measures of variability are
 Standard deviation
 Range
RANGE
It is the difference between the lowest and highest values.
Example: In {4, 6, 9, 3, 7} the lowest value is 3, and the highest is 9.
So the range is 9 − 3 = 6.
Merit of Range : simplest
Demerit of Range : Indicates nothing about dispersion of values
between the two extreme values.
Standard deviation
• Standard deviation is a measure of the amount of variation or
dispersion of a set of values.
• A low standard deviation indicates that the values tend to be close to
the mean of the set, while a high standard deviation indicates that
the values are spread out over a wider range.
S.D =
N = the size of the population
= each value from the population
= the population mean
Normal distribution
• The commonest and most useful continuous distribution.
• It is a symmetrical probability distribution where most results are
located in middle and few are spread on both sides.
• It can be entirely described by its mean and standard deviation.
Characteristics of normal distribution curve :
• Bell shaped
• Total area under the curve = 100% or 1
• 50% of data lies on each side of midpoint.
Thus Median = Mean = Mode
• 68% of population lies within one standard deviation on both sides of
mean.
• 95% of population lies within two standard deviation on both sides of
mean.
• 99.7% of population lies within three standard deviation on both
sides of mean.
coefficient of variation
• The coefficient of variation (CV) is the ratio of the standard deviation
to the mean.
• The higher the coefficient of variation, the greater the level of
dispersion around the mean.
• It is generally expressed as a percentage.
• The lower the value of the coefficient of variation, the more precise
the estimate.
Data Analysis
• TYPES OF STATISTICAL TESTS
Parametric Tests :
Based on assumption that population from where the sample is drawn is
normally distributed.
Used to test parameters like mean, standard deviation, proportions etc.
• T-test
• Z -test
• ANOVA
• Pearson’s correlation
Non parametric Tests :
Used mostly for small sample size which violates normality.
• Chi square test
• Spearman’s correlation
• Significance of difference between means of two samples can be
judged using: –
Z test (>30)
T test (<30)
• Difficulty arises while measuring difference between means of more
than 2 samples .ANOVA is used in such cases.
• ANOVA is used to test the significance of the difference between
more than two sample means and to make inferences about whether
our samples are drawn from population having same means.
Z test :
• The z- test has 2 applications:
i. To test the significance of difference between a sample mean and a
known value of population mean.
Z = Mean – Population mean
S.E. of sample mean
ii. To test the significance of difference between 2 sample means or
between experiment sample mean and a control sample mean.
Z = Observed difference between 2 sample means
SE of difference between 2 sample means
t-test :
• Unpaired t-test : applied on unpaired data of independent
observations made on individuals of two different or separate groups
or samples drawn from two populations.
For example
Group 1 – 30 to 40yrs aged men who does one hour physical exercise
daily.
Group 2 - 30 to 40yrs aged men who has no physical exercise daily.
• Testing the significance of difference in blood sugar levels between
these two groups.
• Paired t-test : applied to paired data of independent observations
from one sample only.
• For example testing the significance of difference in serum creatinine
levels are raised before and after surgery in a single group of patients.
Formula for t-test
t = observed difference between two means of small samples
SE of difference in the same
Chi square test :
• It compare the values of two binomial samples even if <30.
Ex: Incidence of diabetes in 20 obese and 20 non obese.
• It also compares the frequencies of two multinomial samples
ex: no of diabetics and non diabetics in groups weighing 40-50, 50-60
and >60 kg
• It measures the probability of association between two discrete
attributes. It has an added advantage that it can be applied to find
association or relationship between two discrete attributes when
there are more than two classes or groups.
Ex:- Trial of 2 whooping cough vaccines results
Sensitivity and Specificity
• Sensitivity :
sensitivity = No.of true positives
No.of true positives + No.of false negatives
High sensitivity of a test indicates less number of false negatives by
it.
• Specificity :
Specificity = No. of true negatives
No.of true negatives + No.of false positives
High specificity of test indicates less number of false positives by it.
• Positive Predictive Value (PPV) :
• It is the percentage of patients with a positive test who actually have
the disease. •
• PPV = true positive
true positive + false positive
• Negative Predictive Value (NPV) :
It is the percentage of patients with a negative test who do not have
the disease. •
NPV = true negative
false negative + true negative
Sensitivity = a
a+c
Specificity = d
b+d
Positive predictive value = a
a+b
Negative predictive value = d
c+d
THANK YOU

Statistics for Medical students

  • 1.
  • 2.
    Statistics is concernedwith scientific methods for  Collecting the data.  Organising the data.  Summarizing the data.  Presenting and analysing data.  Deriving valid conclusions and making reasonable decisions on the basis of this analysis.  Definition : Statistics is defined as collection, presentation , analysis and interpretation of numerical data.
  • 3.
    What is data????? • Data is pieces of information. • Collective recording of observations is data. • Data can be mainly of two types 1. Quantitative 2. Qualitative Quantitative ( Measurable ) : Can be measured by scales. Ex: Height , Weight etc., Qualitative ( Not Measurable ) : Cannot be measured by scales. Ex: Gender , Religion etc.,
  • 4.
    Presentation Of Data •Data should be made concise and helpful for further analysis. This is called Presentation of data. • Presentation of data can be mainly done by  Tabulations  Charts & Diagrams
  • 5.
    Tabulation : • Itis a process of summarizing classified or grouped data in the form of a table so that it is easily understood. • There are 3 types of tables  Master Table : Contains all the data obtained in the survey.  Simple Table : Contains the data about single characteristic only.  Frequency distribution table : Data is first split up into convenient groups and the number of items in each group are shown in adjacent columns.
  • 6.
    Example of frequencydistribution table
  • 7.
    Charts & Diagrams ForQualitative data • Bar diagram • Pie diagram • Pictogram • Map diagram For Quantitative data • Histogram • Line chart • Frequency polygon • Scatter diagram
  • 8.
    Bar diagram :Pie diagram : Map diagram : It represents only one It illustrates numerical It shows the location Variable. Proportions of different of people with specific variables. Attribute. Sales 1st Qtr 2nd Qtr 3rd Qtr 4th Qtr
  • 9.
    Histogram : LineGraph : Frequency Polygon : Depicts the frequencies of Useful in depicting give a clear picture of observations occurring in trends over time. distribution of data. certain ranges of values.
  • 10.
    Measures of CentralTendency • We may get a large number of observations , to obtain a representative value and to make it more concise we need measures of central tendency. • Important measures of central tendencies are  MEAN  MEDIAN  MODE
  • 11.
    Mean : The meanis equal to the sum of all the values in the data set divided by the number of values in the data set. MEAN = Sum of all values Total no.of values MEDIAN : Middle value when the data is arranged in order. MODE : Most repeated value.
  • 12.
    • For exampleserum creatinine values of 7 patients are as follows 1mg/dl, 2mg/dl,1.4mg/dl,1mg/dl, 1.3mg/dl, 1.6mg/dl, 1.7mg/dl. MEAN = 1+1+1.3+1.4+1.6+1.7+2 = 10 = 1.42 mg/dl 7 7 MEDIAN : values to be arranged in order.i.e, 1,1,1.3,1.4,1.6,1.7,2 so the middle value 1.4 mg/dl is median. MODE : most repeated value is 1 mg/dl . so mode is 1 mg/dl.
  • 13.
    Measures of variability •A measure of variability is a summary statistic that represents the amount of dispersion in a dataset. • While a measure of central tendency describes the typical value, measures of variability define how far away the data points tend to fall from the center. Two measures of variability are  Standard deviation  Range
  • 14.
    RANGE It is thedifference between the lowest and highest values. Example: In {4, 6, 9, 3, 7} the lowest value is 3, and the highest is 9. So the range is 9 − 3 = 6. Merit of Range : simplest Demerit of Range : Indicates nothing about dispersion of values between the two extreme values.
  • 15.
    Standard deviation • Standarddeviation is a measure of the amount of variation or dispersion of a set of values. • A low standard deviation indicates that the values tend to be close to the mean of the set, while a high standard deviation indicates that the values are spread out over a wider range. S.D = N = the size of the population = each value from the population = the population mean
  • 16.
    Normal distribution • Thecommonest and most useful continuous distribution. • It is a symmetrical probability distribution where most results are located in middle and few are spread on both sides. • It can be entirely described by its mean and standard deviation.
  • 17.
    Characteristics of normaldistribution curve : • Bell shaped • Total area under the curve = 100% or 1 • 50% of data lies on each side of midpoint. Thus Median = Mean = Mode
  • 18.
    • 68% ofpopulation lies within one standard deviation on both sides of mean. • 95% of population lies within two standard deviation on both sides of mean. • 99.7% of population lies within three standard deviation on both sides of mean.
  • 19.
    coefficient of variation •The coefficient of variation (CV) is the ratio of the standard deviation to the mean. • The higher the coefficient of variation, the greater the level of dispersion around the mean. • It is generally expressed as a percentage. • The lower the value of the coefficient of variation, the more precise the estimate.
  • 20.
    Data Analysis • TYPESOF STATISTICAL TESTS Parametric Tests : Based on assumption that population from where the sample is drawn is normally distributed. Used to test parameters like mean, standard deviation, proportions etc. • T-test • Z -test • ANOVA • Pearson’s correlation Non parametric Tests : Used mostly for small sample size which violates normality. • Chi square test • Spearman’s correlation
  • 21.
    • Significance ofdifference between means of two samples can be judged using: – Z test (>30) T test (<30) • Difficulty arises while measuring difference between means of more than 2 samples .ANOVA is used in such cases. • ANOVA is used to test the significance of the difference between more than two sample means and to make inferences about whether our samples are drawn from population having same means.
  • 22.
    Z test : •The z- test has 2 applications: i. To test the significance of difference between a sample mean and a known value of population mean. Z = Mean – Population mean S.E. of sample mean ii. To test the significance of difference between 2 sample means or between experiment sample mean and a control sample mean. Z = Observed difference between 2 sample means SE of difference between 2 sample means
  • 23.
    t-test : • Unpairedt-test : applied on unpaired data of independent observations made on individuals of two different or separate groups or samples drawn from two populations. For example Group 1 – 30 to 40yrs aged men who does one hour physical exercise daily. Group 2 - 30 to 40yrs aged men who has no physical exercise daily. • Testing the significance of difference in blood sugar levels between these two groups.
  • 24.
    • Paired t-test: applied to paired data of independent observations from one sample only. • For example testing the significance of difference in serum creatinine levels are raised before and after surgery in a single group of patients. Formula for t-test t = observed difference between two means of small samples SE of difference in the same
  • 25.
    Chi square test: • It compare the values of two binomial samples even if <30. Ex: Incidence of diabetes in 20 obese and 20 non obese. • It also compares the frequencies of two multinomial samples ex: no of diabetics and non diabetics in groups weighing 40-50, 50-60 and >60 kg • It measures the probability of association between two discrete attributes. It has an added advantage that it can be applied to find association or relationship between two discrete attributes when there are more than two classes or groups. Ex:- Trial of 2 whooping cough vaccines results
  • 26.
    Sensitivity and Specificity •Sensitivity : sensitivity = No.of true positives No.of true positives + No.of false negatives High sensitivity of a test indicates less number of false negatives by it. • Specificity : Specificity = No. of true negatives No.of true negatives + No.of false positives High specificity of test indicates less number of false positives by it.
  • 27.
    • Positive PredictiveValue (PPV) : • It is the percentage of patients with a positive test who actually have the disease. • • PPV = true positive true positive + false positive • Negative Predictive Value (NPV) : It is the percentage of patients with a negative test who do not have the disease. • NPV = true negative false negative + true negative
  • 28.
    Sensitivity = a a+c Specificity= d b+d Positive predictive value = a a+b Negative predictive value = d c+d
  • 29.