Download as PDF, PPTX


![Customer Support Logs
• Search for Deaf and HOH customer requests:
[ LEVEL:SENTENCE TYPE:KEYWORD {deaf,
hearing}]
[ LEVEL:SENTENCE TYPE:AND_KEYWORD
{capability, impaired, challenged, hard}]
• “Accessibility” topic within Salesforce for reports
• Microsoft: Dedicated Support Channel](https://image.slidesharecdn.com/accessibilitymetrics-170301162645/85/Accessibility-metrics-Accessibility-Data-Metrics-and-Reporting-Industry-Best-Practices-34-320.jpg)

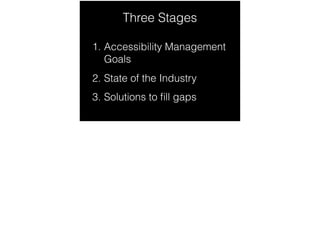
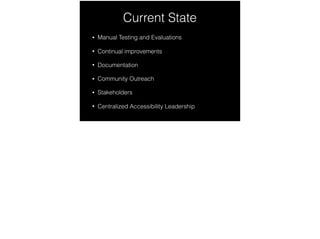
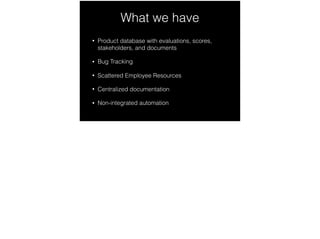
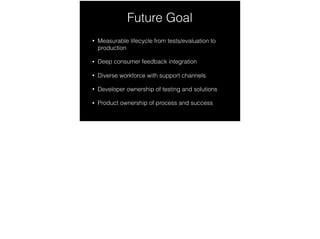
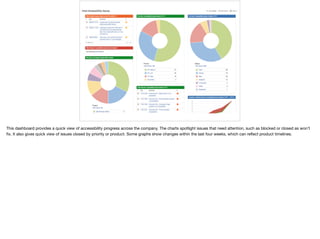
The document outlines the current state of accessibility management, highlighting three stages: setting goals, evaluating the industry, and finding solutions. It emphasizes the need for improved data visualization, integrated resources, and developer accountability in testing, alongside various metrics for measuring product accessibility and compliance. The future goal is to create a measurable lifecycle for accessibility to enhance consumer feedback and workforce diversity.


