SlideShare a Scribd company logo
1 of 6
Download to read offline
Quality Management
- A control chart monitors variation in a characteristic of a product or service
overtime.
- Information gained from analyzing a control chart forms the basis for process
improvement.
- A principal benefit of a control chart is the attempt to separate special causes
of variation from common causes of variation.
Causes of variation
Special Common
- Represent large fluctuations or
patterns in the data that are not
part of a process.
- They represent problems that can
be corrected without the change
of the system.
- Also, they are called assignable
causes of variations.
- Inherent variability that exits in a
process.
- They represent small causes of
variability that operate randomly,
and can be reduced by changing
the system.
- Also, they are called chance
causes of variations.
- Note: The systematic changes are the responsibility of the management (i.e.
not the workers involved in the process).
- Control charts help to prevent 2 types of errors
Type of error Details
First - Treating common cause
variation as a special cause.
- Results in over adjusting the
process (i.e. tampering).
- Tampering increases the
variation of the process.
Second - Treating special causes
variation as common cause
variation.
- Results in not taking immediate
corrective action as necessary
- To construct a control chart, you collect samples from the output of a process
overtime (i.e. subgroups).
- For each subgroup, you calculate the value of a statistic associated with a CTQ
variable (i.e. critical_ to_ quality variable).
- Common used statistics include sample proportion for categorical variables,
and the mean & range of a numerical variable.
- Plot the values over time and add control limits to the chart where
Upper control limit(UCL)=Process mean+3 * standard deviation
Lower control limit(LCL) =Process mean –3*standard deviation
- You evaluate the control chart by trying to find
i- Any pattern that might exist in the values over time.
ii- Whether any points fall outside the control limits.
PanelA
- Process
stable.
- Contains
common
causes only.
PanelB
- Special
causes exist
PanelC
- Consecutive
points above
the mean
line
- Consecutive
points below
the mean
line
- Two other simple rules allow you to detect a shift in the mean (i.e. trend
detection)
i- Eight or more consecutive points that lie above/below the
center line.
ii- Eight or more consecutive points that move upward/downward
in value.
- A process whose control chart indicates an out_of_control condition (i.e. a
point outside the limits and/or exhibit a trend) is said to be out of control.
- An out of control process includes common and special causes of variation.
- A process whose control chart does not indicate any out_of_control condition
is said to be in control.
- An in control process contains only common causes of variation.
- When the process is an in_ control process, you must determine whether the
amount of common cause variation in the process is small enough to satisfy
the customers of the product or service.
- If common variations are
i- Small: use chart continuously to monitor the process and to
make sure it remains in control.
ii- Large: alter the process. These alterations are the responsibility
of the management.
Control chart for the proportion (p chart)
- Used for categorical variables.
- Used to monitor and analyze the proportion of nonconforming items in
repeated samples selected from a process.
𝑃̅ ± 3√
𝑃̅(1 − 𝑃̅)
𝑛̅
Where
- 𝑛̅ =
∑ 𝑛 𝑖
𝑘
1
𝑘
- 𝑃̅ =
∑ 𝑥𝑖
𝑘
1
∑ 𝑛 𝑖
𝑘
1
- 𝑥𝑖 =⋕ of nonconforming items in subgroup i.
- 𝑛𝑖 = size for subgroup i.
- 𝑘 =⋕ of subgroups selected.
- 𝑛̅ = mean subgroup size.
- 𝑃̅ =average proportion of nonconforming items.
Note: any negative value of LCL means that the LCL does not exist.
Control charts for the range and the mean
- For numerical variables such as money, weight, etc.
- Charts are used in pairs (I.e. range chart for dispersion or variability and mean
chart for the process mean).
- Range chart is examined first. If it indicated out of control then the
interpretation of mean chart is misleading.
R chart
- used when sample size ≤10 (i.e we consider the range of the sample/subgroup
data as a measure of dispersion). This is the most common case.
- If sample size>10, we consider the standard deviation of the sample/subgroup
data as a measure of dispersion.
- Control limits for the range
UCL =𝐷4 𝑅̅
LCL=𝐷3 𝑅̅
Where
𝑅̅ =
∑ 𝑅𝑖
𝑘
1
𝑘
k=⋕ of subgroups , and 𝐷3 & 𝐷4 are obtained from the given
table.
𝑥̅ chart
- Control limits for the 𝑥̅ chart
UCL= 𝑥̿ + 𝐴2 𝑅̅
LCL= 𝑥̿ - 𝐴2 𝑅̅
Where we get 𝐴2 from the given table, k=⋕ of subgroups, and 𝑥̿ =
𝛴 𝑖=1
𝑘
𝑥̅
𝑘
.
The C Chart
- Nonconformities are defects, faults, errors, or imperfections in a product or a
service.
- An area of an opportunity is an individual unit of a product or service, a unit
of time, unit of space, or unit of area.
- To monitor and analyze number of nonconformities in an area of opportunity,
use C chart.
- Examples of number of nonconformities in an area of opportunity may be as
follows:
a- The number of typographical errors on a printed page.
b- The number of hotel customers filing complaints in a given week.
- C chart process assumes Poission distribution.
Control limits for the C chart
𝐶̅±3√𝐶̅
UCL=𝐶̅+3√𝐶̅
LCL=𝐶̅-3√𝐶̅
𝐶̅=
∑ 𝑐 𝑖
𝑘
𝑖=1
𝑘
k= number of units sampled
ci= number of nonconformities in unit i
-
Process capability
- A customer who believes that a product or service has met or exceeded his or
her expectations will be satisfied. Hence, quality is defined by customers.
- Specification limits are technical requirements set by management in response
to customers' needs and expectations.
- The upper/lower specification limit (USL/LSL) is the largest/smallest value a
CTQ can have and still conform to customers expectations.
- Hence, the process capability is the ability of a process to consistently meet
specified customer driven requirements. This can be done by estimating the
percentage of products or services that are within specifications.
P(an outcome will be within specification) = P( LSL<x<USL)
=P(
𝐿𝑆𝐿−𝑥̿
𝑅̅
𝑑2
< Z <
𝑈𝑆𝐿−𝑥̿
𝑅̅
𝑑2
)
Where
𝑑2 is obtained from the given table, and
We assumed normal distribution for the x values.
Capability index
- 𝐶 𝑝=
𝑈𝑆𝐿−𝐿𝑆𝐿
6(
𝑅̅
𝑑2
)
- Larger 𝐶 𝑝 means better capability of the process.
- 𝐶 𝑝is a measure of process potential, and not the actual performance.
- To measure the capability of the process in terms of actual process
performance use CPL, CPU, and 𝐶 𝑝𝑘
Where
CPL=
𝑥̿− 𝐿𝑆𝐿
3(
𝑅̅
𝑑2
)
CPU==
𝑈𝑆𝐿−𝑥̿
3(
𝑅̅
𝑑2
)
𝐶 𝑝𝑘=min(CPL,CPU)
The last measures the actual process performance

More Related Content

What's hot

Statisticalqualitycontrol
StatisticalqualitycontrolStatisticalqualitycontrol
Statisticalqualitycontrol
ceutics1315
 
IE-002 Control Chart For Variables
IE-002 Control Chart For VariablesIE-002 Control Chart For Variables
IE-002 Control Chart For Variables
handbook
 
Chapter 20 Lecture Notes
Chapter 20 Lecture NotesChapter 20 Lecture Notes
Chapter 20 Lecture Notes
Matthew L Levy
 
Control charts for attributes
Control charts for attributesControl charts for attributes
Control charts for attributes
Buddy Krishna
 
Control Charts28 Modified
Control Charts28 ModifiedControl Charts28 Modified
Control Charts28 Modified
valiamoley
 

What's hot (20)

Statisticalqualitycontrol
StatisticalqualitycontrolStatisticalqualitycontrol
Statisticalqualitycontrol
 
IE-002 Control Chart For Variables
IE-002 Control Chart For VariablesIE-002 Control Chart For Variables
IE-002 Control Chart For Variables
 
Chapter 20 Lecture Notes
Chapter 20 Lecture NotesChapter 20 Lecture Notes
Chapter 20 Lecture Notes
 
Control Charts[1]
Control Charts[1]Control Charts[1]
Control Charts[1]
 
Control chart ppt
Control chart pptControl chart ppt
Control chart ppt
 
P Charts
P ChartsP Charts
P Charts
 
Attributes Control Charts
Attributes Control ChartsAttributes Control Charts
Attributes Control Charts
 
Control charts
Control chartsControl charts
Control charts
 
Control charts
Control chartsControl charts
Control charts
 
Control chart basics
Control chart basicsControl chart basics
Control chart basics
 
Control charts for attributes
Control charts for attributesControl charts for attributes
Control charts for attributes
 
X‾ and r charts
X‾ and r chartsX‾ and r charts
X‾ and r charts
 
Control Charts28 Modified
Control Charts28 ModifiedControl Charts28 Modified
Control Charts28 Modified
 
Statistical quality control presentation
Statistical quality control presentationStatistical quality control presentation
Statistical quality control presentation
 
X Bar R Charts
X Bar R ChartsX Bar R Charts
X Bar R Charts
 
A CASE STUDY OF QUALITY CONTROL CHARTS IN A MANUFACTURING INDUSTRY (Ijsetr vo...
A CASE STUDY OF QUALITY CONTROL CHARTS IN A MANUFACTURING INDUSTRY (Ijsetr vo...A CASE STUDY OF QUALITY CONTROL CHARTS IN A MANUFACTURING INDUSTRY (Ijsetr vo...
A CASE STUDY OF QUALITY CONTROL CHARTS IN A MANUFACTURING INDUSTRY (Ijsetr vo...
 
Control chart
Control chartControl chart
Control chart
 
Variable control chart
Variable control chartVariable control chart
Variable control chart
 
JF608: Quality Control - Unit 3
JF608: Quality Control - Unit 3JF608: Quality Control - Unit 3
JF608: Quality Control - Unit 3
 
Control chart for variables
Control chart for variablesControl chart for variables
Control chart for variables
 

Similar to Management quality management Lec 4

Statistical process control
Statistical process controlStatistical process control
Statistical process control
jsembiring
 
STATISTICAL QUALITY CONTROL2.pdf
STATISTICAL QUALITY CONTROL2.pdfSTATISTICAL QUALITY CONTROL2.pdf
STATISTICAL QUALITY CONTROL2.pdf
SNEHA AGRAWAL GUPTA
 
Spc lecture presentation (bonnie corrror)
Spc lecture presentation (bonnie corrror)Spc lecture presentation (bonnie corrror)
Spc lecture presentation (bonnie corrror)
Jitesh Gaurav
 

Similar to Management quality management Lec 4 (20)

STATISTICAL PROCESS CONTROL(PPT).pptx
STATISTICAL PROCESS CONTROL(PPT).pptxSTATISTICAL PROCESS CONTROL(PPT).pptx
STATISTICAL PROCESS CONTROL(PPT).pptx
 
100018718.ppt
100018718.ppt100018718.ppt
100018718.ppt
 
Statistical Process control
Statistical Process controlStatistical Process control
Statistical Process control
 
Final notes on s1 qc
Final notes on s1 qcFinal notes on s1 qc
Final notes on s1 qc
 
Final notes on s1 qc
Final notes on s1 qcFinal notes on s1 qc
Final notes on s1 qc
 
Methods and Philosophy of SPC
Methods and Philosophy of SPCMethods and Philosophy of SPC
Methods and Philosophy of SPC
 
Om presentation
Om presentationOm presentation
Om presentation
 
Statistical Process Control (SPC) - QMS.pptx
Statistical Process Control (SPC) - QMS.pptxStatistical Process Control (SPC) - QMS.pptx
Statistical Process Control (SPC) - QMS.pptx
 
Shewhart Charts for Variables
Shewhart Charts for VariablesShewhart Charts for Variables
Shewhart Charts for Variables
 
Statistical process control
Statistical process controlStatistical process control
Statistical process control
 
03&04 SPC NOTES.pptx
03&04 SPC NOTES.pptx03&04 SPC NOTES.pptx
03&04 SPC NOTES.pptx
 
STATISTICAL PHARMACEUTICAL QUALITY CONTROL
STATISTICAL  PHARMACEUTICAL QUALITY CONTROLSTATISTICAL  PHARMACEUTICAL QUALITY CONTROL
STATISTICAL PHARMACEUTICAL QUALITY CONTROL
 
STATISTICAL QUALITY CONTROL2.pdf
STATISTICAL QUALITY CONTROL2.pdfSTATISTICAL QUALITY CONTROL2.pdf
STATISTICAL QUALITY CONTROL2.pdf
 
Statistical Process Control
Statistical Process ControlStatistical Process Control
Statistical Process Control
 
Statistical Process Control Part 1
Statistical Process Control Part 1Statistical Process Control Part 1
Statistical Process Control Part 1
 
Spc
SpcSpc
Spc
 
Control Chart Basics.ppt
Control Chart Basics.pptControl Chart Basics.ppt
Control Chart Basics.ppt
 
Control Chart Basics.ppt
Control Chart Basics.pptControl Chart Basics.ppt
Control Chart Basics.ppt
 
Spc lecture presentation (bonnie corrror)
Spc lecture presentation (bonnie corrror)Spc lecture presentation (bonnie corrror)
Spc lecture presentation (bonnie corrror)
 
Quality and statistical process control ppt @ bec doms
Quality and statistical process control ppt @ bec domsQuality and statistical process control ppt @ bec doms
Quality and statistical process control ppt @ bec doms
 

More from cairo university

More from cairo university (20)

Tocci chapter 13 applications of programmable logic devices extended
Tocci chapter 13 applications of programmable logic devices extendedTocci chapter 13 applications of programmable logic devices extended
Tocci chapter 13 applications of programmable logic devices extended
 
Tocci chapter 12 memory devices
Tocci chapter 12 memory devicesTocci chapter 12 memory devices
Tocci chapter 12 memory devices
 
Tocci ch 9 msi logic circuits
Tocci ch 9 msi logic circuitsTocci ch 9 msi logic circuits
Tocci ch 9 msi logic circuits
 
Tocci ch 7 counters and registers modified x
Tocci ch 7 counters and registers modified xTocci ch 7 counters and registers modified x
Tocci ch 7 counters and registers modified x
 
Tocci ch 6 digital arithmetic operations and circuits
Tocci ch 6 digital arithmetic operations and circuitsTocci ch 6 digital arithmetic operations and circuits
Tocci ch 6 digital arithmetic operations and circuits
 
Tocci ch 3 5 boolean algebra, logic gates, combinational circuits, f fs, - re...
Tocci ch 3 5 boolean algebra, logic gates, combinational circuits, f fs, - re...Tocci ch 3 5 boolean algebra, logic gates, combinational circuits, f fs, - re...
Tocci ch 3 5 boolean algebra, logic gates, combinational circuits, f fs, - re...
 
A15 sedra ch 15 memory circuits
A15  sedra ch 15 memory circuitsA15  sedra ch 15 memory circuits
A15 sedra ch 15 memory circuits
 
A14 sedra ch 14 advanced mos and bipolar logic circuits
A14  sedra ch 14 advanced mos and bipolar logic circuitsA14  sedra ch 14 advanced mos and bipolar logic circuits
A14 sedra ch 14 advanced mos and bipolar logic circuits
 
A13 sedra ch 13 cmos digital logic circuits
A13  sedra ch 13 cmos digital logic circuitsA13  sedra ch 13 cmos digital logic circuits
A13 sedra ch 13 cmos digital logic circuits
 
A09 sedra ch 9 frequency response
A09  sedra ch 9 frequency responseA09  sedra ch 9 frequency response
A09 sedra ch 9 frequency response
 
5 sedra ch 05 mosfet.ppsx
5  sedra ch 05  mosfet.ppsx5  sedra ch 05  mosfet.ppsx
5 sedra ch 05 mosfet.ppsx
 
5 sedra ch 05 mosfet
5  sedra ch 05  mosfet5  sedra ch 05  mosfet
5 sedra ch 05 mosfet
 
5 sedra ch 05 mosfet revision
5  sedra ch 05  mosfet revision5  sedra ch 05  mosfet revision
5 sedra ch 05 mosfet revision
 
Fields Lec 2
Fields Lec 2Fields Lec 2
Fields Lec 2
 
Fields Lec 1
Fields Lec 1Fields Lec 1
Fields Lec 1
 
Fields Lec 5&amp;6
Fields Lec 5&amp;6Fields Lec 5&amp;6
Fields Lec 5&amp;6
 
Fields Lec 4
Fields Lec 4Fields Lec 4
Fields Lec 4
 
Fields Lec 3
Fields Lec 3Fields Lec 3
Fields Lec 3
 
Lecture 2 (system overview of c8051 f020) rv01
Lecture 2 (system overview of c8051 f020) rv01Lecture 2 (system overview of c8051 f020) rv01
Lecture 2 (system overview of c8051 f020) rv01
 
Lecture 1 (course overview and 8051 architecture) rv01
Lecture 1 (course overview and 8051 architecture) rv01Lecture 1 (course overview and 8051 architecture) rv01
Lecture 1 (course overview and 8051 architecture) rv01
 

Recently uploaded

Recently uploaded (12)

Internal Reconstruction Corporate accounting by bhumika Garg
Internal Reconstruction Corporate accounting by bhumika GargInternal Reconstruction Corporate accounting by bhumika Garg
Internal Reconstruction Corporate accounting by bhumika Garg
 
Information Technology Project Management, Revised 7th edition test bank.docx
Information Technology Project Management, Revised 7th edition test bank.docxInformation Technology Project Management, Revised 7th edition test bank.docx
Information Technology Project Management, Revised 7th edition test bank.docx
 
digital Human resource management presentation.pdf
digital Human resource management presentation.pdfdigital Human resource management presentation.pdf
digital Human resource management presentation.pdf
 
How Software Developers Destroy Business Value.pptx
How Software Developers Destroy Business Value.pptxHow Software Developers Destroy Business Value.pptx
How Software Developers Destroy Business Value.pptx
 
Group work -meaning and definitions- Characteristics and Importance
Group work -meaning and definitions- Characteristics and ImportanceGroup work -meaning and definitions- Characteristics and Importance
Group work -meaning and definitions- Characteristics and Importance
 
Marketing Management 16th edition by Philip Kotler test bank.docx
Marketing Management 16th edition by Philip Kotler test bank.docxMarketing Management 16th edition by Philip Kotler test bank.docx
Marketing Management 16th edition by Philip Kotler test bank.docx
 
W.H.Bender Quote 62 - Always strive to be a Hospitality Service professional
W.H.Bender Quote 62 - Always strive to be a Hospitality Service professionalW.H.Bender Quote 62 - Always strive to be a Hospitality Service professional
W.H.Bender Quote 62 - Always strive to be a Hospitality Service professional
 
Spring-2024-Priesthoods of Augustus Yale Historical Review
Spring-2024-Priesthoods of Augustus Yale Historical ReviewSpring-2024-Priesthoods of Augustus Yale Historical Review
Spring-2024-Priesthoods of Augustus Yale Historical Review
 
Persuasive and Communication is the art of negotiation.
Persuasive and Communication is the art of negotiation.Persuasive and Communication is the art of negotiation.
Persuasive and Communication is the art of negotiation.
 
thesis-and-viva-voce preparation for research scholars
thesis-and-viva-voce preparation for research scholarsthesis-and-viva-voce preparation for research scholars
thesis-and-viva-voce preparation for research scholars
 
Nurturing Tomorrow’s Leaders_ The Emerging Leaders Institute.pdf
Nurturing Tomorrow’s Leaders_ The Emerging Leaders Institute.pdfNurturing Tomorrow’s Leaders_ The Emerging Leaders Institute.pdf
Nurturing Tomorrow’s Leaders_ The Emerging Leaders Institute.pdf
 
W.H.Bender Quote 63 You Must Plan T.O.P Take-Out Packaging
W.H.Bender Quote 63 You Must Plan T.O.P Take-Out PackagingW.H.Bender Quote 63 You Must Plan T.O.P Take-Out Packaging
W.H.Bender Quote 63 You Must Plan T.O.P Take-Out Packaging
 

Management quality management Lec 4

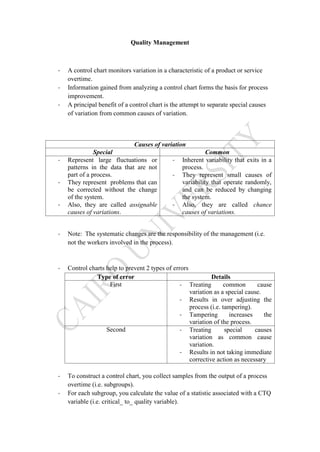
  • 1. Quality Management - A control chart monitors variation in a characteristic of a product or service overtime. - Information gained from analyzing a control chart forms the basis for process improvement. - A principal benefit of a control chart is the attempt to separate special causes of variation from common causes of variation. Causes of variation Special Common - Represent large fluctuations or patterns in the data that are not part of a process. - They represent problems that can be corrected without the change of the system. - Also, they are called assignable causes of variations. - Inherent variability that exits in a process. - They represent small causes of variability that operate randomly, and can be reduced by changing the system. - Also, they are called chance causes of variations. - Note: The systematic changes are the responsibility of the management (i.e. not the workers involved in the process). - Control charts help to prevent 2 types of errors Type of error Details First - Treating common cause variation as a special cause. - Results in over adjusting the process (i.e. tampering). - Tampering increases the variation of the process. Second - Treating special causes variation as common cause variation. - Results in not taking immediate corrective action as necessary - To construct a control chart, you collect samples from the output of a process overtime (i.e. subgroups). - For each subgroup, you calculate the value of a statistic associated with a CTQ variable (i.e. critical_ to_ quality variable).
  • 2. - Common used statistics include sample proportion for categorical variables, and the mean & range of a numerical variable. - Plot the values over time and add control limits to the chart where Upper control limit(UCL)=Process mean+3 * standard deviation Lower control limit(LCL) =Process mean –3*standard deviation - You evaluate the control chart by trying to find i- Any pattern that might exist in the values over time. ii- Whether any points fall outside the control limits. PanelA - Process stable. - Contains common causes only. PanelB - Special causes exist PanelC - Consecutive points above the mean line - Consecutive points below the mean line - Two other simple rules allow you to detect a shift in the mean (i.e. trend detection) i- Eight or more consecutive points that lie above/below the center line. ii- Eight or more consecutive points that move upward/downward in value. - A process whose control chart indicates an out_of_control condition (i.e. a point outside the limits and/or exhibit a trend) is said to be out of control. - An out of control process includes common and special causes of variation. - A process whose control chart does not indicate any out_of_control condition is said to be in control. - An in control process contains only common causes of variation.
  • 3. - When the process is an in_ control process, you must determine whether the amount of common cause variation in the process is small enough to satisfy the customers of the product or service. - If common variations are i- Small: use chart continuously to monitor the process and to make sure it remains in control. ii- Large: alter the process. These alterations are the responsibility of the management. Control chart for the proportion (p chart) - Used for categorical variables. - Used to monitor and analyze the proportion of nonconforming items in repeated samples selected from a process. 𝑃̅ ± 3√ 𝑃̅(1 − 𝑃̅) 𝑛̅ Where - 𝑛̅ = ∑ 𝑛 𝑖 𝑘 1 𝑘 - 𝑃̅ = ∑ 𝑥𝑖 𝑘 1 ∑ 𝑛 𝑖 𝑘 1 - 𝑥𝑖 =⋕ of nonconforming items in subgroup i. - 𝑛𝑖 = size for subgroup i. - 𝑘 =⋕ of subgroups selected. - 𝑛̅ = mean subgroup size. - 𝑃̅ =average proportion of nonconforming items. Note: any negative value of LCL means that the LCL does not exist.
  • 4. Control charts for the range and the mean - For numerical variables such as money, weight, etc. - Charts are used in pairs (I.e. range chart for dispersion or variability and mean chart for the process mean). - Range chart is examined first. If it indicated out of control then the interpretation of mean chart is misleading. R chart - used when sample size ≤10 (i.e we consider the range of the sample/subgroup data as a measure of dispersion). This is the most common case. - If sample size>10, we consider the standard deviation of the sample/subgroup data as a measure of dispersion. - Control limits for the range UCL =𝐷4 𝑅̅ LCL=𝐷3 𝑅̅ Where 𝑅̅ = ∑ 𝑅𝑖 𝑘 1 𝑘 k=⋕ of subgroups , and 𝐷3 & 𝐷4 are obtained from the given table. 𝑥̅ chart - Control limits for the 𝑥̅ chart UCL= 𝑥̿ + 𝐴2 𝑅̅ LCL= 𝑥̿ - 𝐴2 𝑅̅ Where we get 𝐴2 from the given table, k=⋕ of subgroups, and 𝑥̿ = 𝛴 𝑖=1 𝑘 𝑥̅ 𝑘 .
  • 5. The C Chart - Nonconformities are defects, faults, errors, or imperfections in a product or a service. - An area of an opportunity is an individual unit of a product or service, a unit of time, unit of space, or unit of area. - To monitor and analyze number of nonconformities in an area of opportunity, use C chart. - Examples of number of nonconformities in an area of opportunity may be as follows: a- The number of typographical errors on a printed page. b- The number of hotel customers filing complaints in a given week. - C chart process assumes Poission distribution. Control limits for the C chart 𝐶̅±3√𝐶̅ UCL=𝐶̅+3√𝐶̅ LCL=𝐶̅-3√𝐶̅ 𝐶̅= ∑ 𝑐 𝑖 𝑘 𝑖=1 𝑘 k= number of units sampled ci= number of nonconformities in unit i -
  • 6. Process capability - A customer who believes that a product or service has met or exceeded his or her expectations will be satisfied. Hence, quality is defined by customers. - Specification limits are technical requirements set by management in response to customers' needs and expectations. - The upper/lower specification limit (USL/LSL) is the largest/smallest value a CTQ can have and still conform to customers expectations. - Hence, the process capability is the ability of a process to consistently meet specified customer driven requirements. This can be done by estimating the percentage of products or services that are within specifications. P(an outcome will be within specification) = P( LSL<x<USL) =P( 𝐿𝑆𝐿−𝑥̿ 𝑅̅ 𝑑2 < Z < 𝑈𝑆𝐿−𝑥̿ 𝑅̅ 𝑑2 ) Where 𝑑2 is obtained from the given table, and We assumed normal distribution for the x values. Capability index - 𝐶 𝑝= 𝑈𝑆𝐿−𝐿𝑆𝐿 6( 𝑅̅ 𝑑2 ) - Larger 𝐶 𝑝 means better capability of the process. - 𝐶 𝑝is a measure of process potential, and not the actual performance. - To measure the capability of the process in terms of actual process performance use CPL, CPU, and 𝐶 𝑝𝑘 Where CPL= 𝑥̿− 𝐿𝑆𝐿 3( 𝑅̅ 𝑑2 ) CPU== 𝑈𝑆𝐿−𝑥̿ 3( 𝑅̅ 𝑑2 ) 𝐶 𝑝𝑘=min(CPL,CPU) The last measures the actual process performance