Download as PDF, PPTX

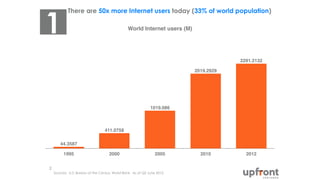


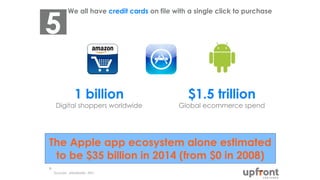
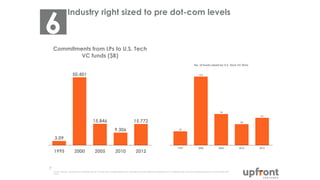
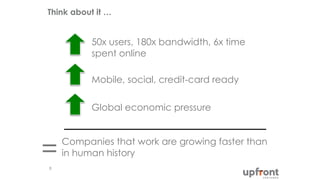
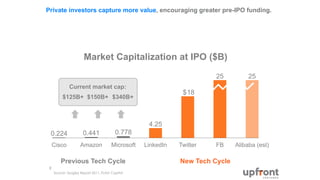
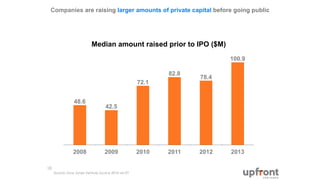
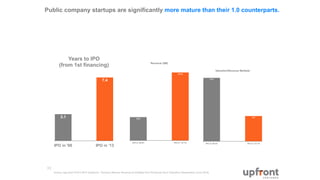
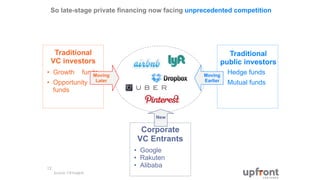
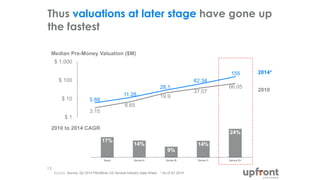

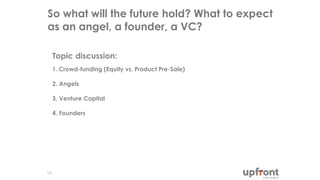


This document discusses trends in venture capital and startups. It notes that there are now 50 times more internet users, online speeds are over 180 times faster, and people are connected everywhere via mobile devices. As a result, companies are growing faster than ever before. Venture capital funds are larger before companies go public, and public startups are more mature with higher valuations and revenues. Late-stage private financing now faces competition from new types of investors. While some see signs of a bubble, the startup growth and value is unprecedented due to new entrants paying high prices. The future holds discussion around new models like crowd-funding and their impact on angels, VCs, and founders.


![[500DISTRO] The Scientific Method: How to Design & Track Viral Growth Experim...](https://cdn.slidesharecdn.com/ss_thumbnails/02brianbalfourhubspotfinal-140806211622-phpapp02-thumbnail.jpg?width=640&height=640&fit=bounds)
![[500DISTRO] The Only Metric That Matters](https://cdn.slidesharecdn.com/ss_thumbnails/01joshelmangreylockpartnersfinal-140807093957-phpapp02-thumbnail.jpg?width=640&height=640&fit=bounds)
![[WMD 2015] Greylock Partners >> Josh Elman, "Launching A Rocket Off Someone E...](https://cdn.slidesharecdn.com/ss_thumbnails/04joshelman-150430210548-conversion-gate01-thumbnail.jpg?width=640&height=640&fit=bounds)


![[PREMONEY MIAMI] AngelPad >> Thomas Korte, "How To : Select Companies"](https://cdn.slidesharecdn.com/ss_thumbnails/pre-money2015final1-150320092253-conversion-gate01-thumbnail.jpg?width=640&height=640&fit=bounds)
![[WMD 2015] Thumbtack >> Sander Daniels, "The Big Reveal: The Correlation Betw...](https://cdn.slidesharecdn.com/ss_thumbnails/09sanderdaniels-150430214726-conversion-gate02-thumbnail.jpg?width=640&height=640&fit=bounds)
![[PREMONEY MIAMI] Quotidian Ventures >> Pedro Torres-Picón, "How To : Build an...](https://cdn.slidesharecdn.com/ss_thumbnails/02pedrotorres-picon-150319181654-conversion-gate01-thumbnail.jpg?width=640&height=640&fit=bounds)
![[PREMONEY 2014] Ardent Capital >> Adrian Vanzyl, "The Global VC: Southeast Asia"](https://cdn.slidesharecdn.com/ss_thumbnails/01adrianvanzylardentcapitalfinal-140626184519-phpapp02-thumbnail.jpg?width=640&height=640&fit=bounds)
![[PreMoney MENA 2015] Connect Ventures >> Sitar Teli, "Why UX Is A Good Invest...](https://cdn.slidesharecdn.com/ss_thumbnails/06sitarteliconnectventurespre-money-whyuxisagoodinvestment-151206024404-lva1-app6892-thumbnail.jpg?width=640&height=640&fit=bounds)
![[PREMONEY MIAMI] Endeavor >> Allen Taylor , "The Global VC: How Emerging Mar...](https://cdn.slidesharecdn.com/ss_thumbnails/04allentaylor-150320071737-conversion-gate01-thumbnail.jpg?width=640&height=640&fit=bounds)
![[PREMONEY 2014] Bullpen Capital >> Paul Martino, "Seed Is The New A: What The...](https://cdn.slidesharecdn.com/ss_thumbnails/02paulmartinobullpen-final-140626185921-phpapp02-thumbnail.jpg?width=640&height=640&fit=bounds)
![[PreMoney SF 2016] Jason Calacanis > "Most Active Syndicate"](https://cdn.slidesharecdn.com/ss_thumbnails/06jasoncalacanis-mostactivesyndicate-160621203413-thumbnail.jpg?width=640&height=640&fit=bounds)
![[PreMoney SF 2016] Mike Maples Jr > Beyond Lean Startups](https://cdn.slidesharecdn.com/ss_thumbnails/05mikemaples-beyondleanstartups-160621144500-thumbnail.jpg?width=640&height=640&fit=bounds)
![[WMD 2015] MindValley Hispano >> Juan Martitegui, "Pay-Per-Click Checklist: 2...](https://cdn.slidesharecdn.com/ss_thumbnails/03juanmartitegui-150430213634-conversion-gate02-thumbnail.jpg?width=640&height=640&fit=bounds)
![[500DISTRO] Dissecting UX: Funnel Fixes & Other CRO Tips for Growth That Pays](https://cdn.slidesharecdn.com/ss_thumbnails/05neilpatelkiss-final-140806211641-phpapp01-thumbnail.jpg?width=640&height=640&fit=bounds)
![[WMD 2015] Segment >> Diana Smith, "Measuring For B2B Engagement: How To Coll...](https://cdn.slidesharecdn.com/ss_thumbnails/11dianasmithfinal21-150501123202-conversion-gate02-thumbnail.jpg?width=640&height=640&fit=bounds)
![[PreMoney SF 2015] Arena Ventures >> Paige Craig, " Calling All Angels (In Th...](https://cdn.slidesharecdn.com/ss_thumbnails/fogofdeals-150612021002-lva1-app6891-thumbnail.jpg?width=640&height=640&fit=bounds)
![[WDM 2015] Zenefits >> Matt Epstein "From $0 to $21M ARR: Our 5 Biggest Marke...](https://cdn.slidesharecdn.com/ss_thumbnails/03mattepstein-150430215044-conversion-gate02-thumbnail.jpg?width=640&height=640&fit=bounds)
![[PreMoney SF 2015] First Round >> Phin Barnes, "How to: Create Value Add, Not...](https://cdn.slidesharecdn.com/ss_thumbnails/pbarnesvalueaddpremoney2015copy-150612024856-lva1-app6891-thumbnail.jpg?width=640&height=640&fit=bounds)


