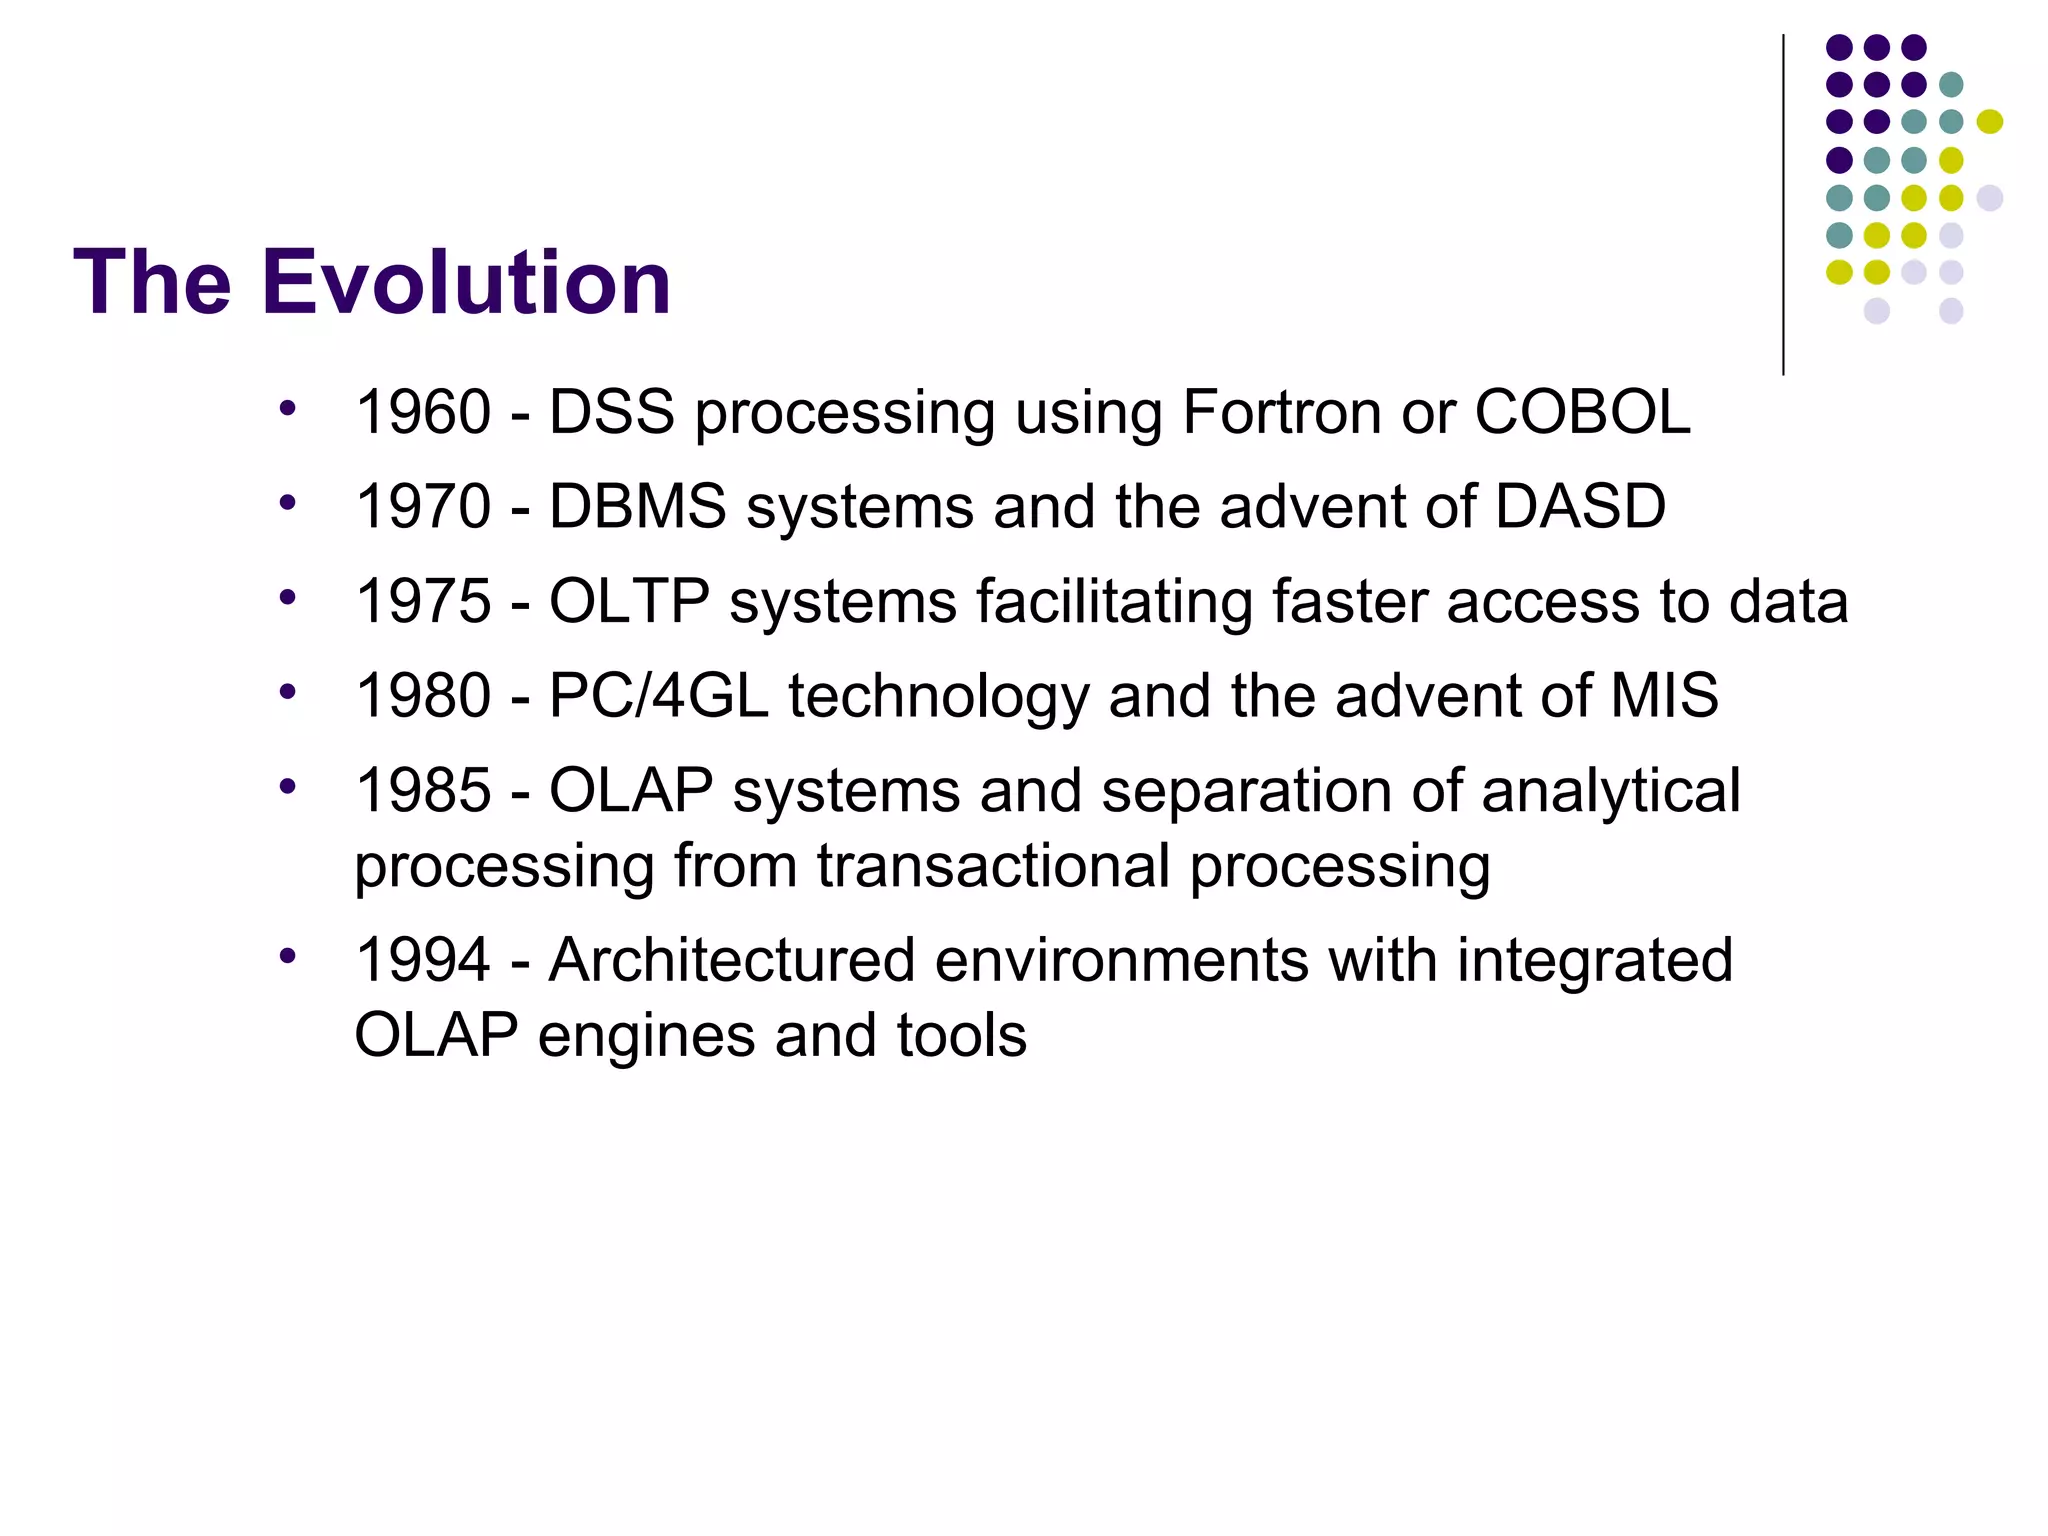
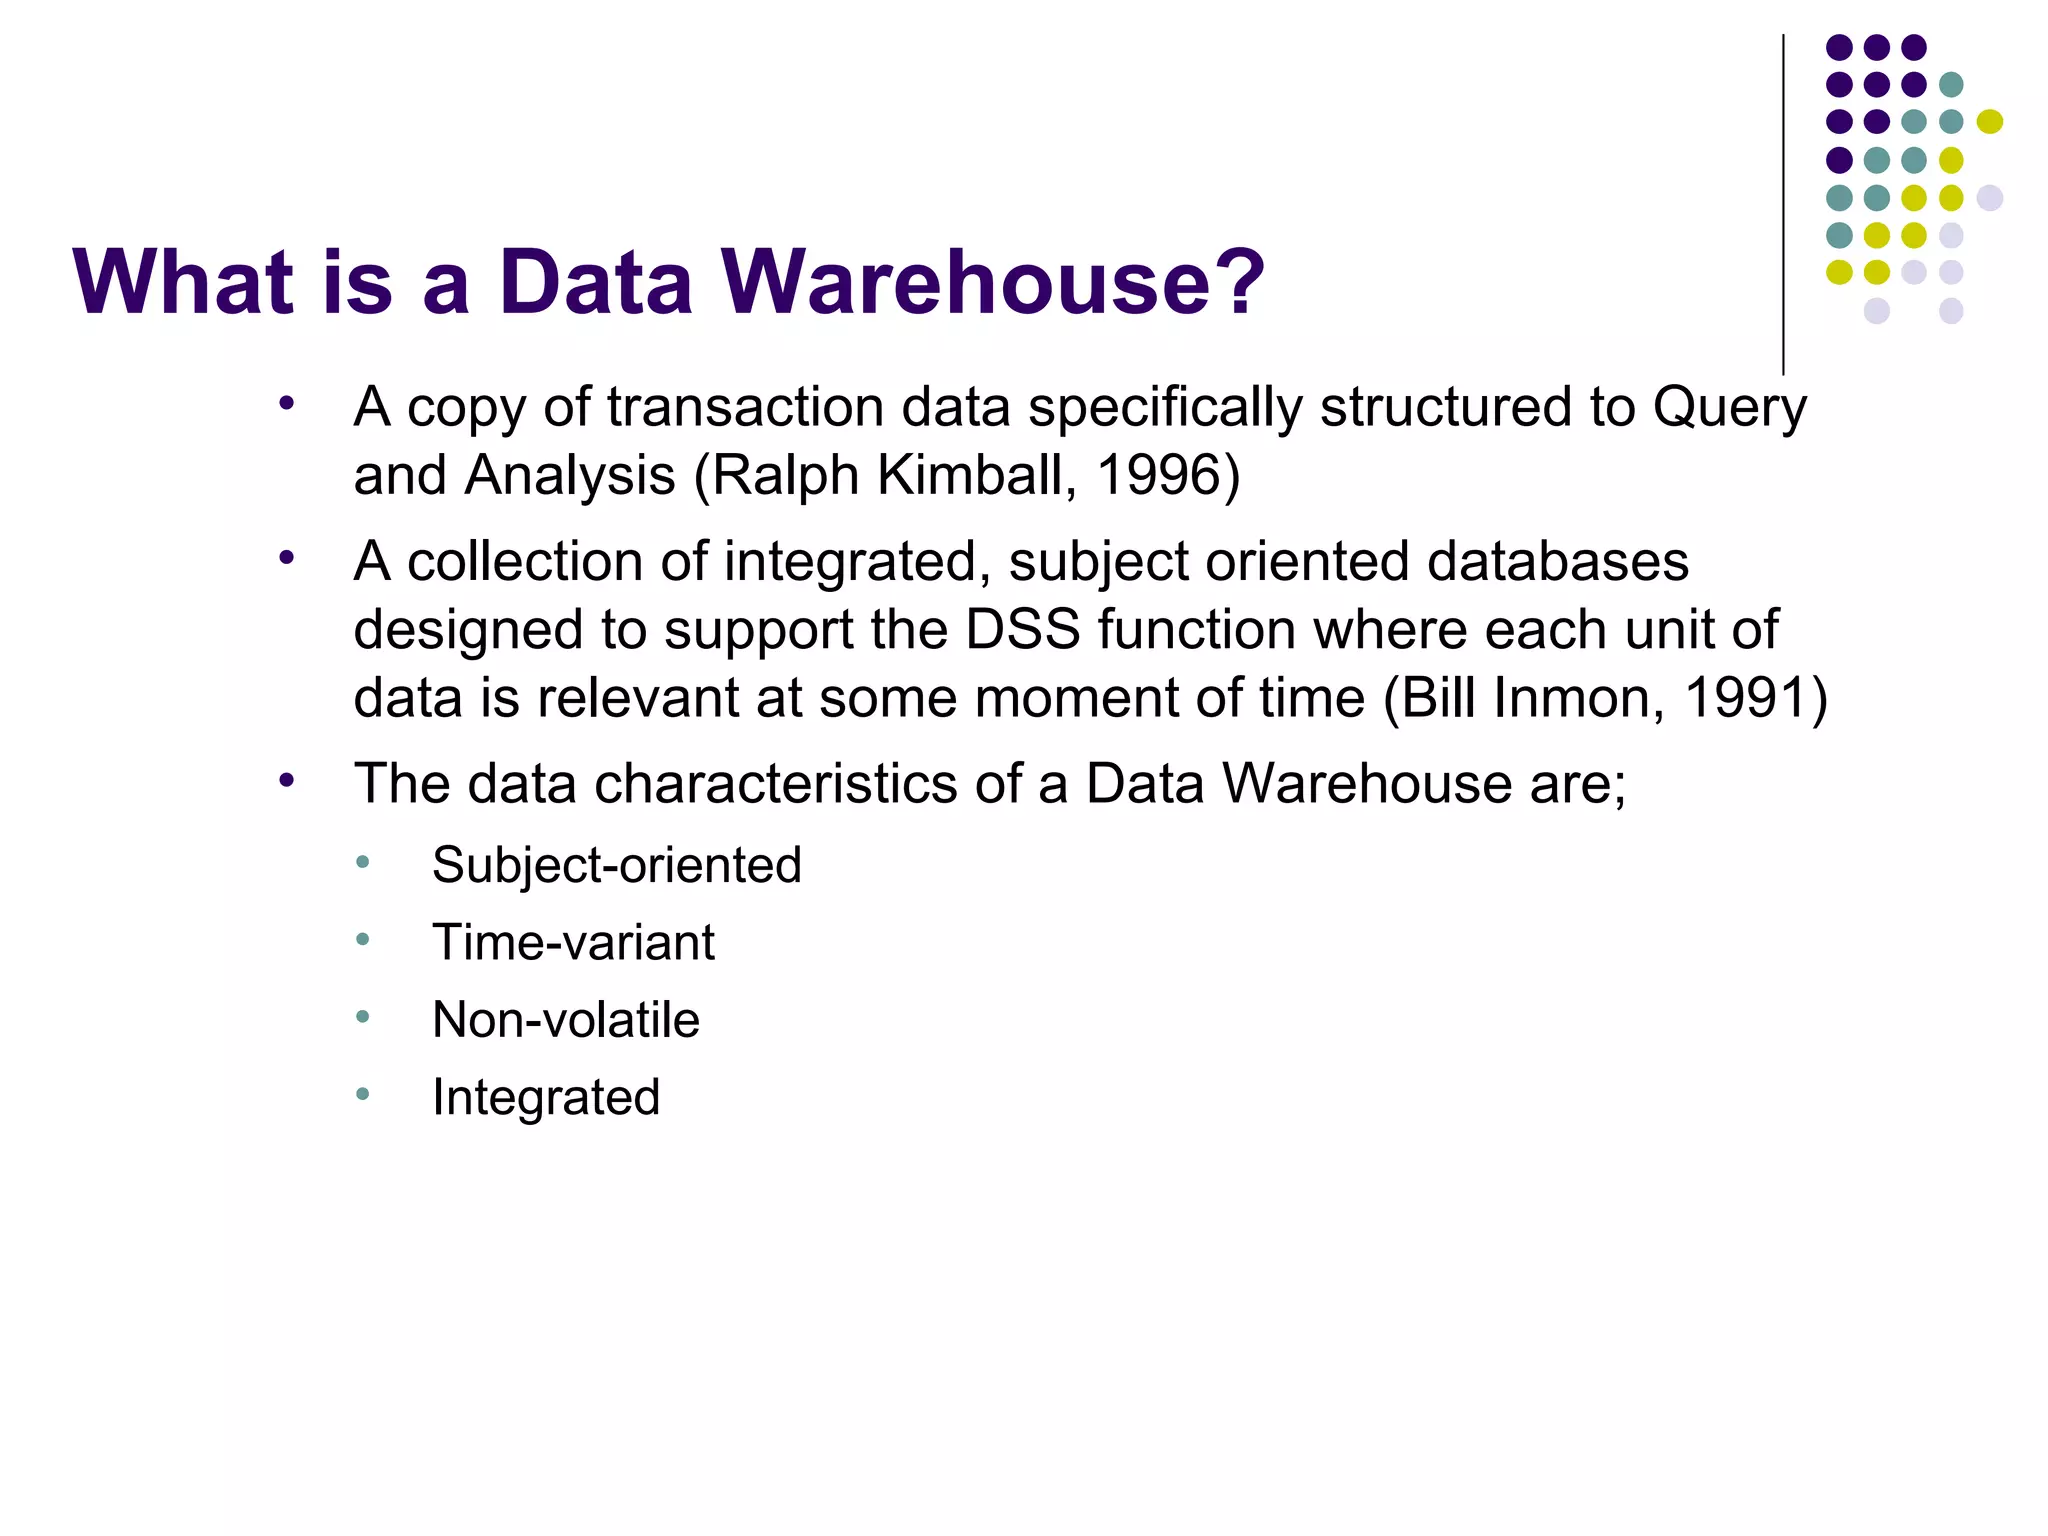
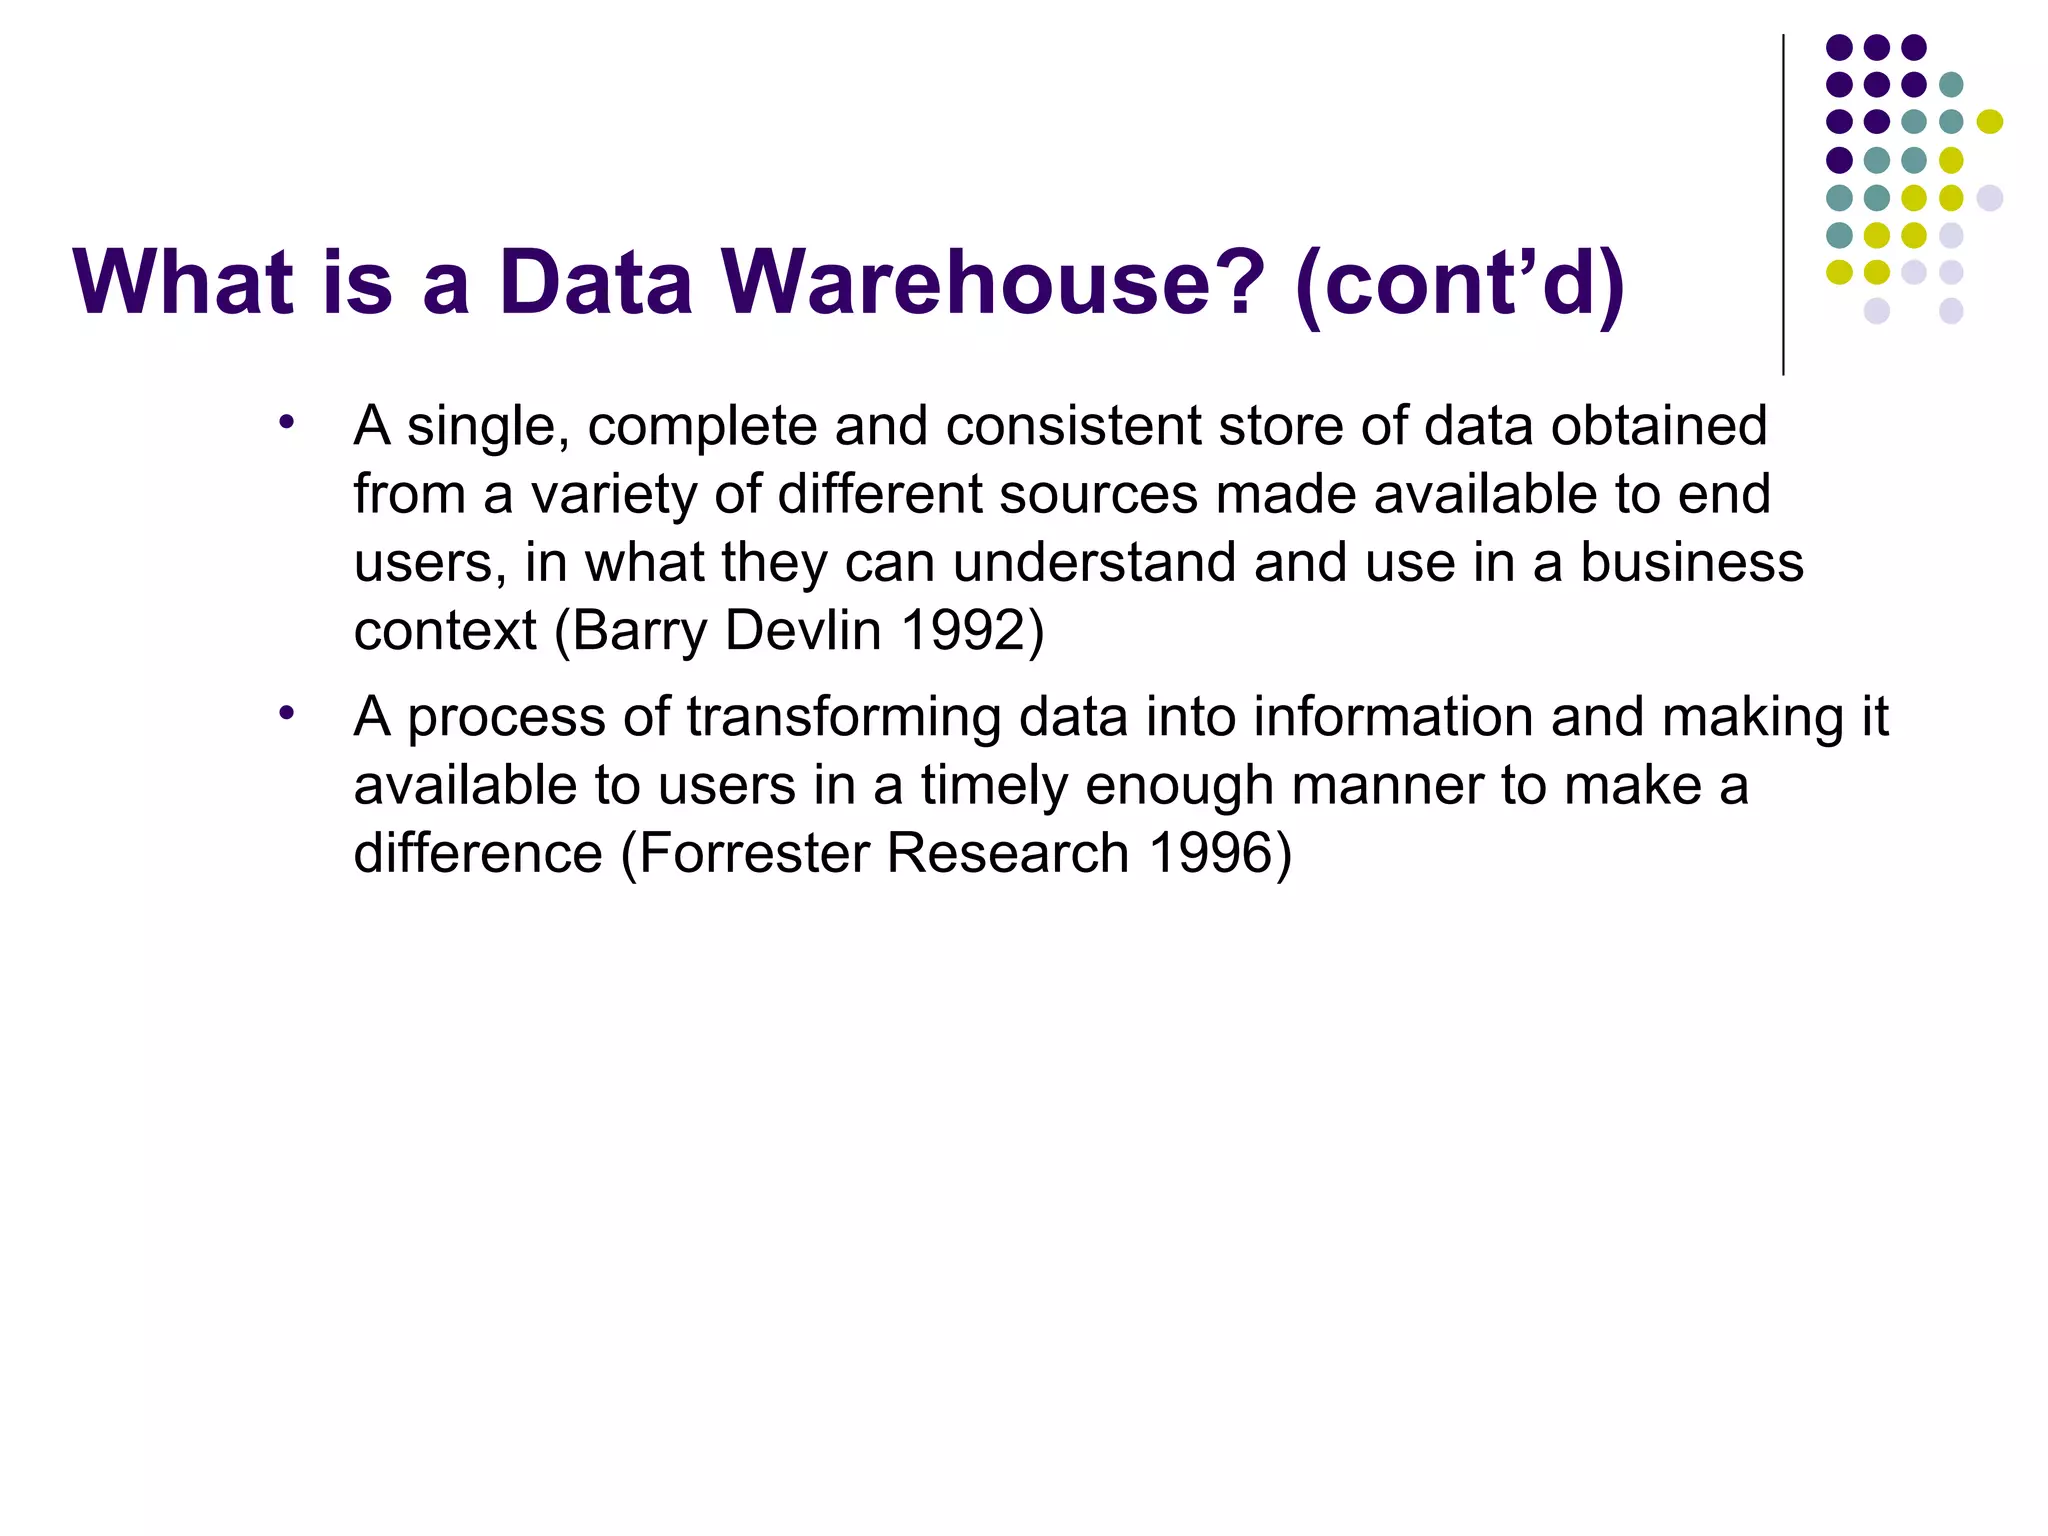
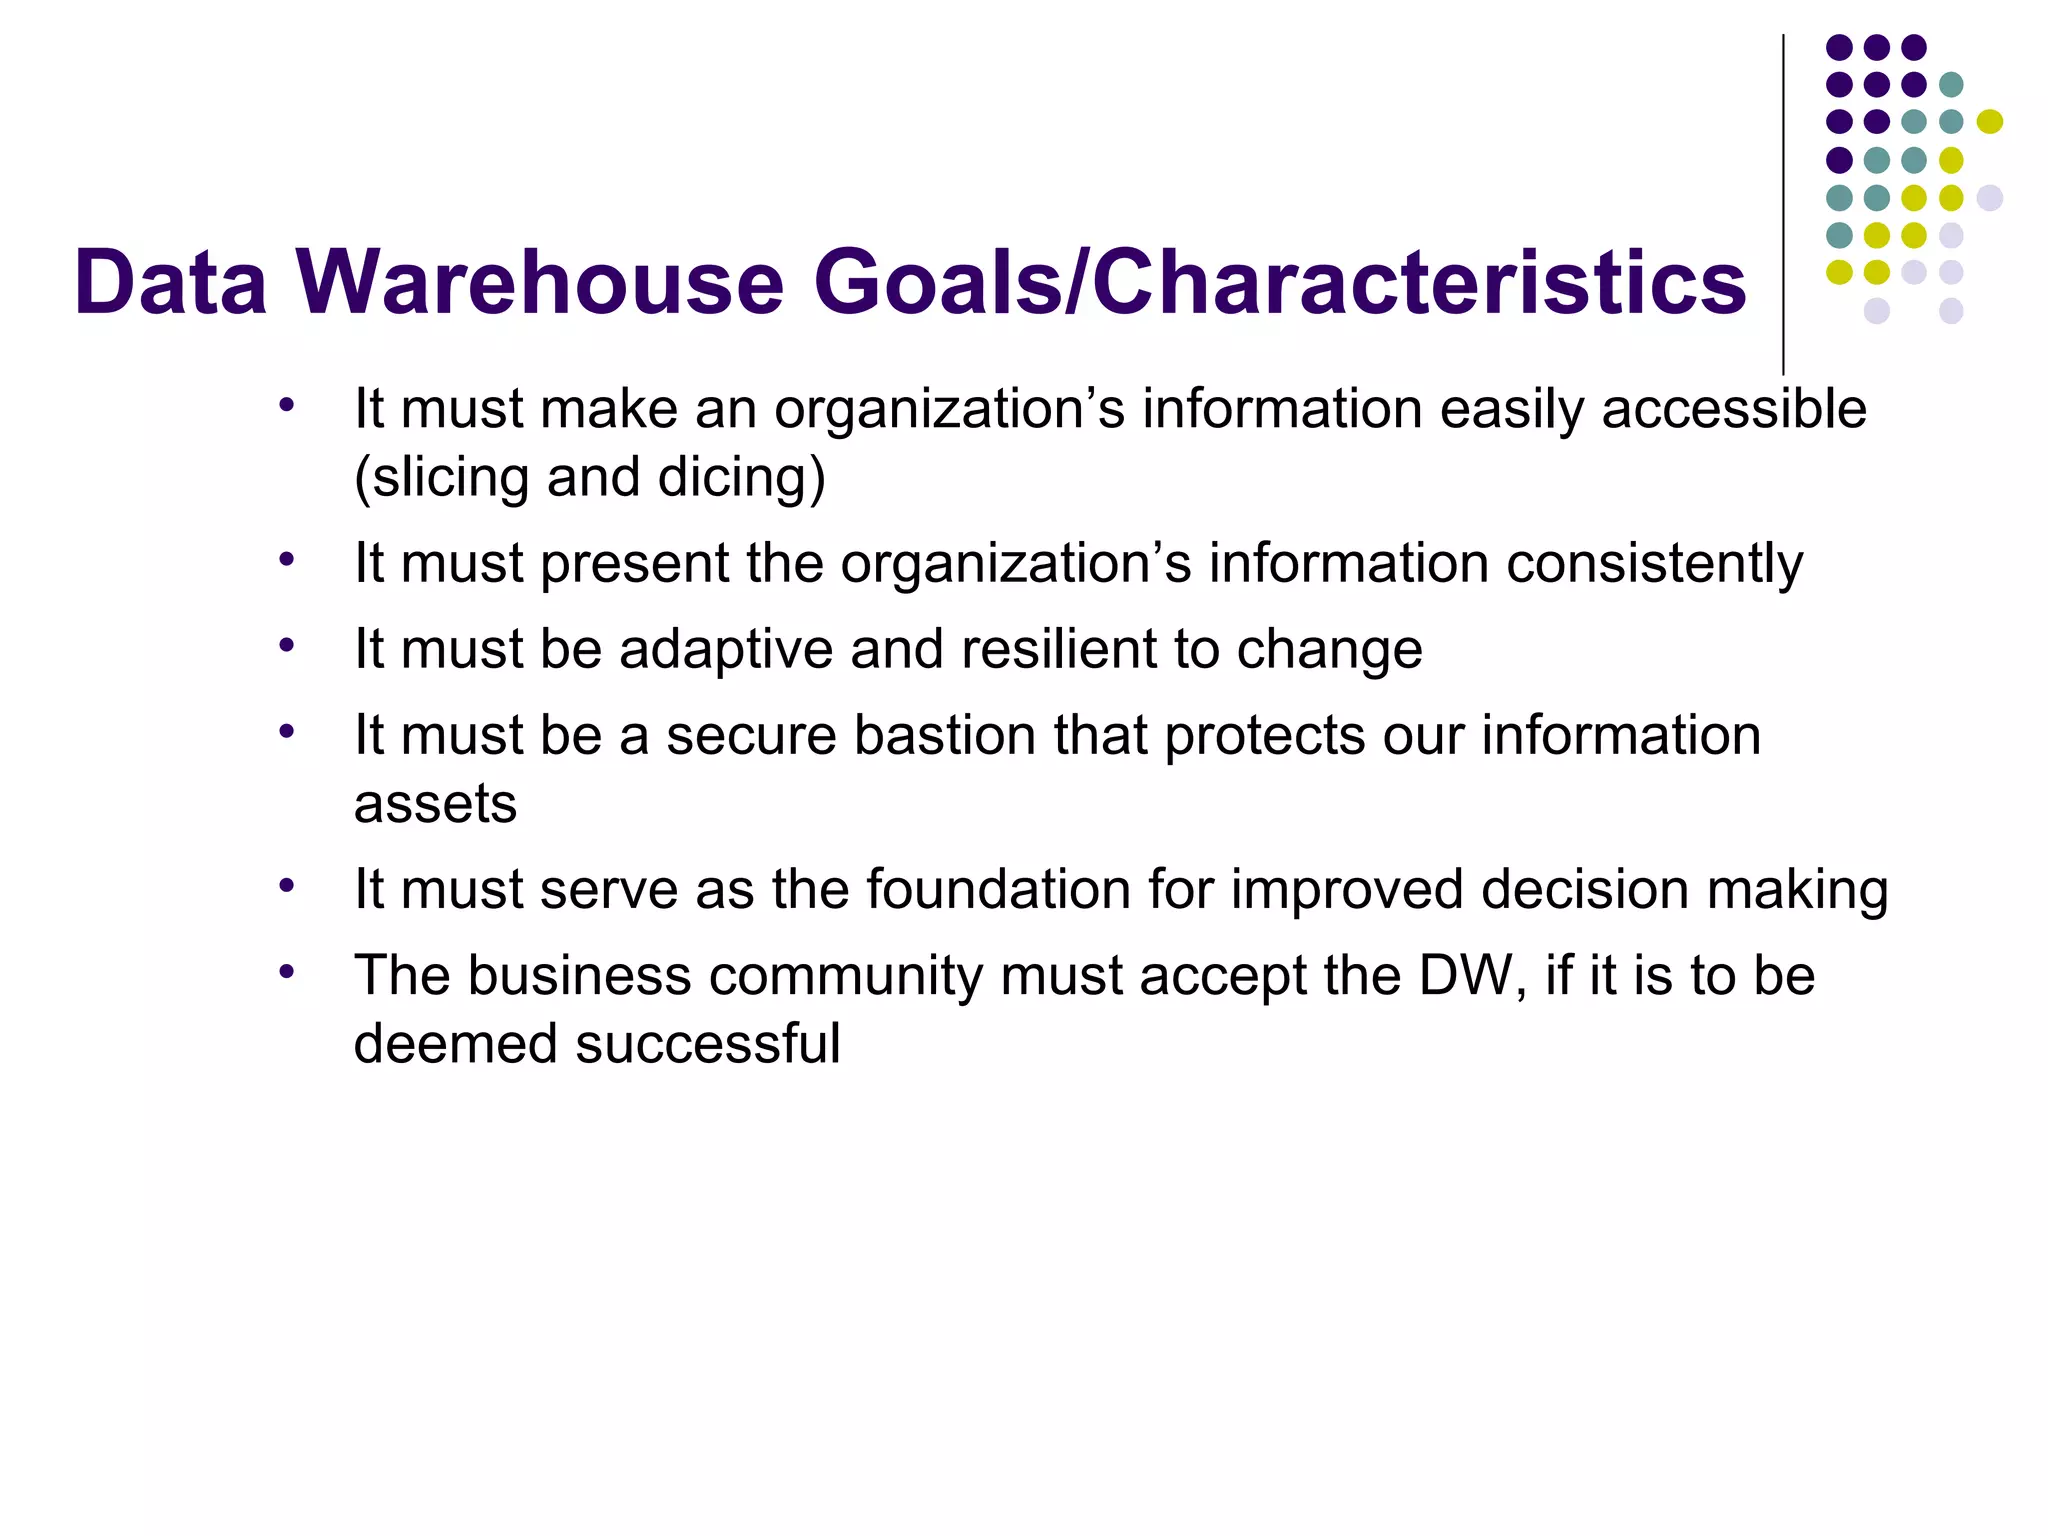
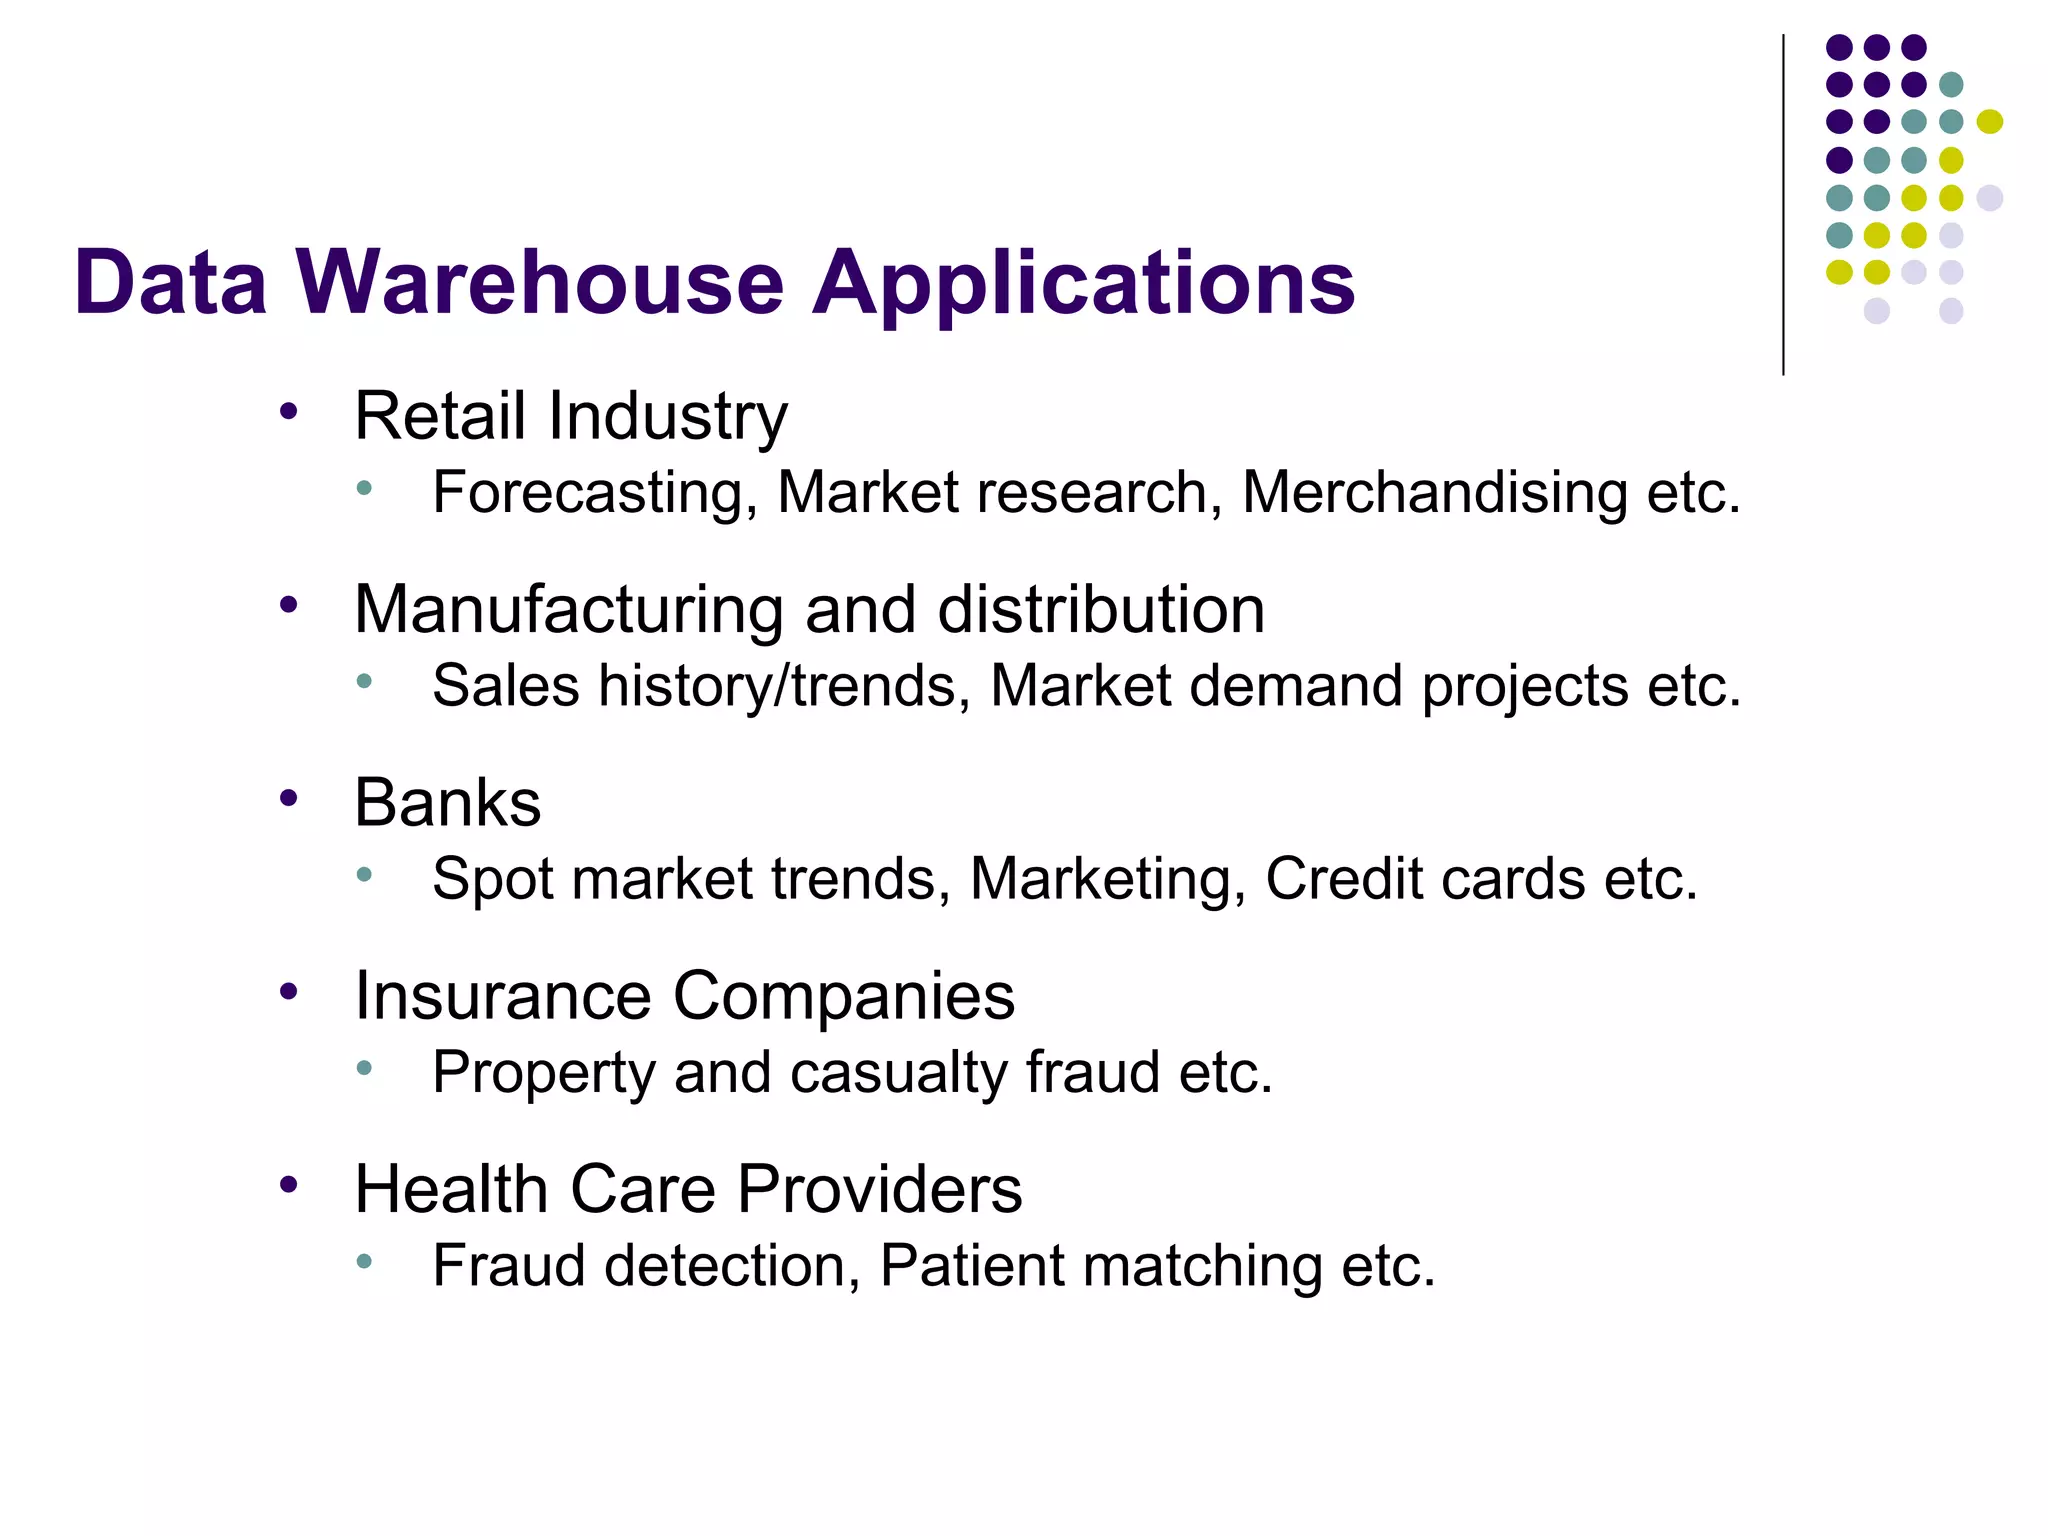
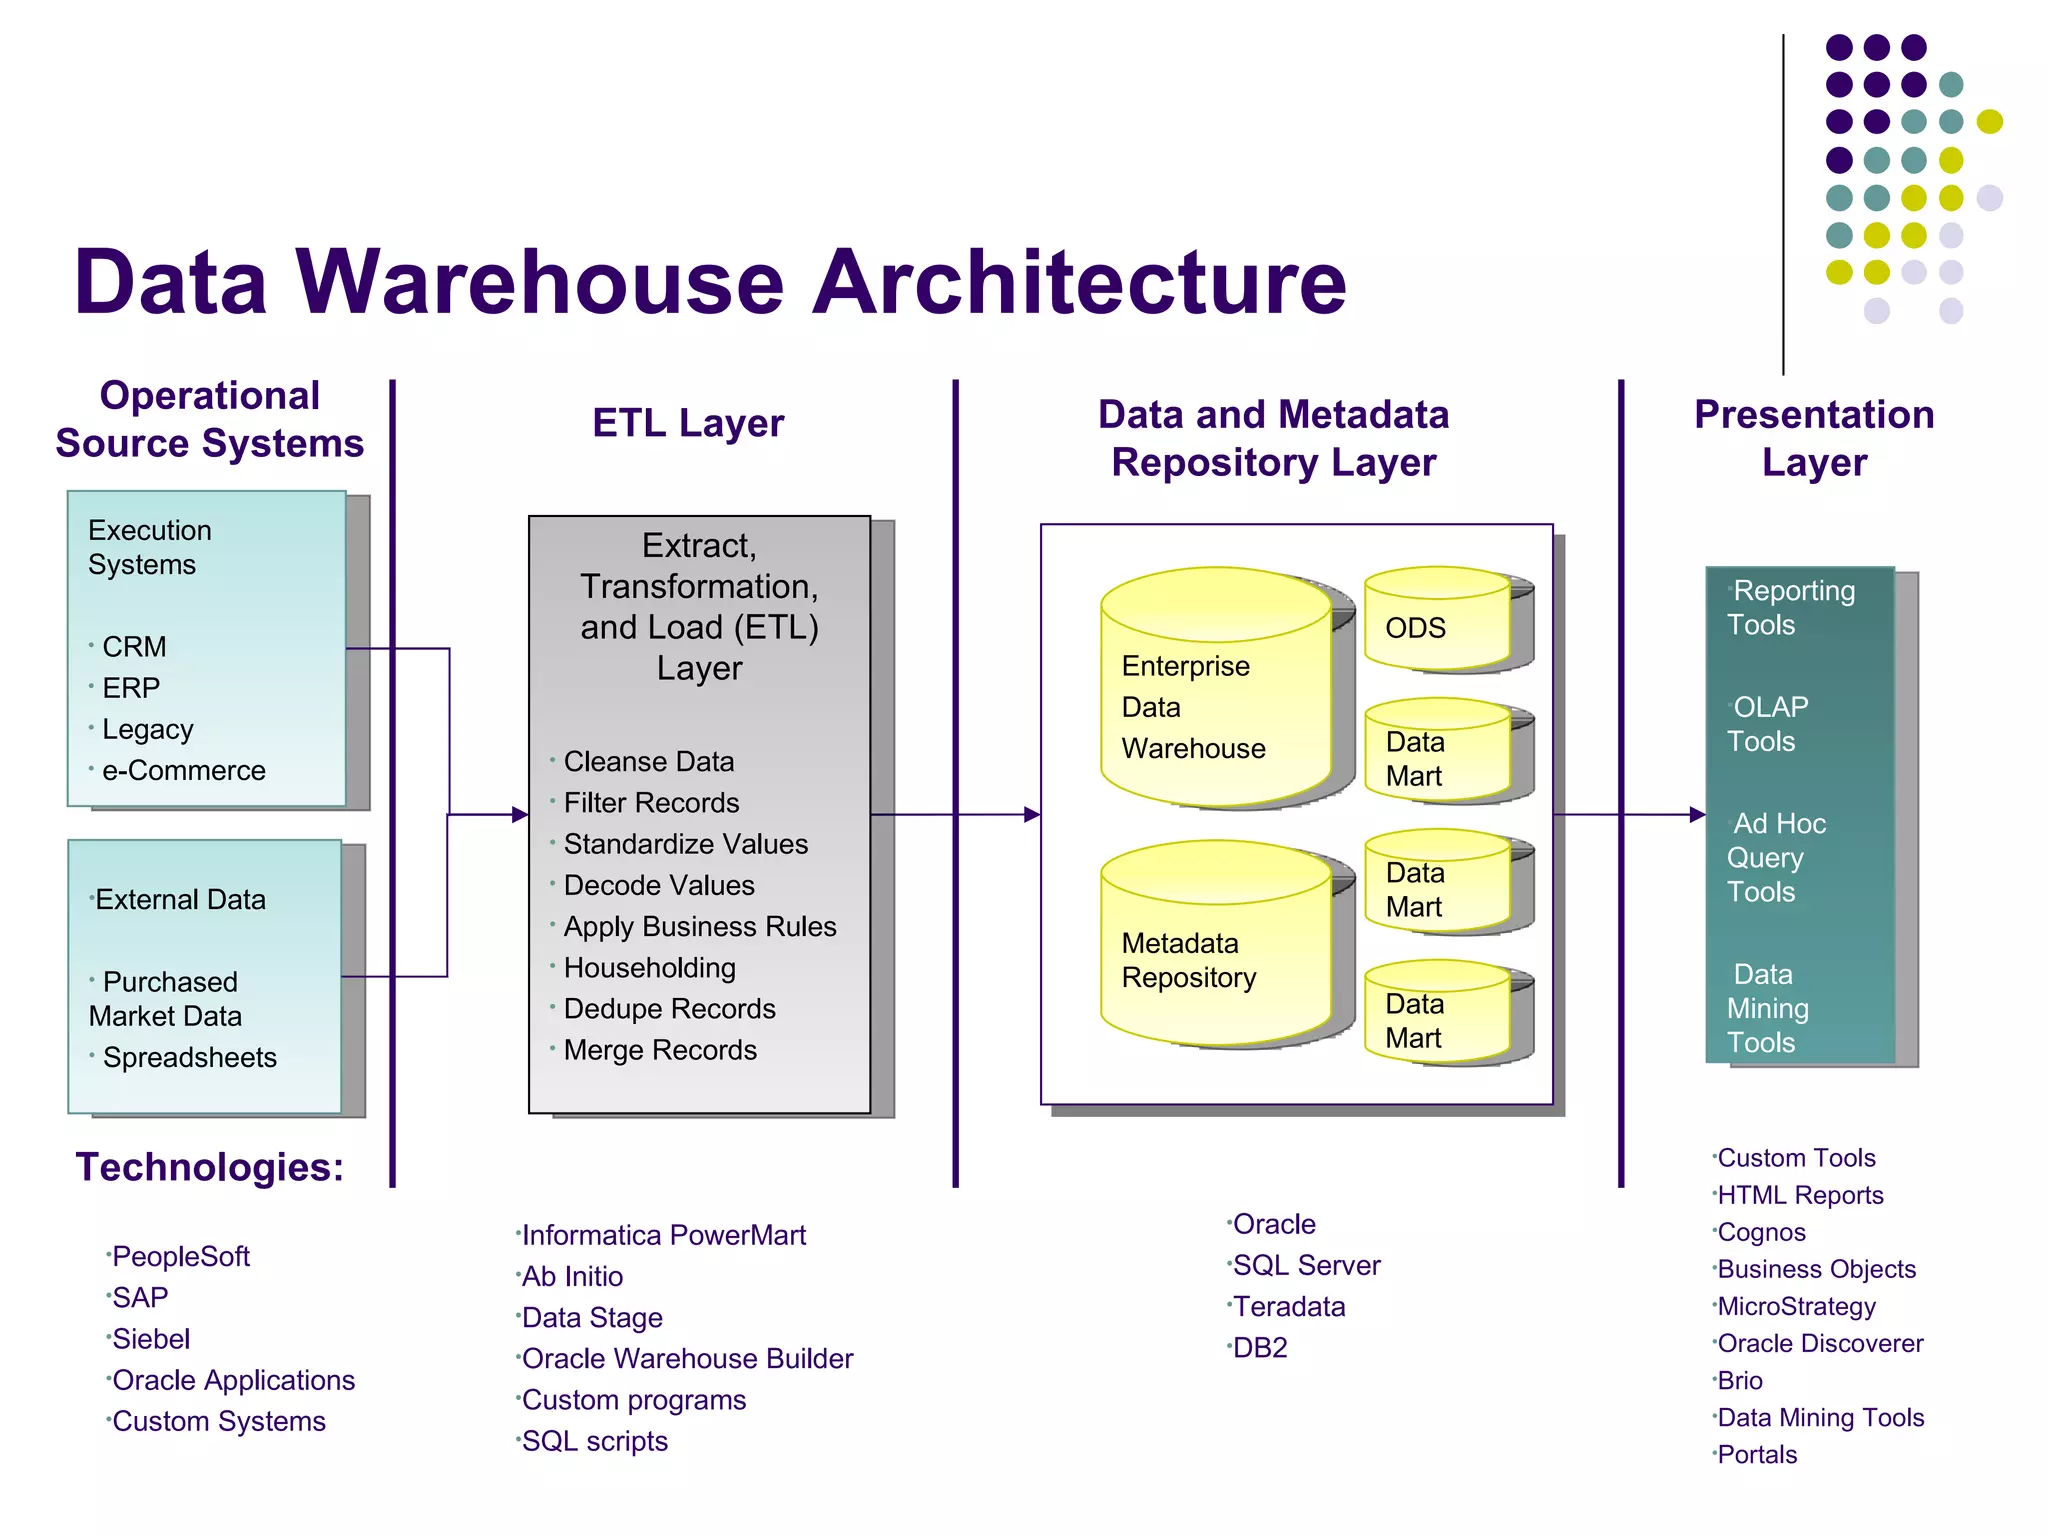
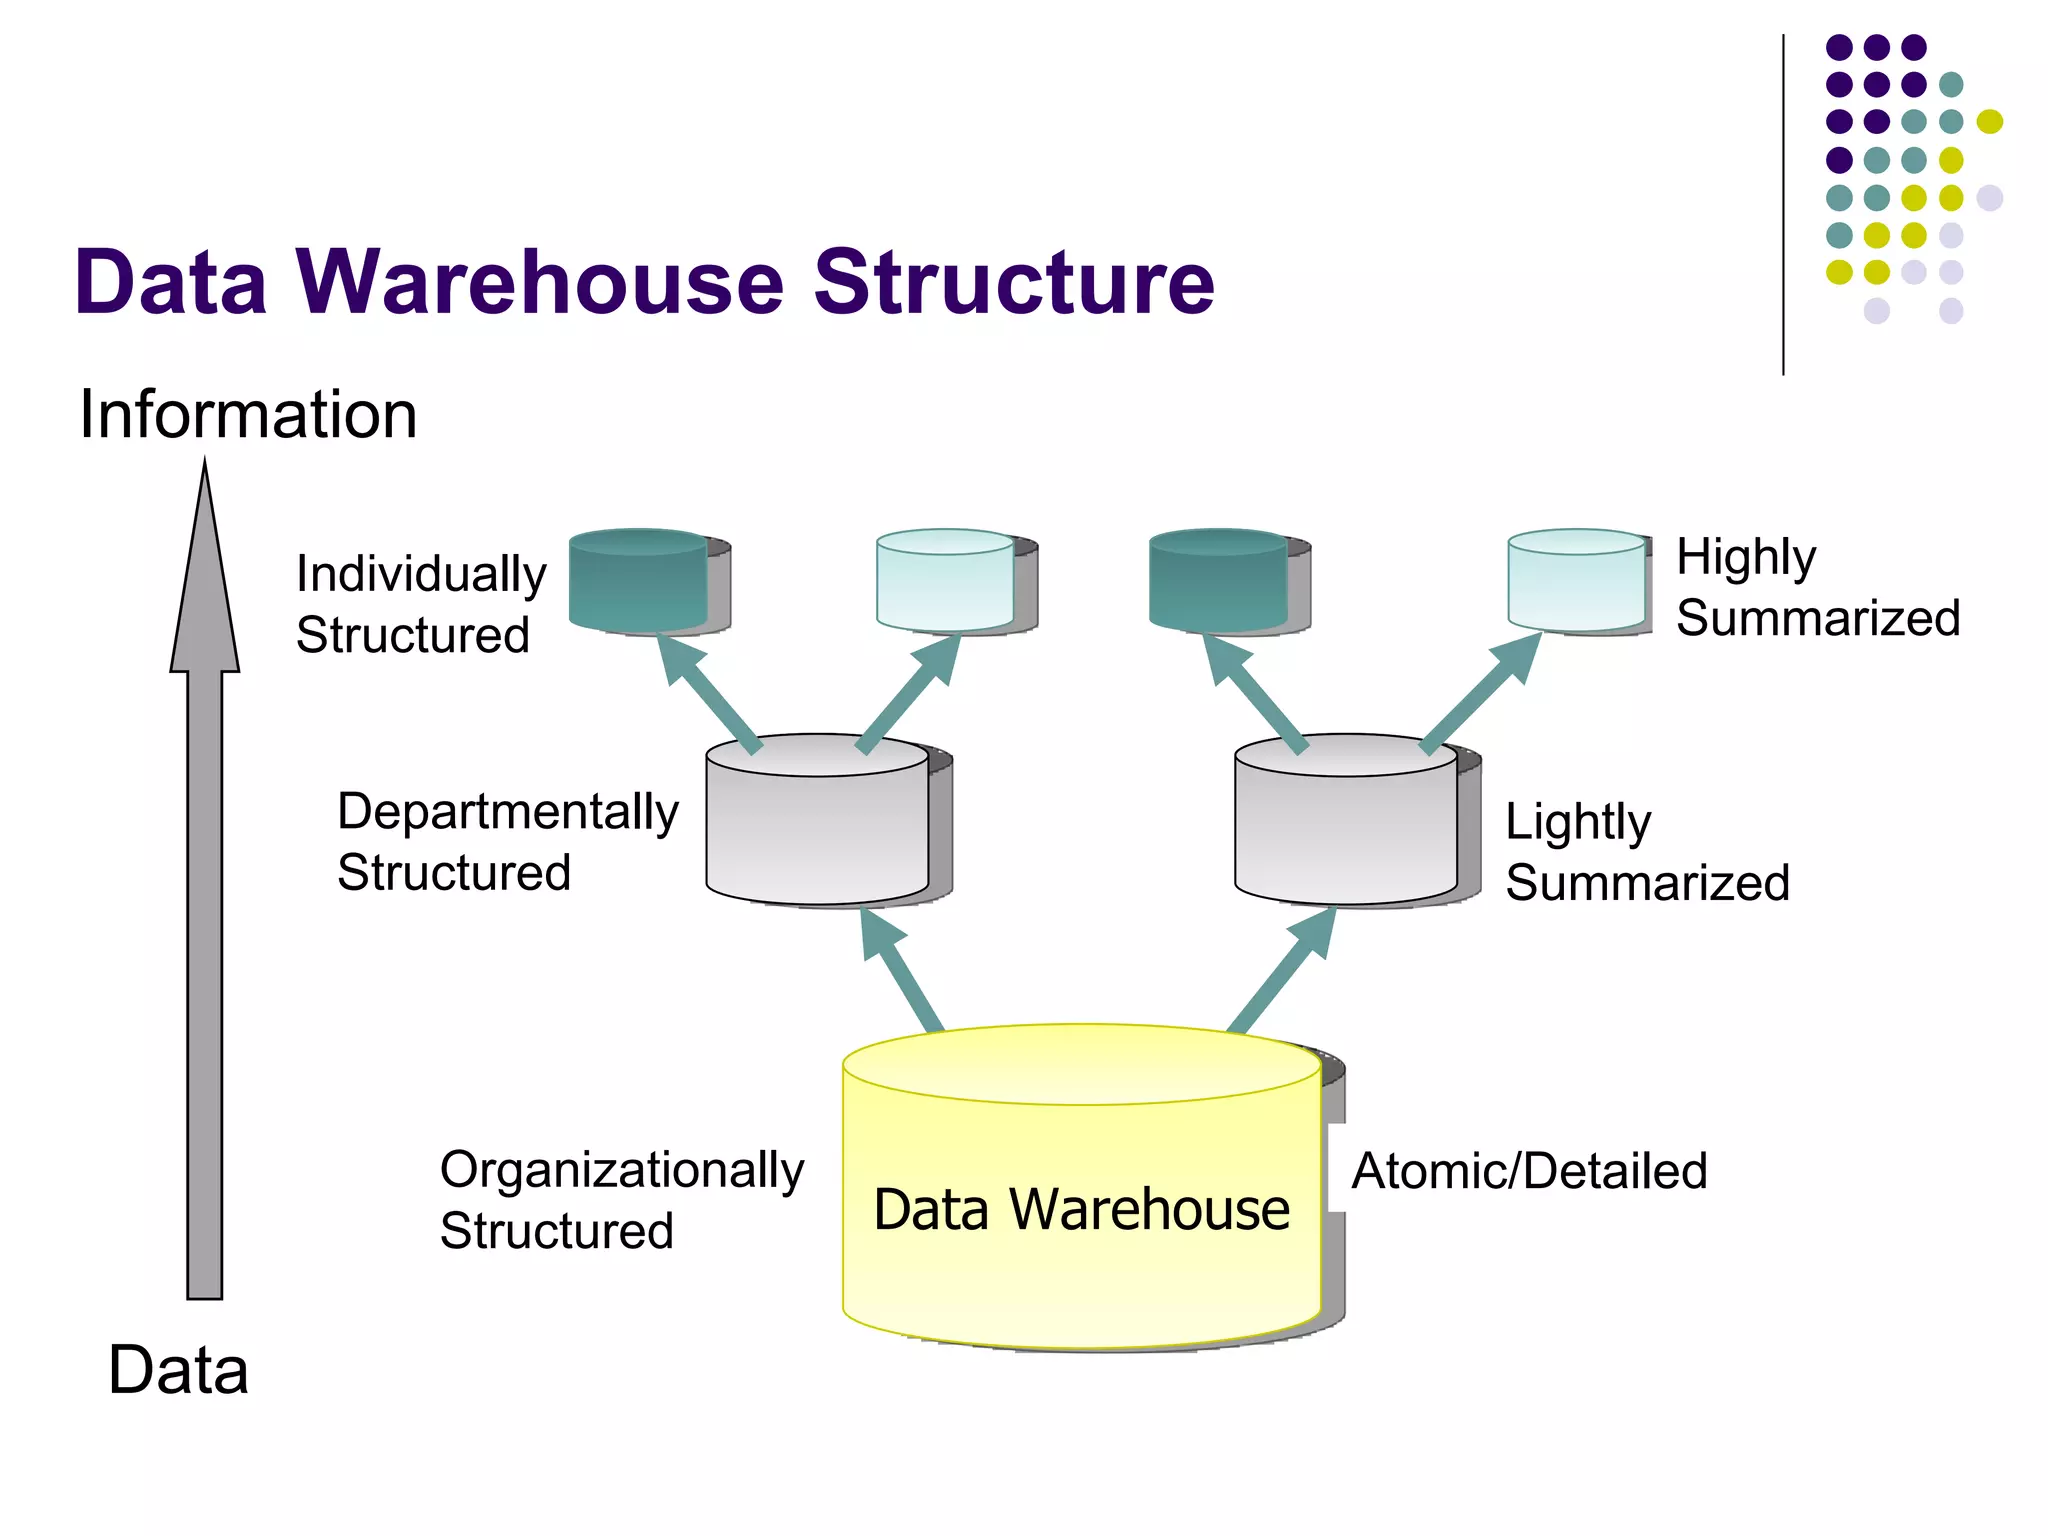
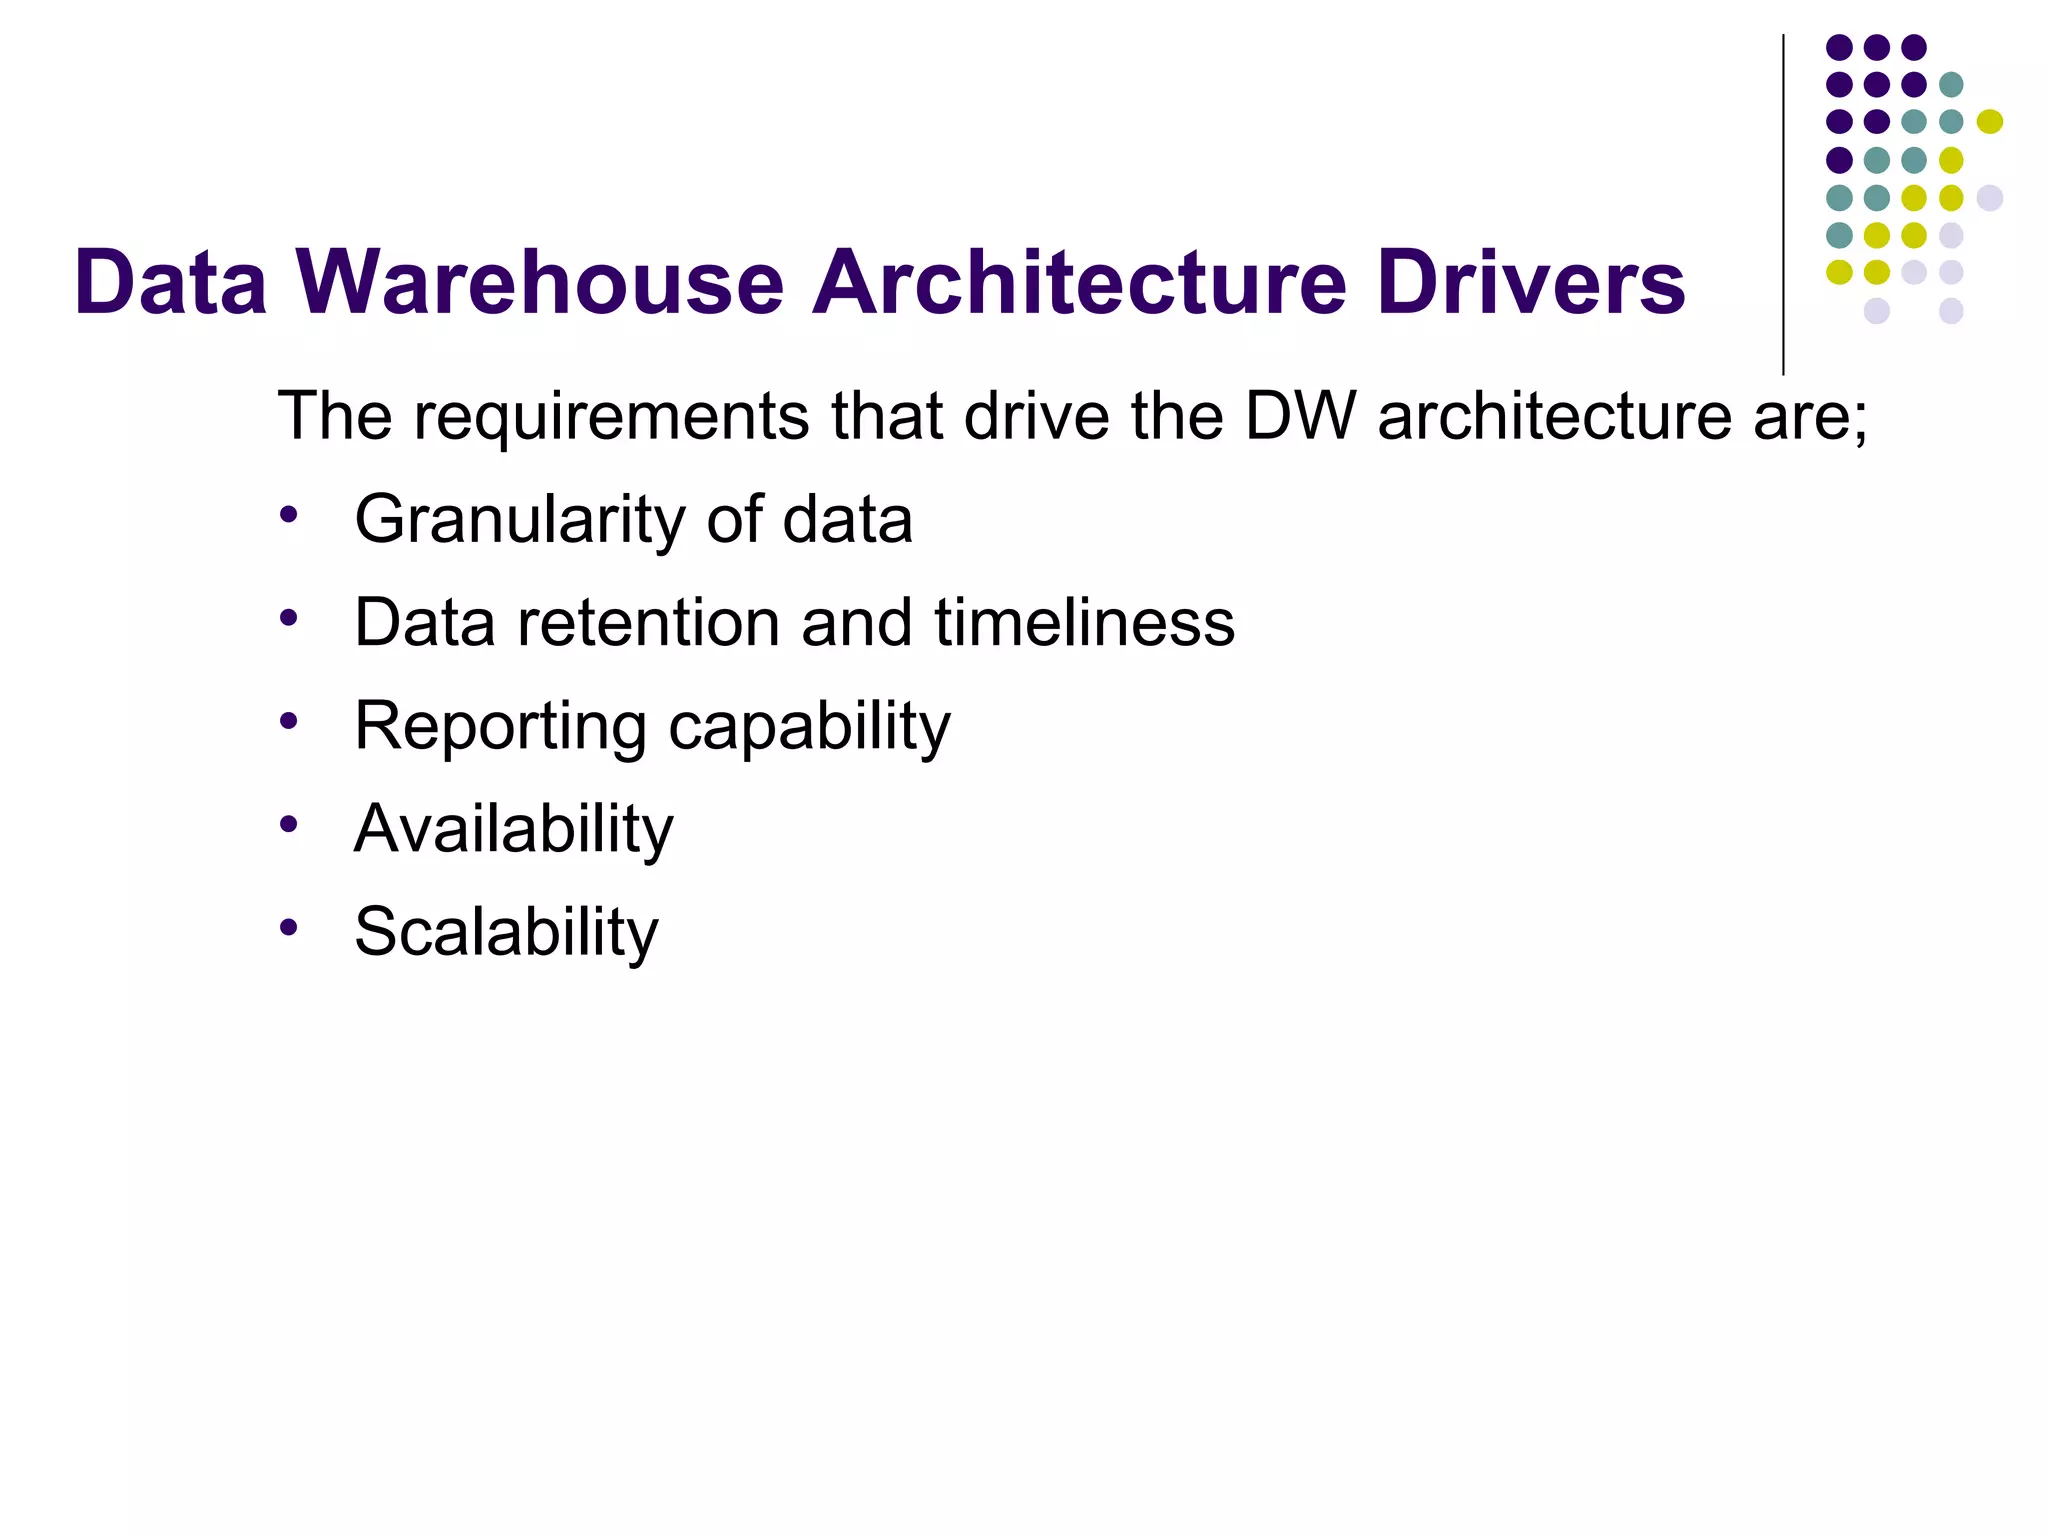
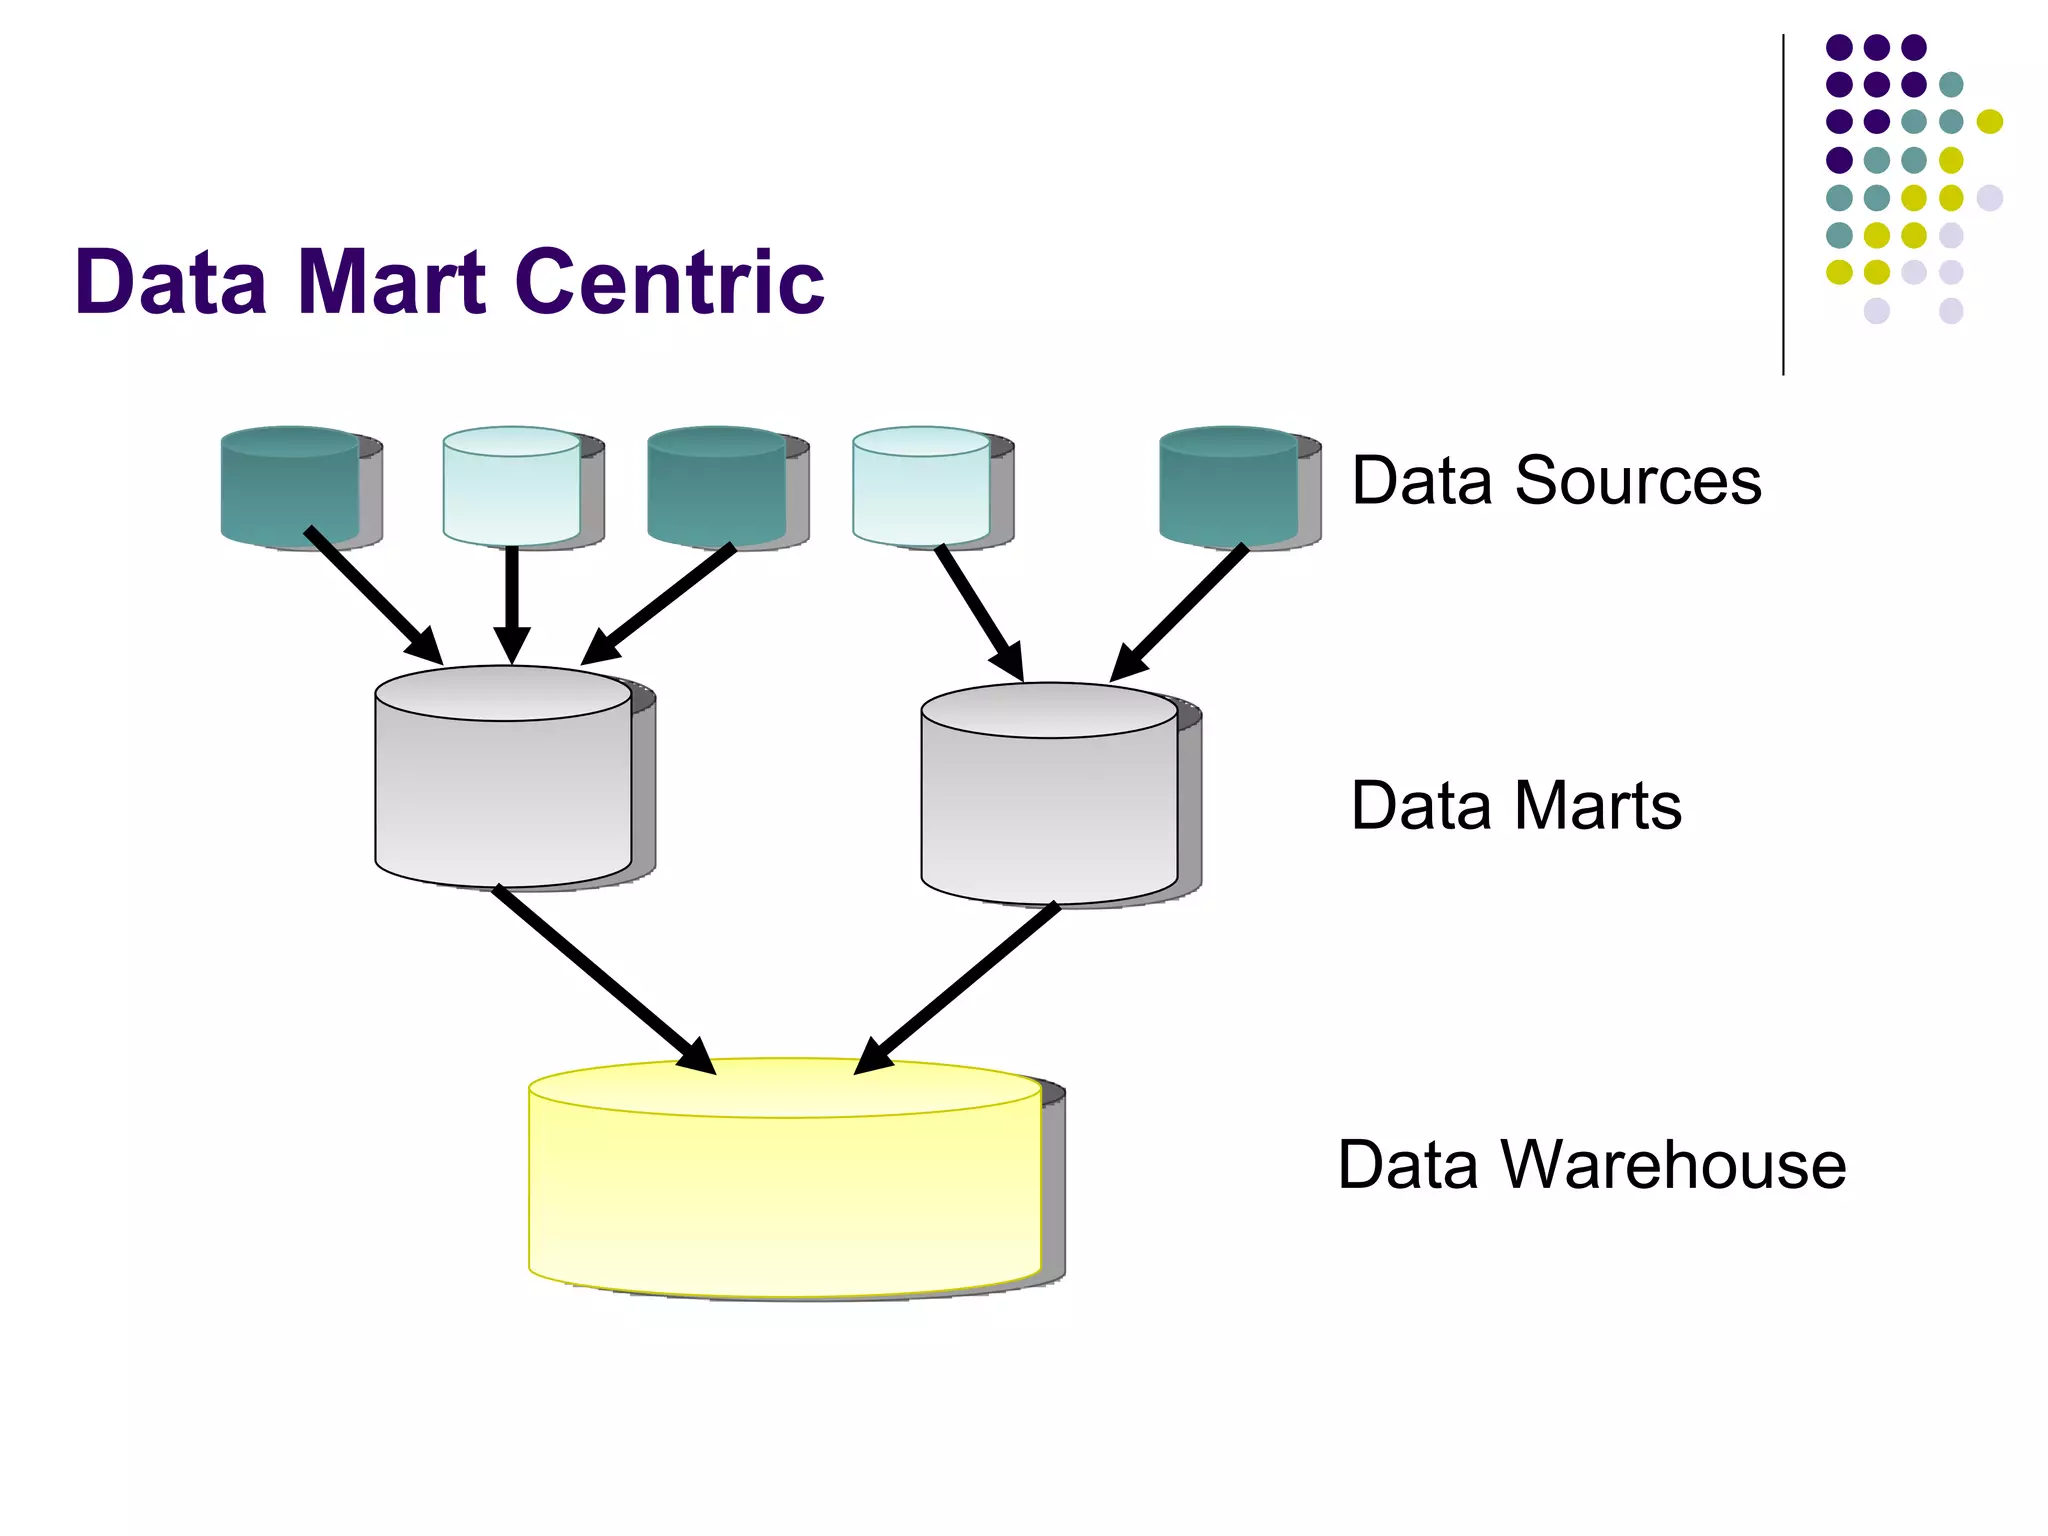
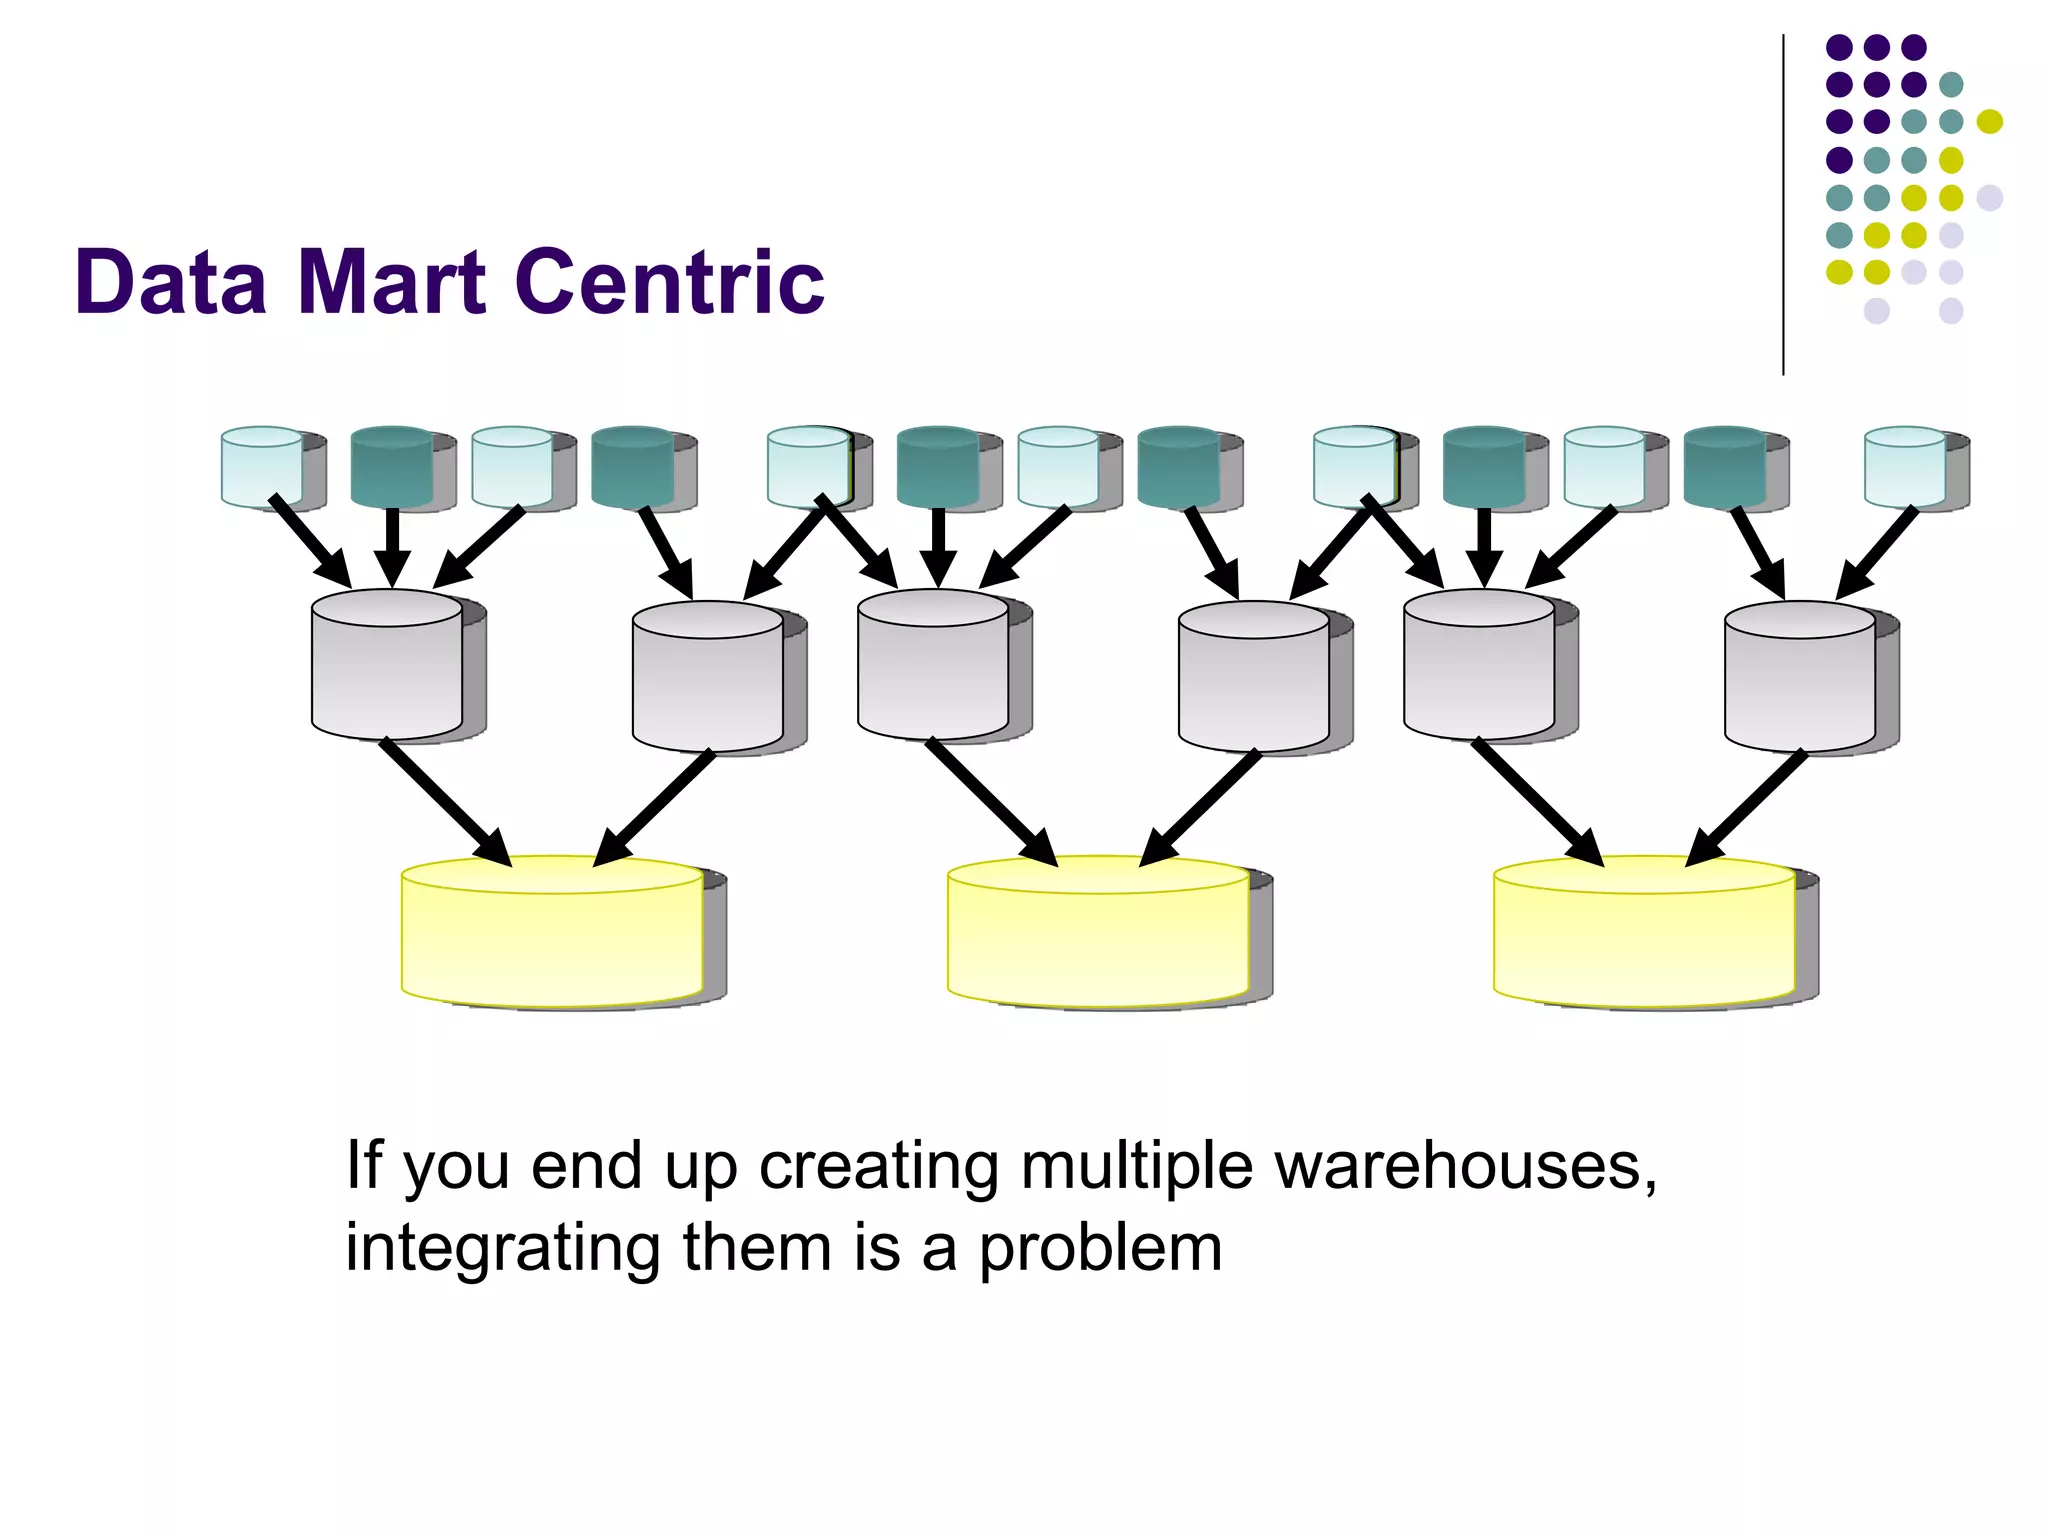
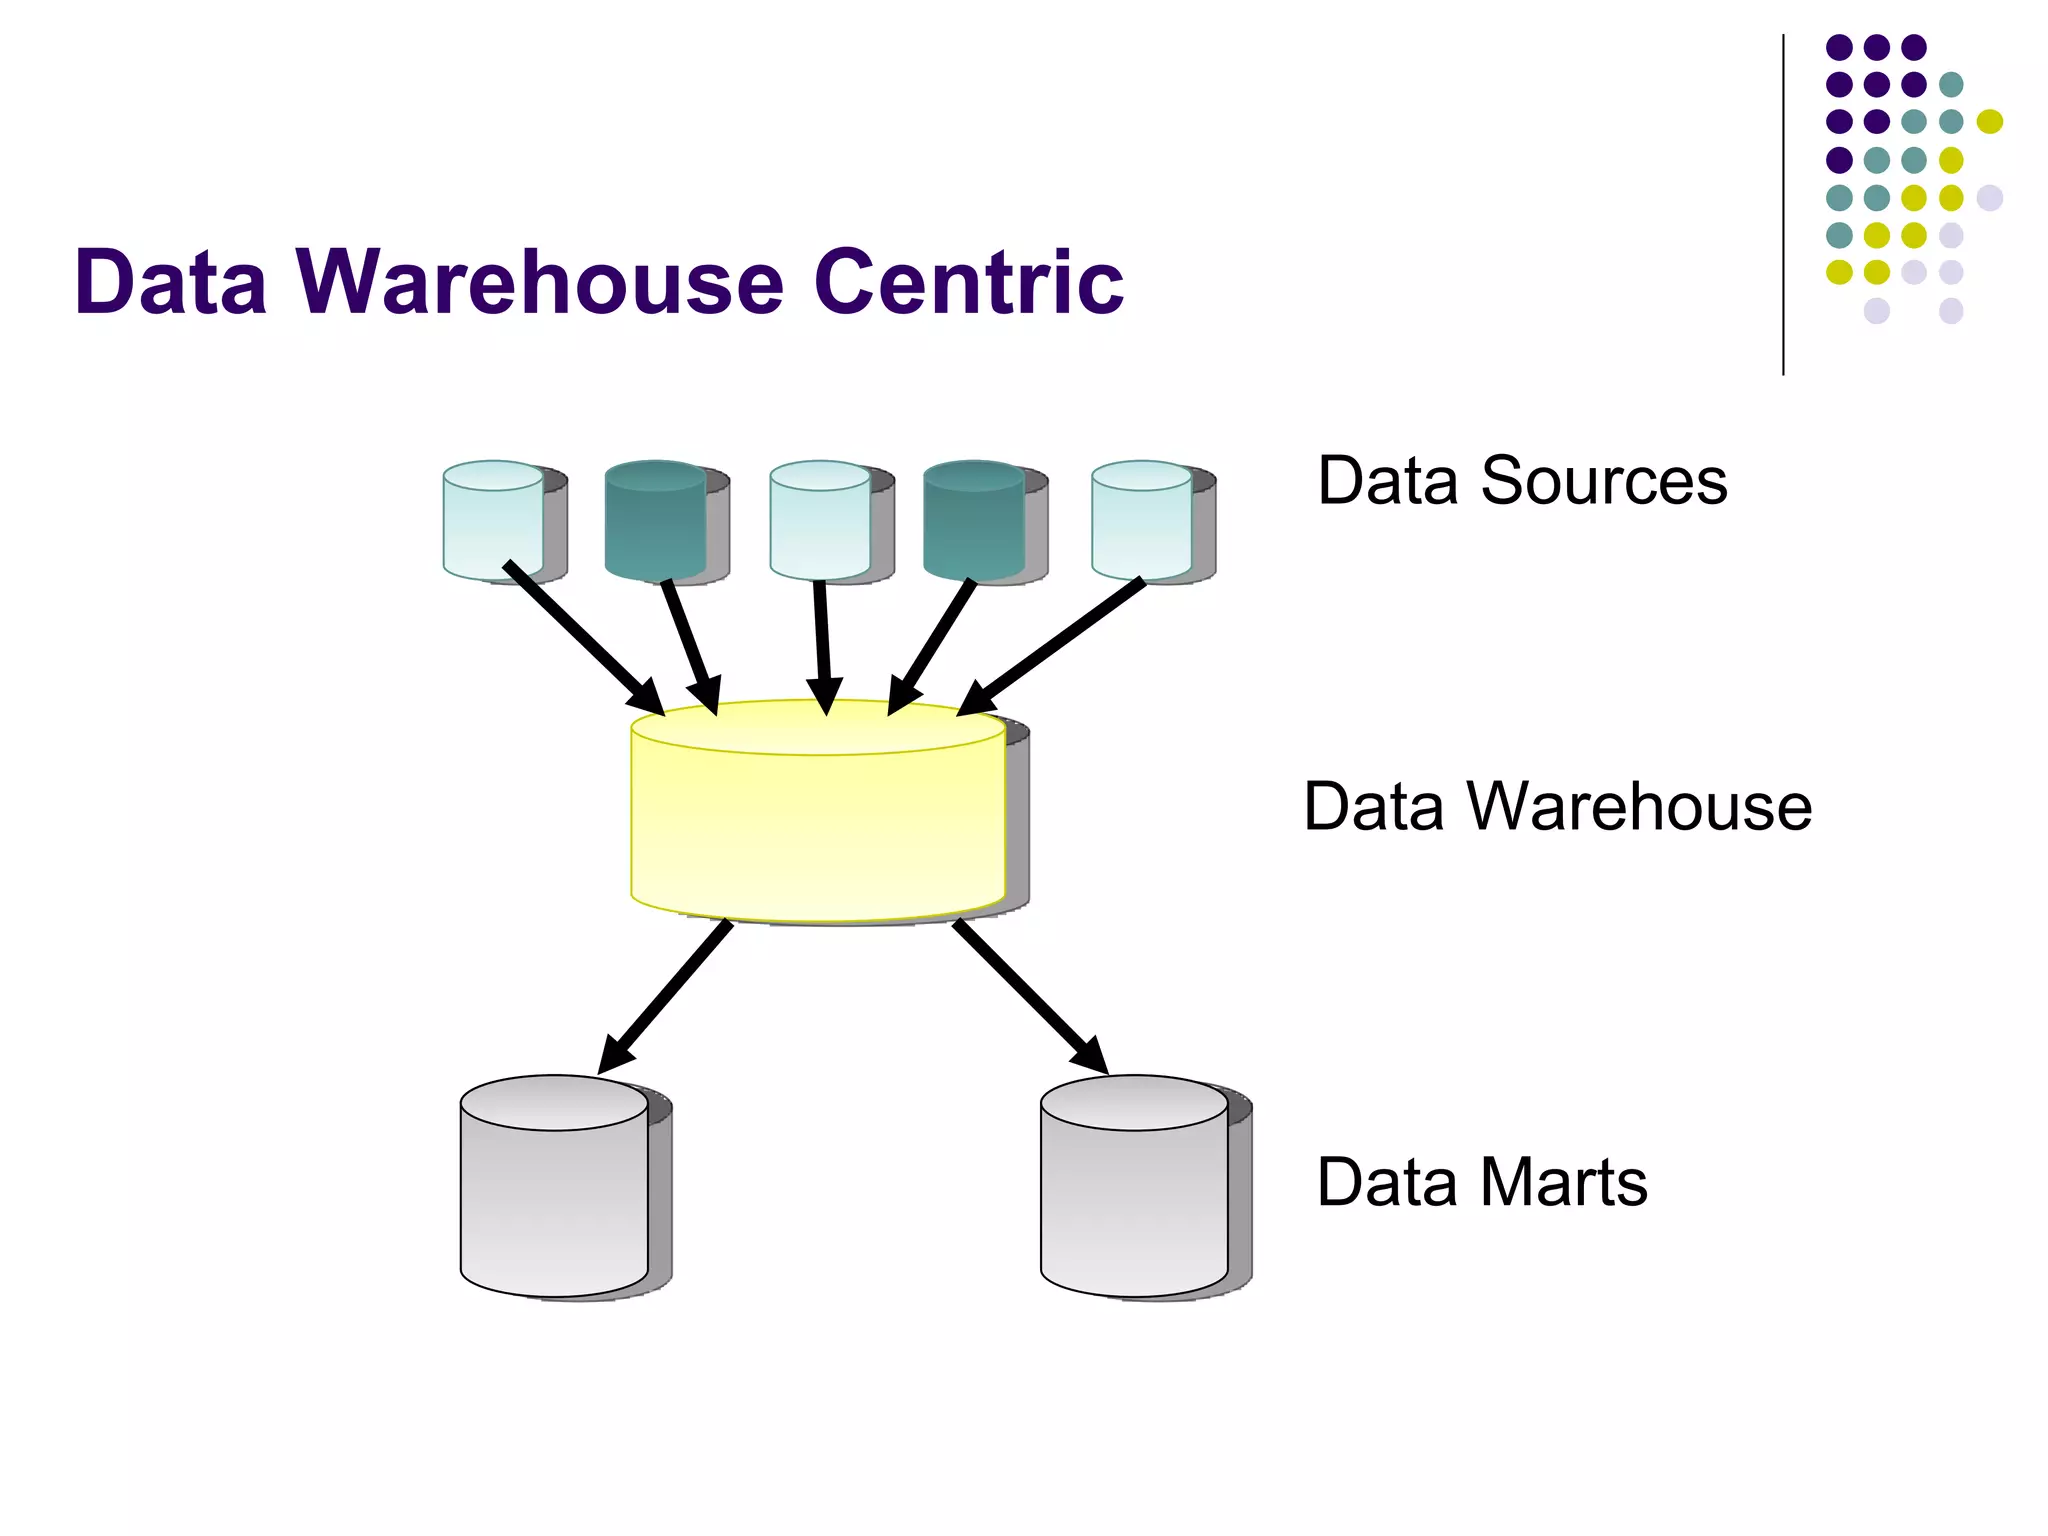
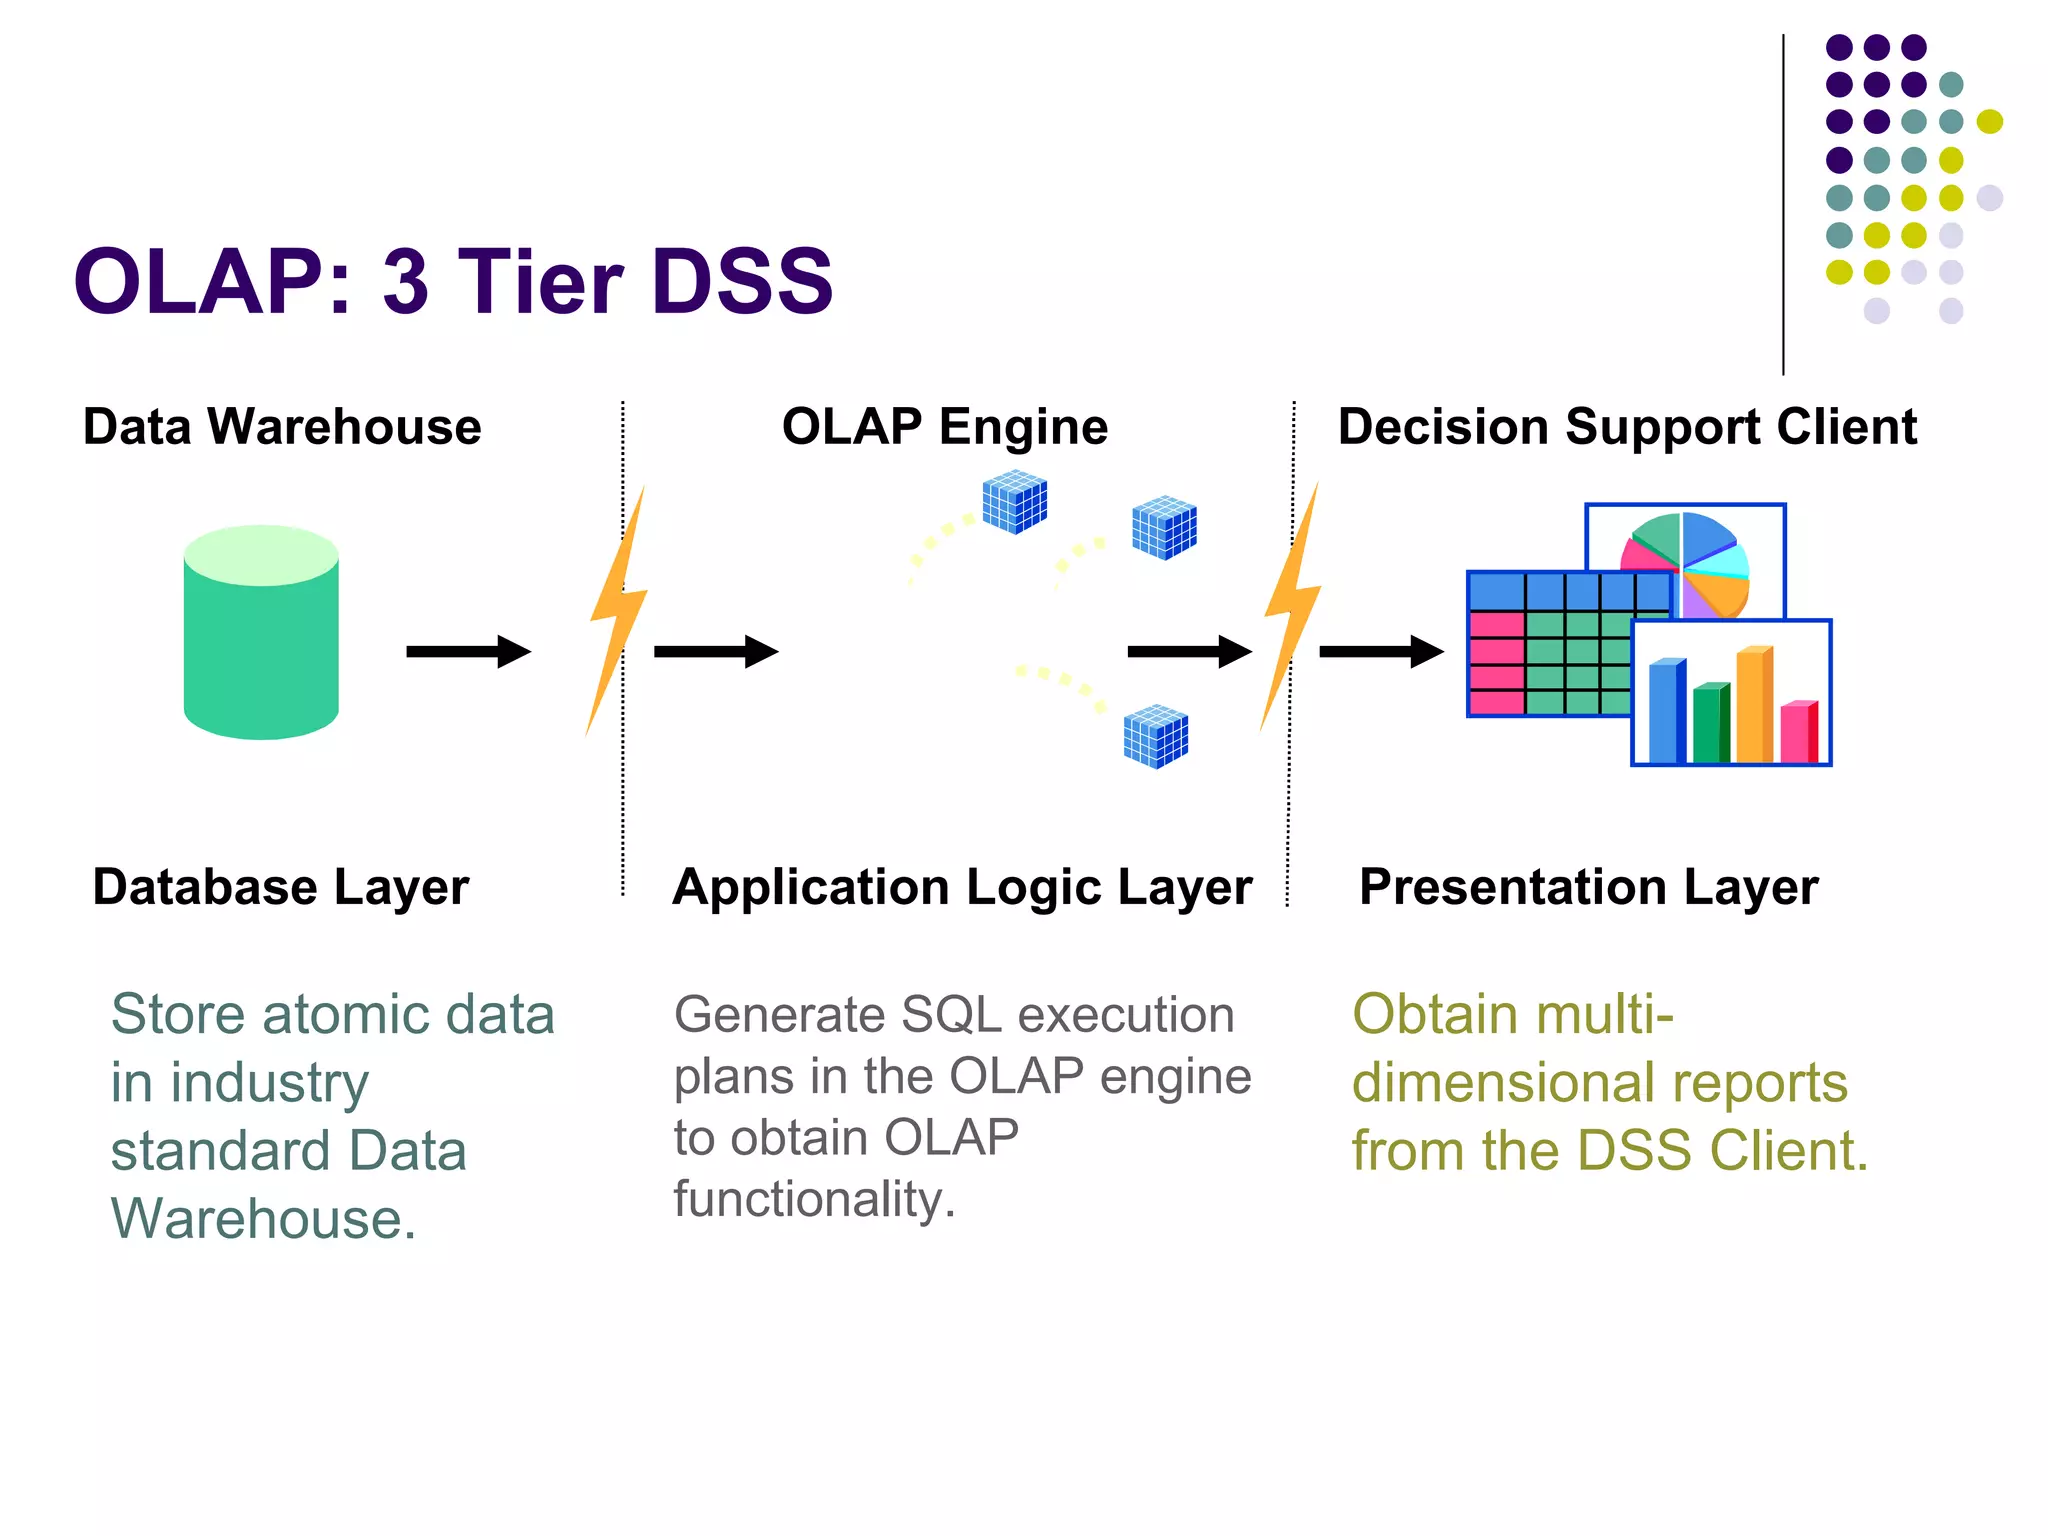
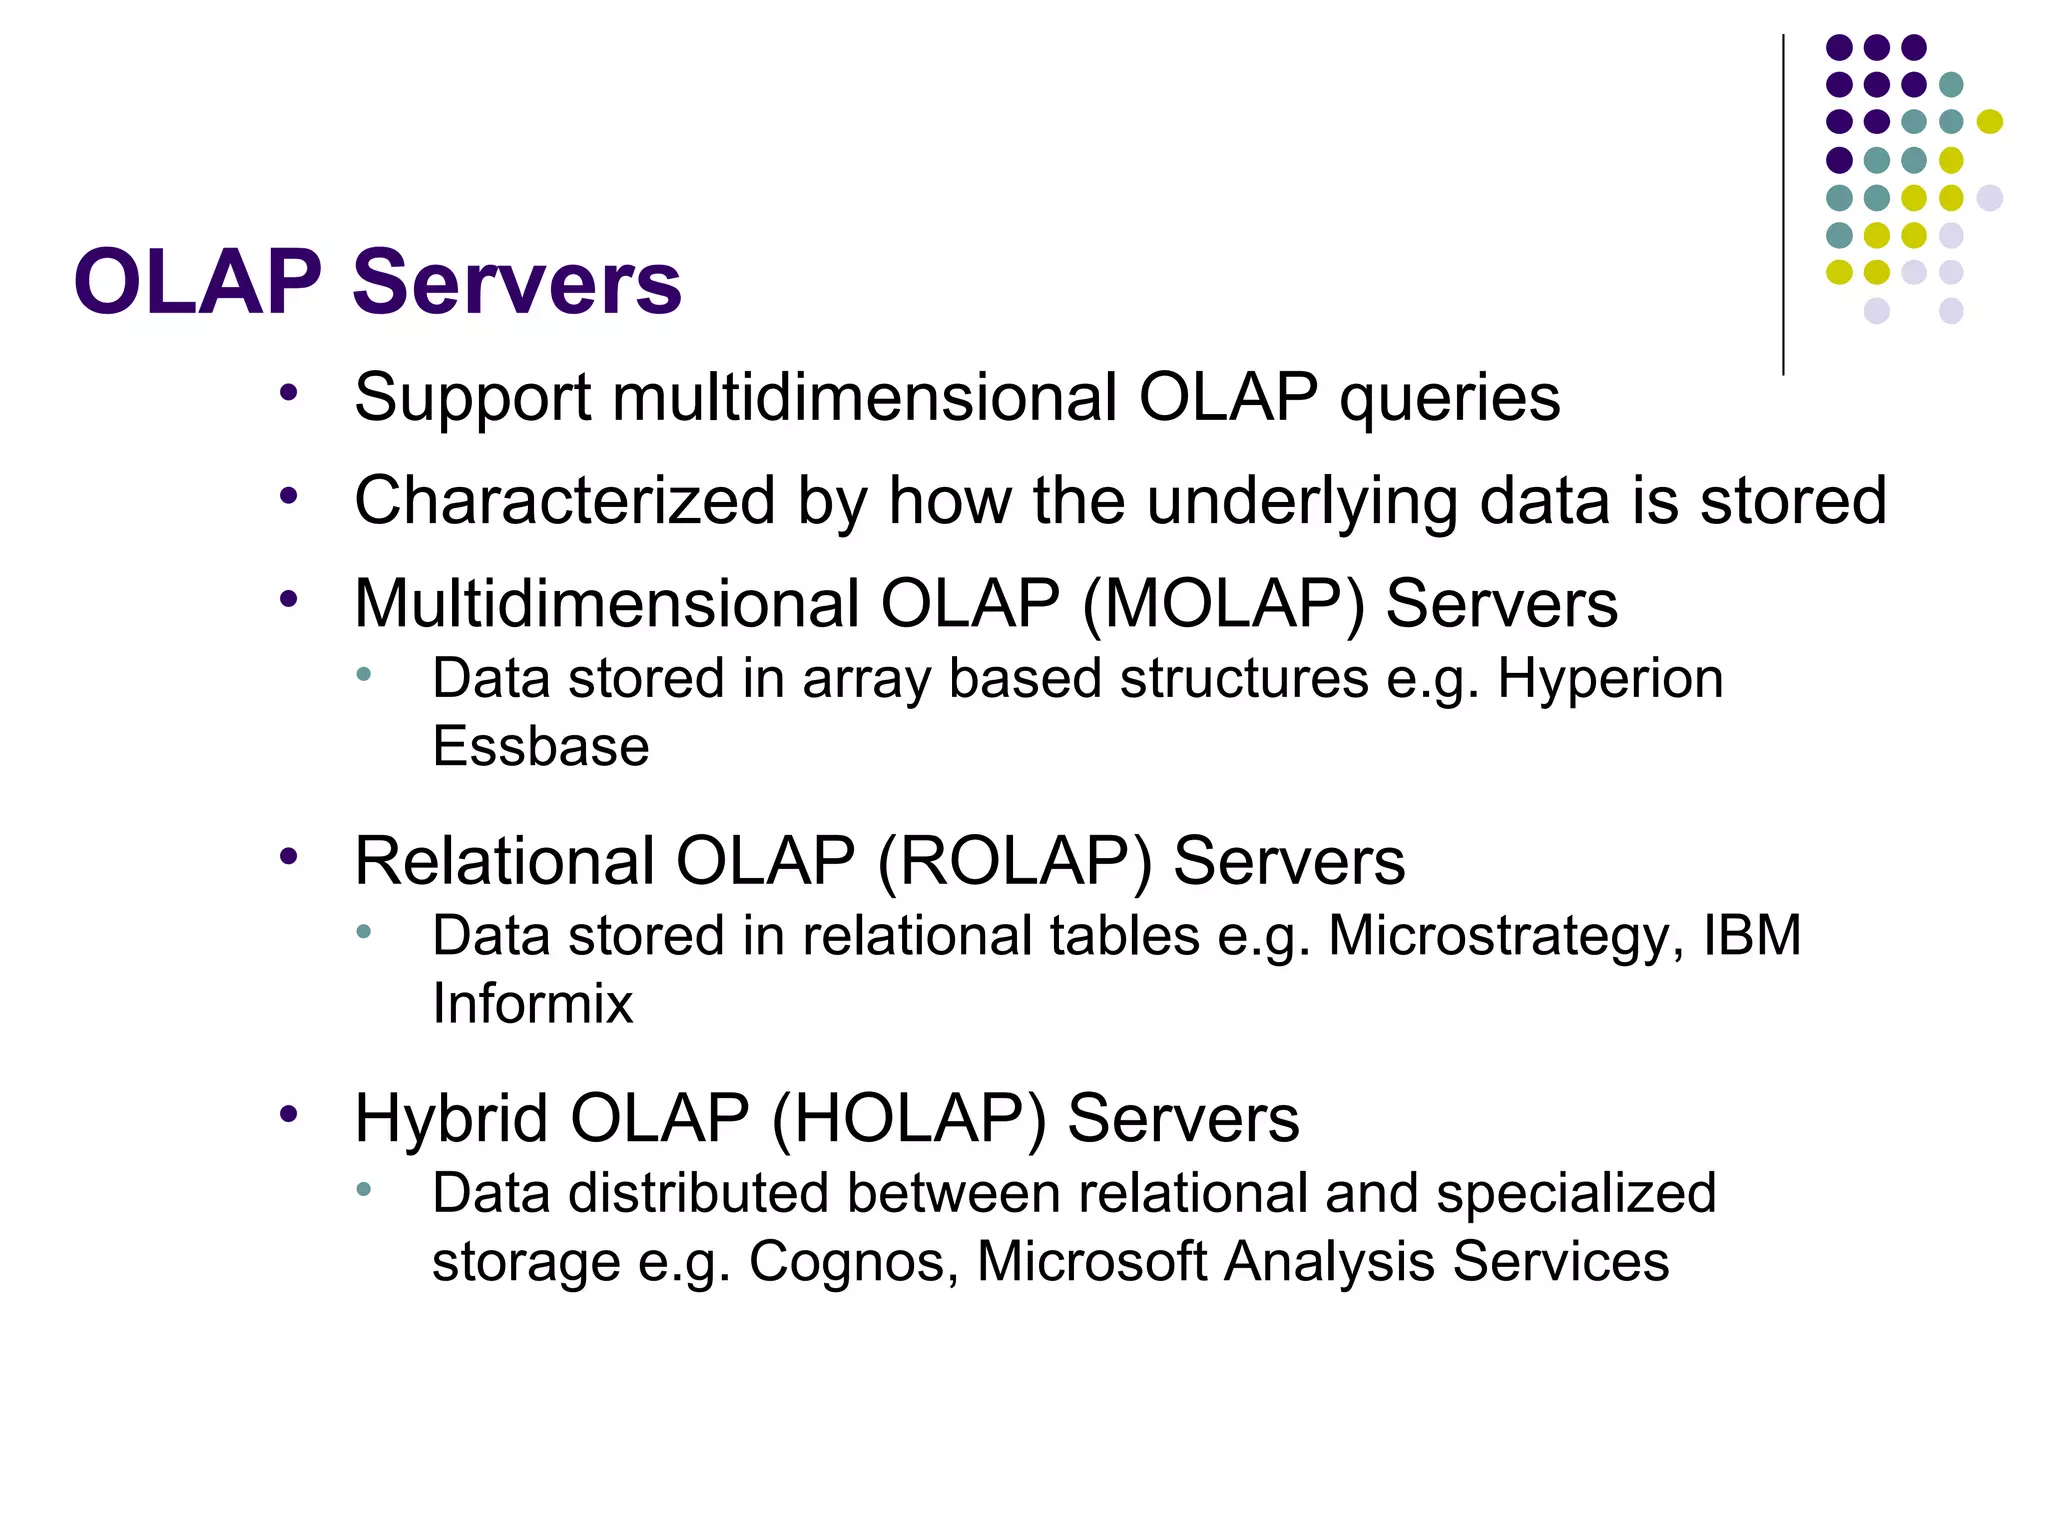
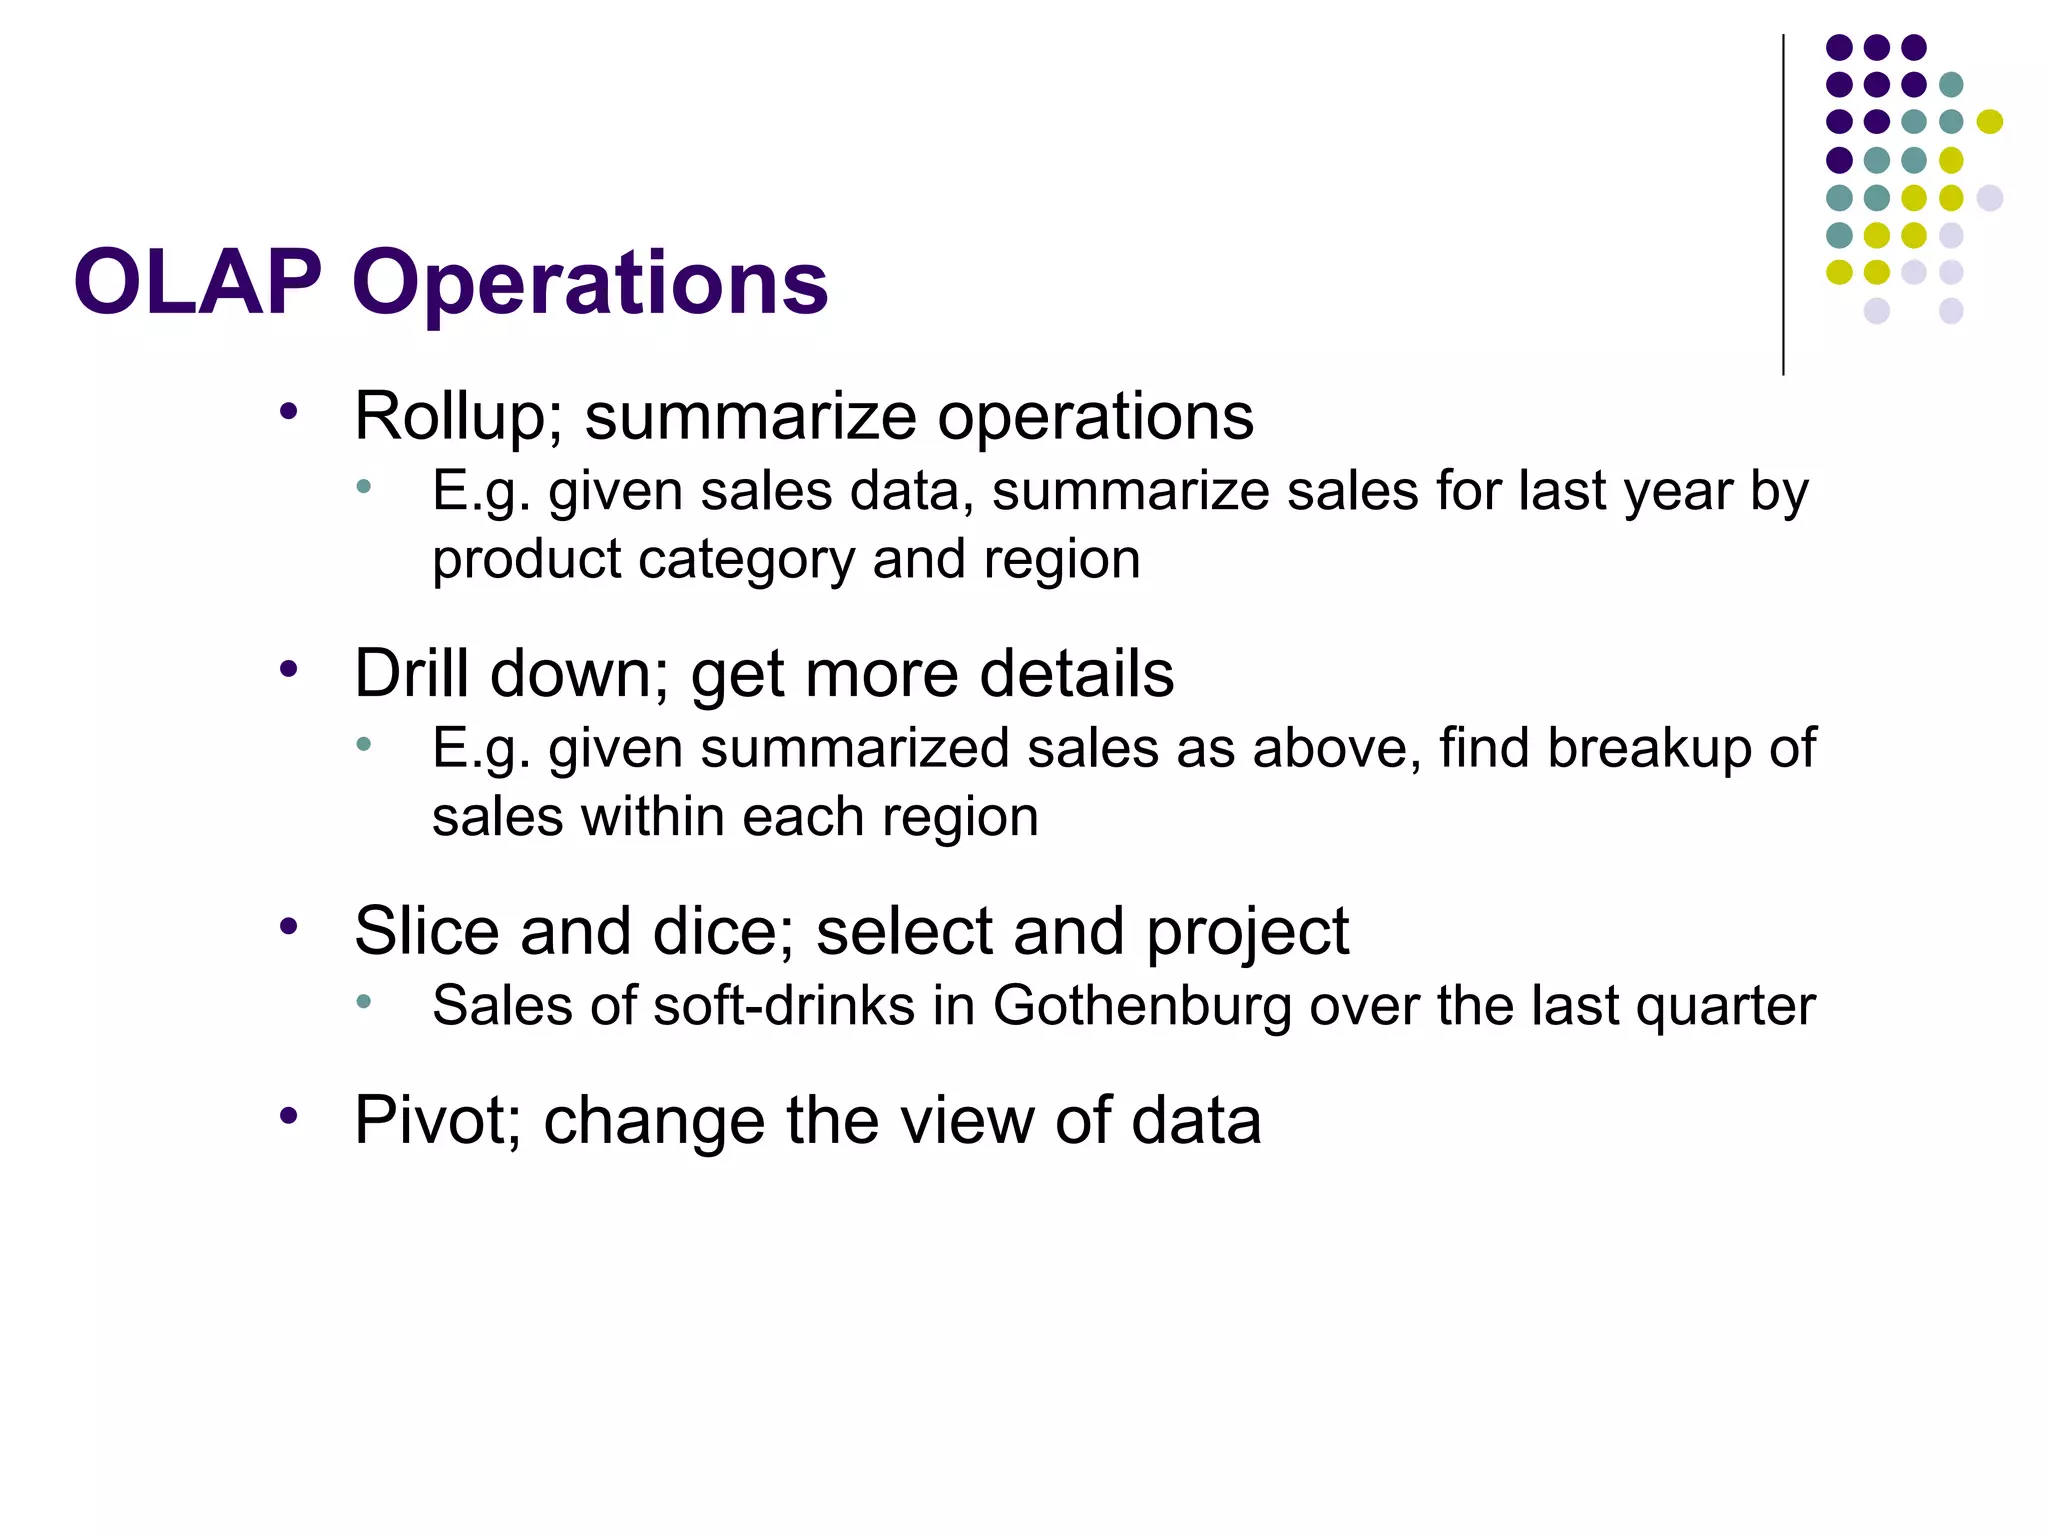
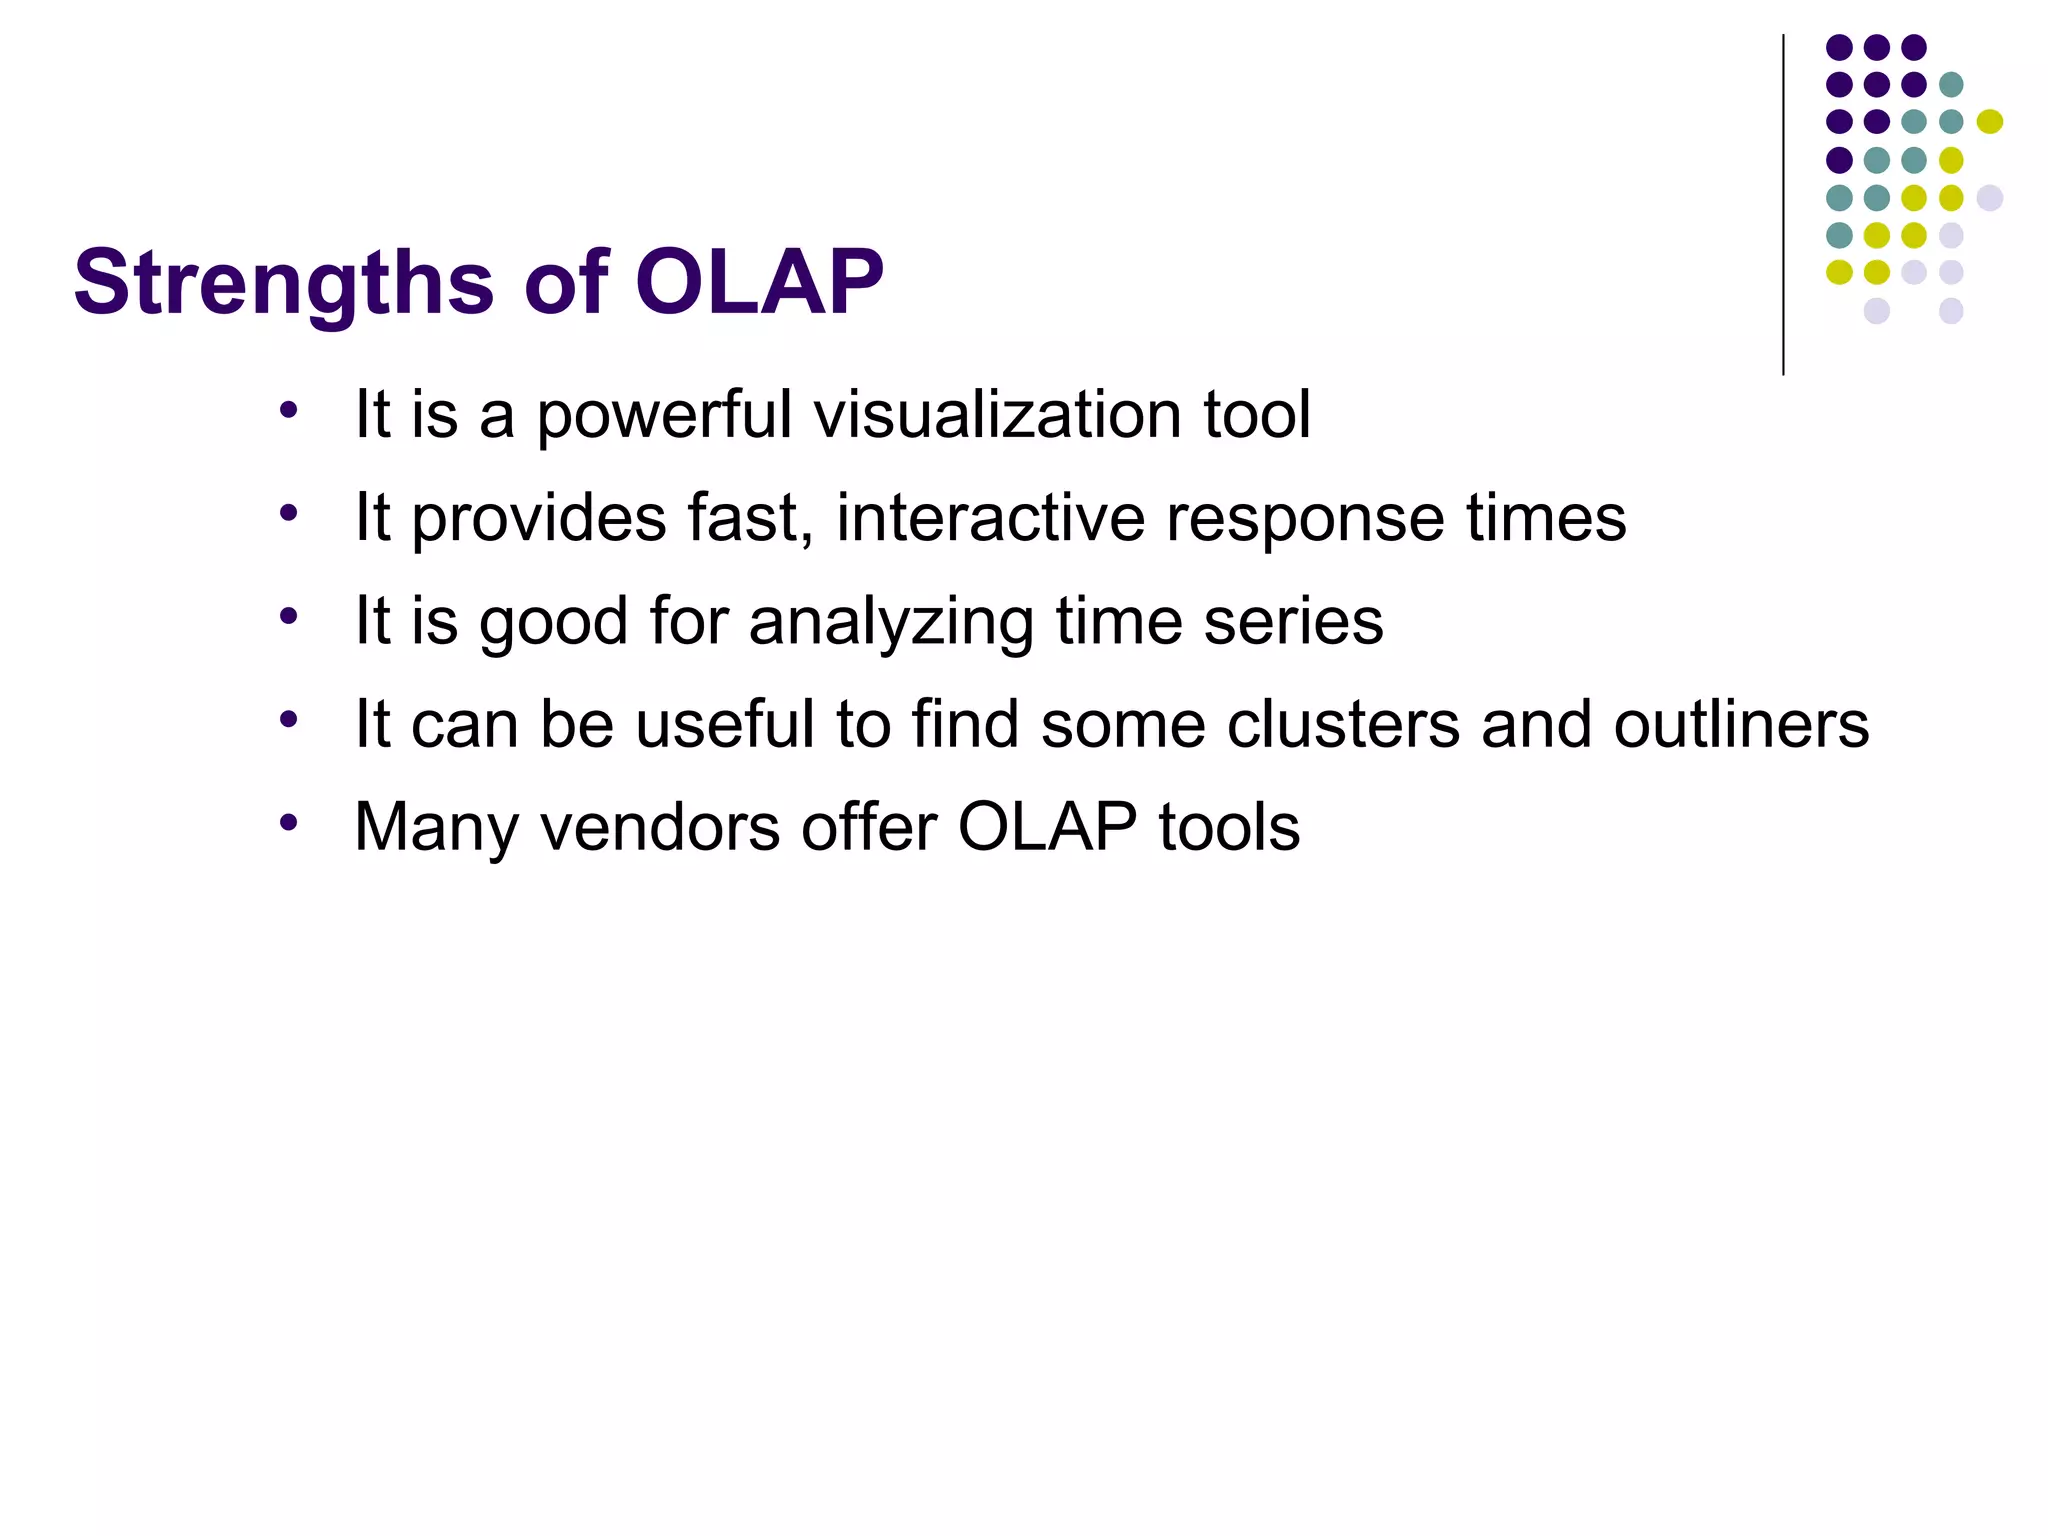
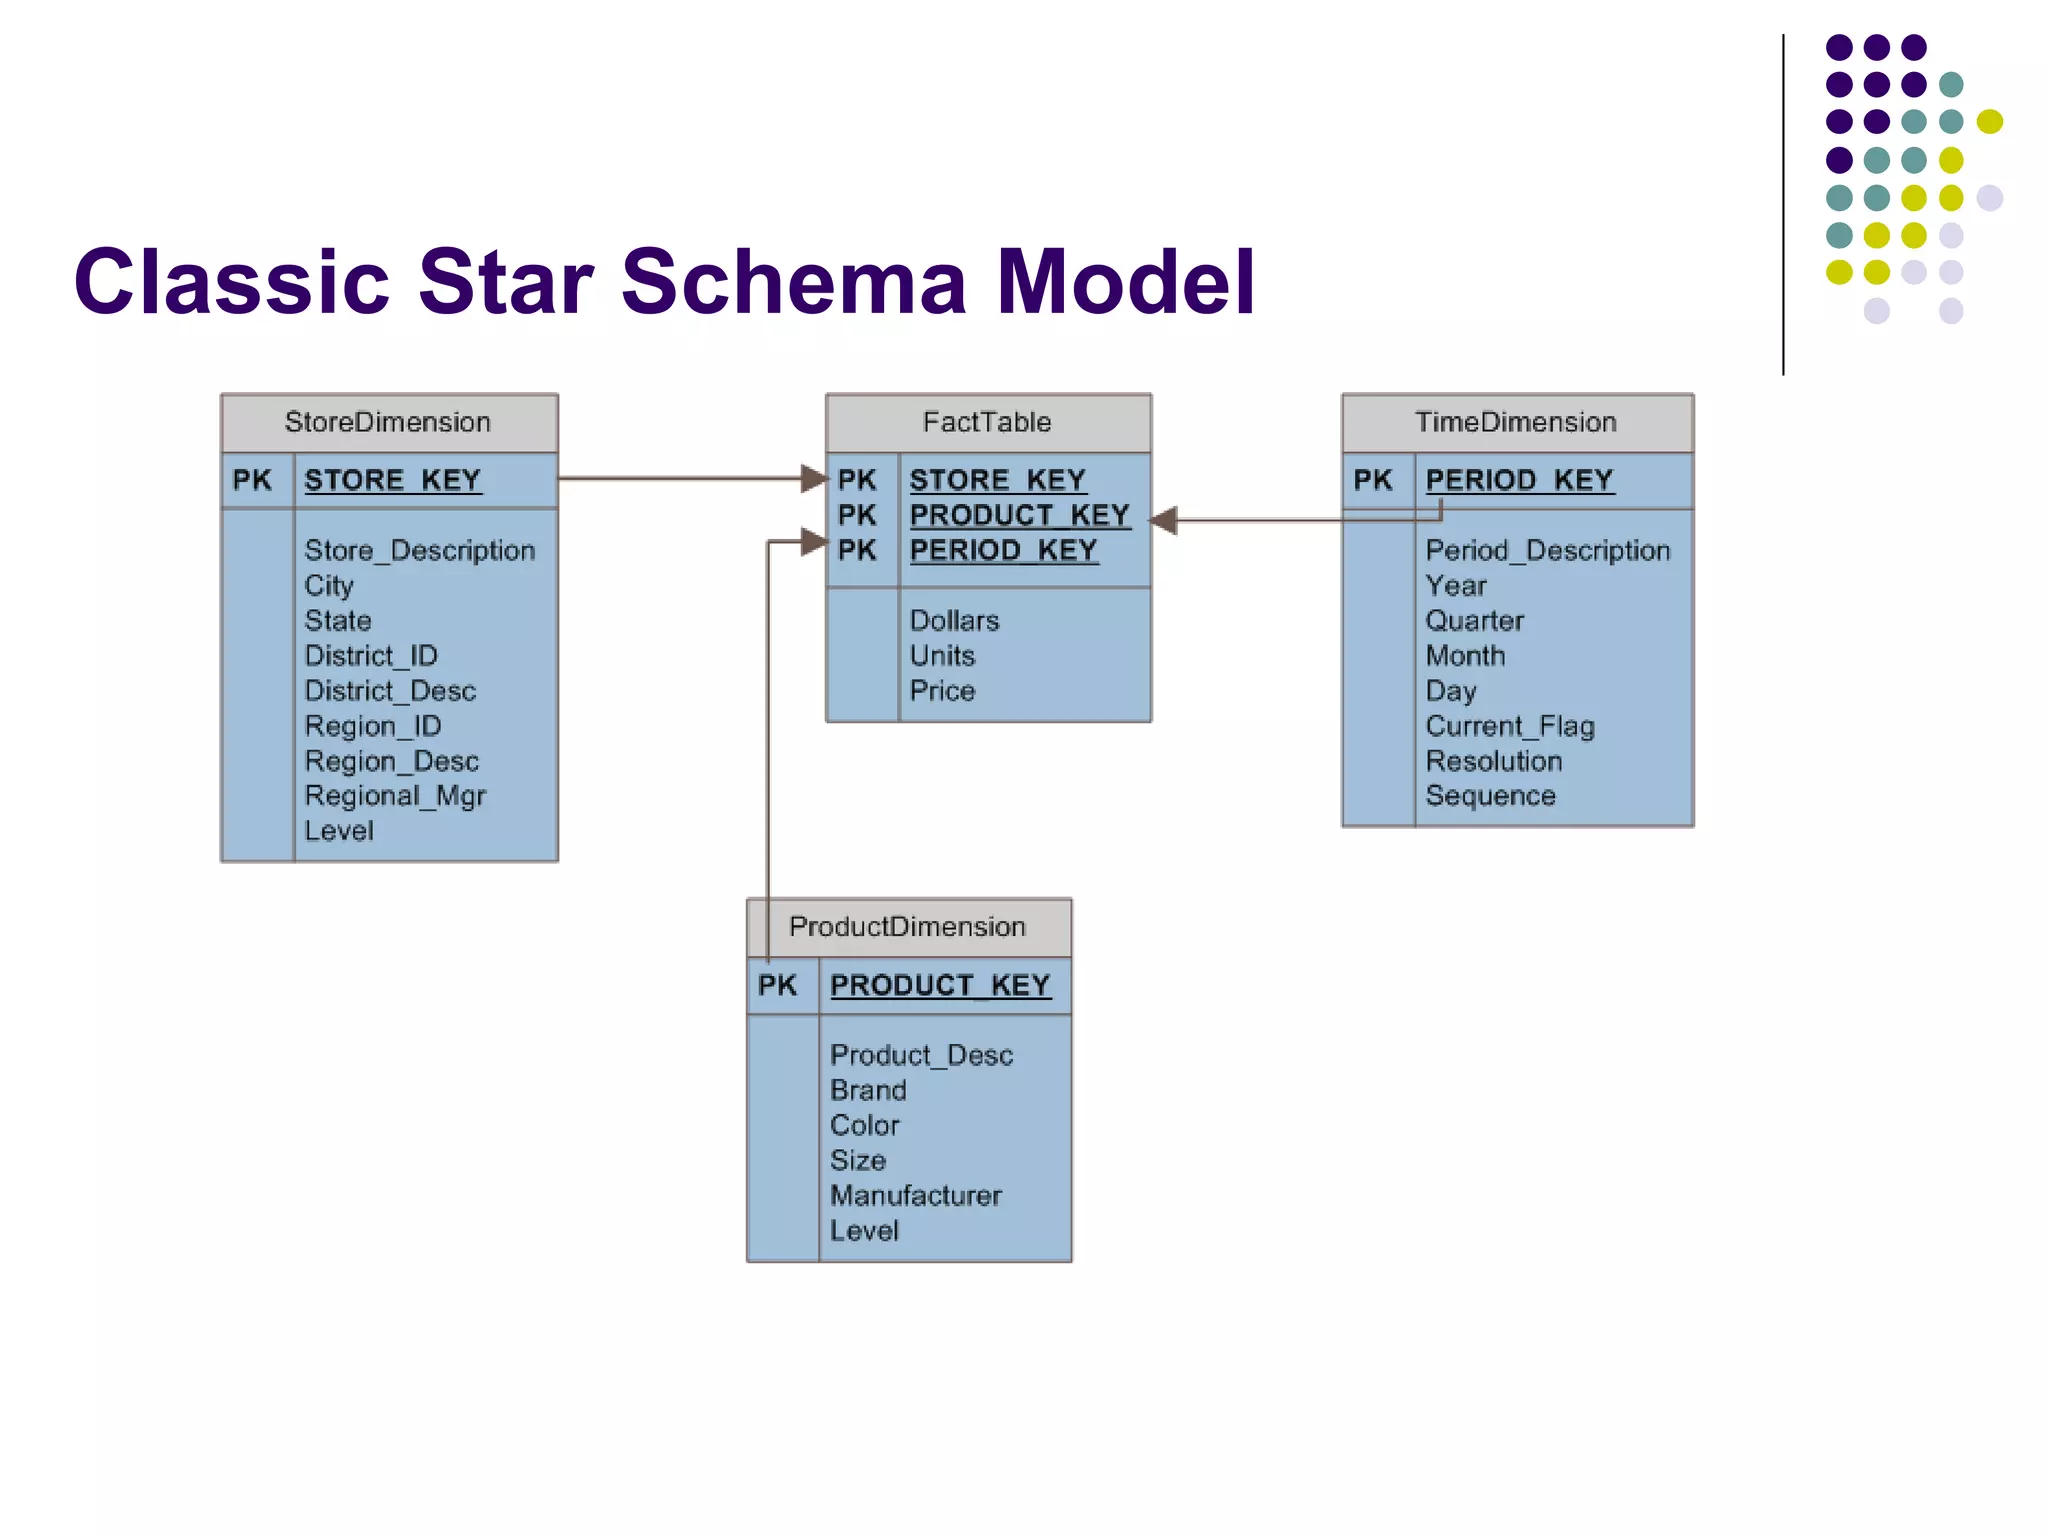
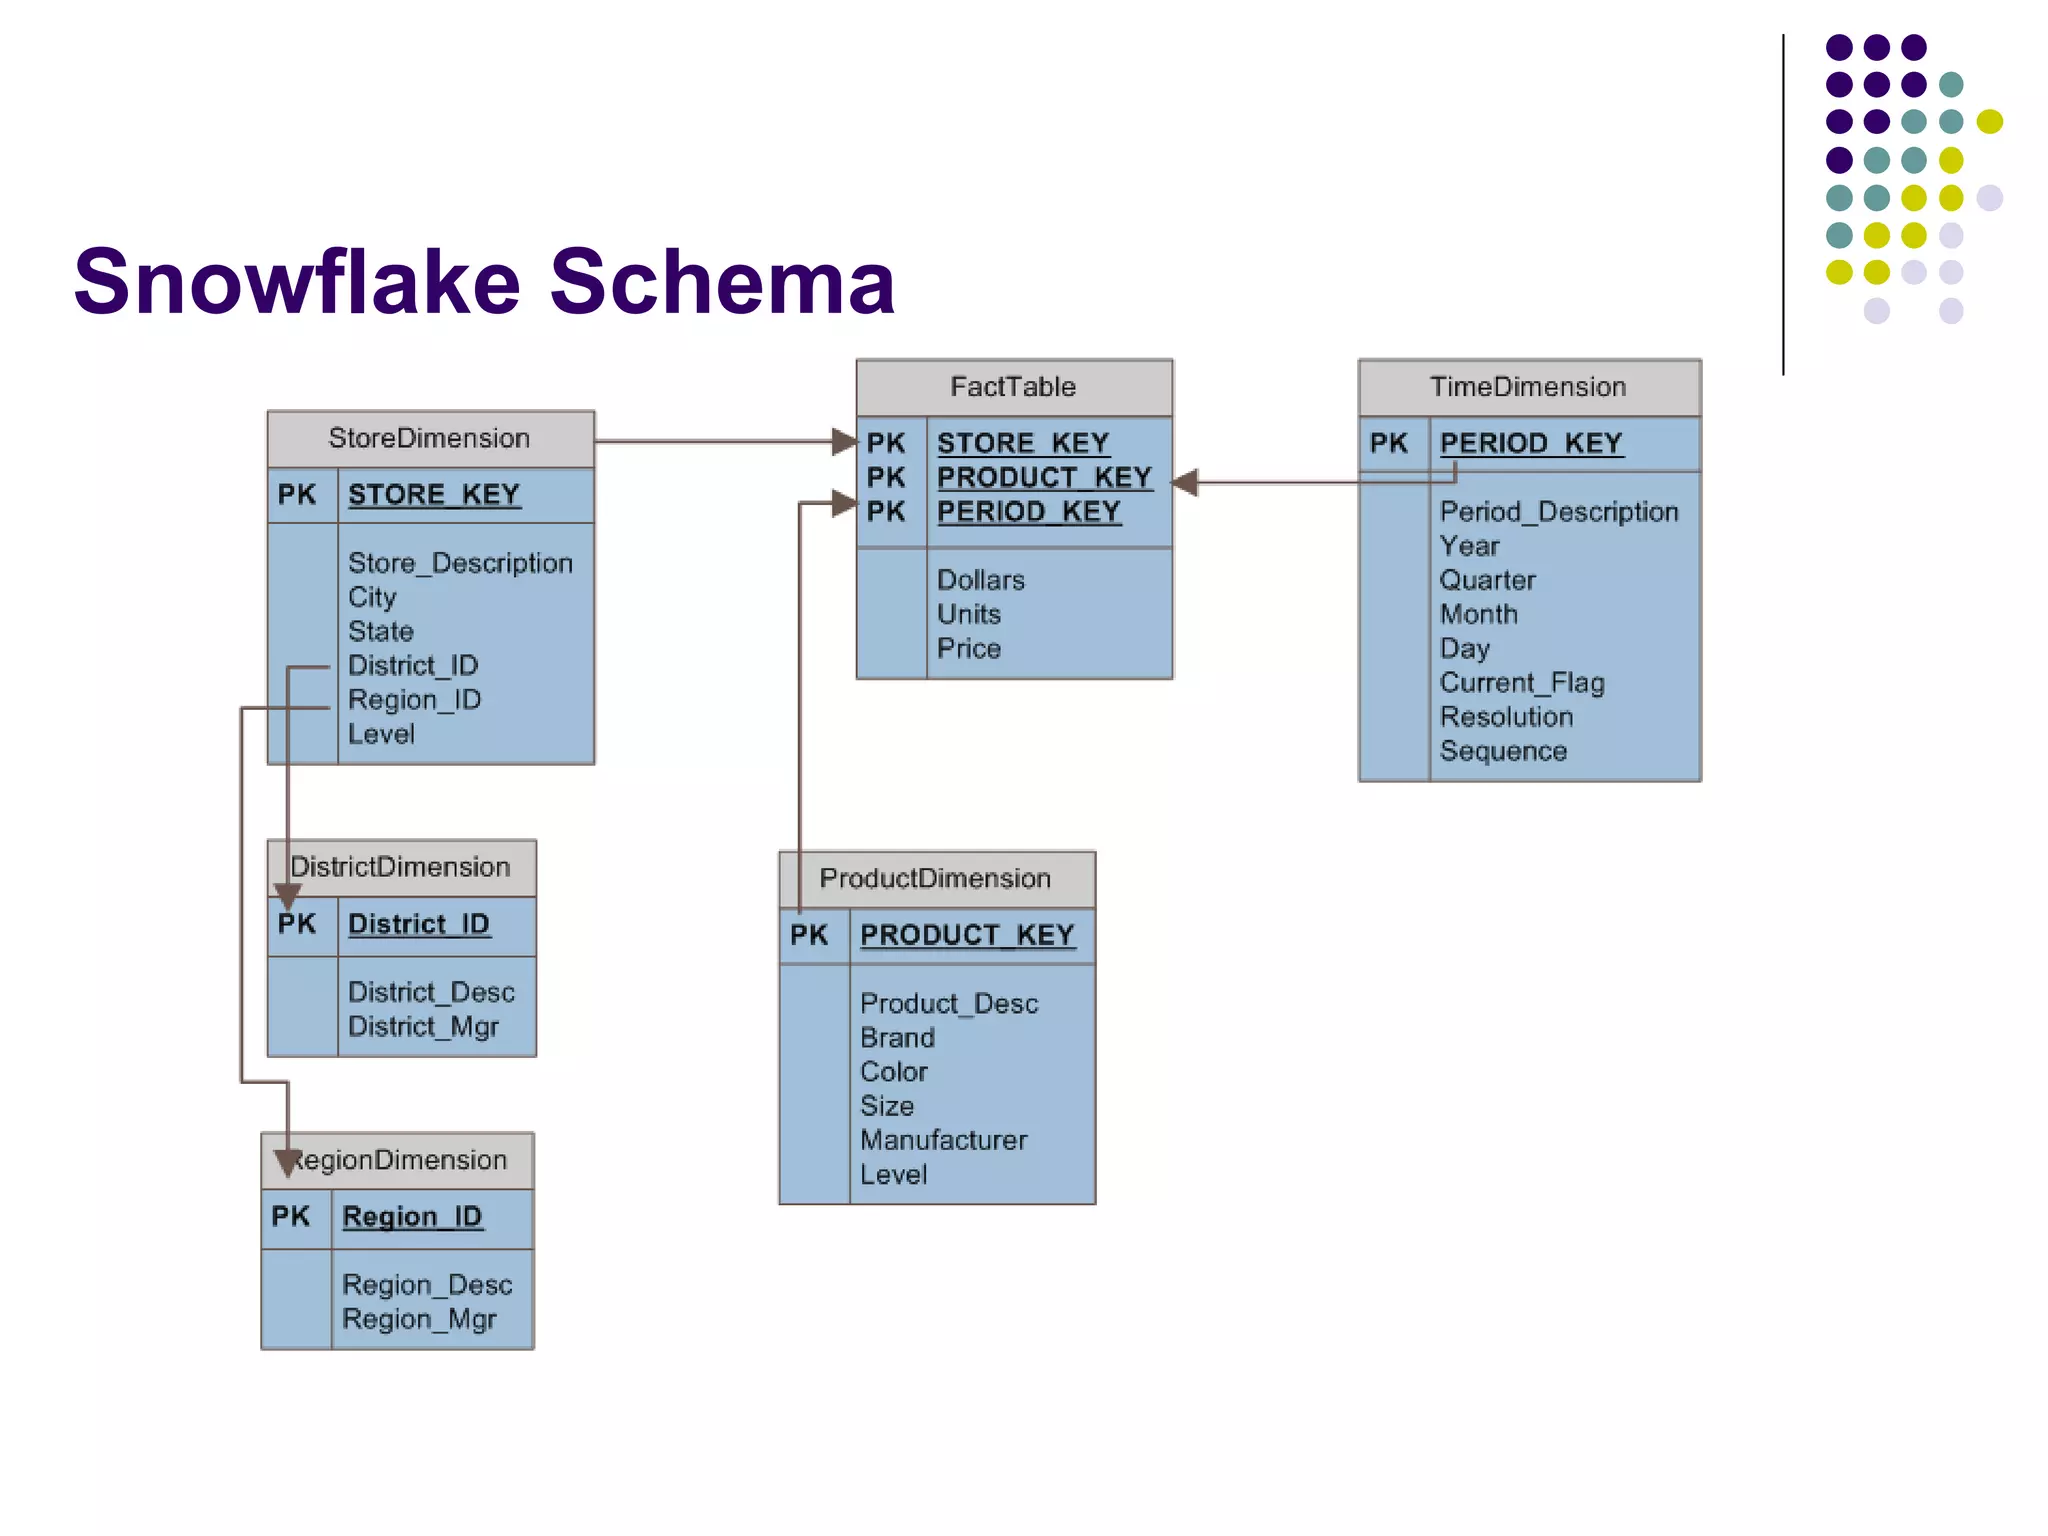
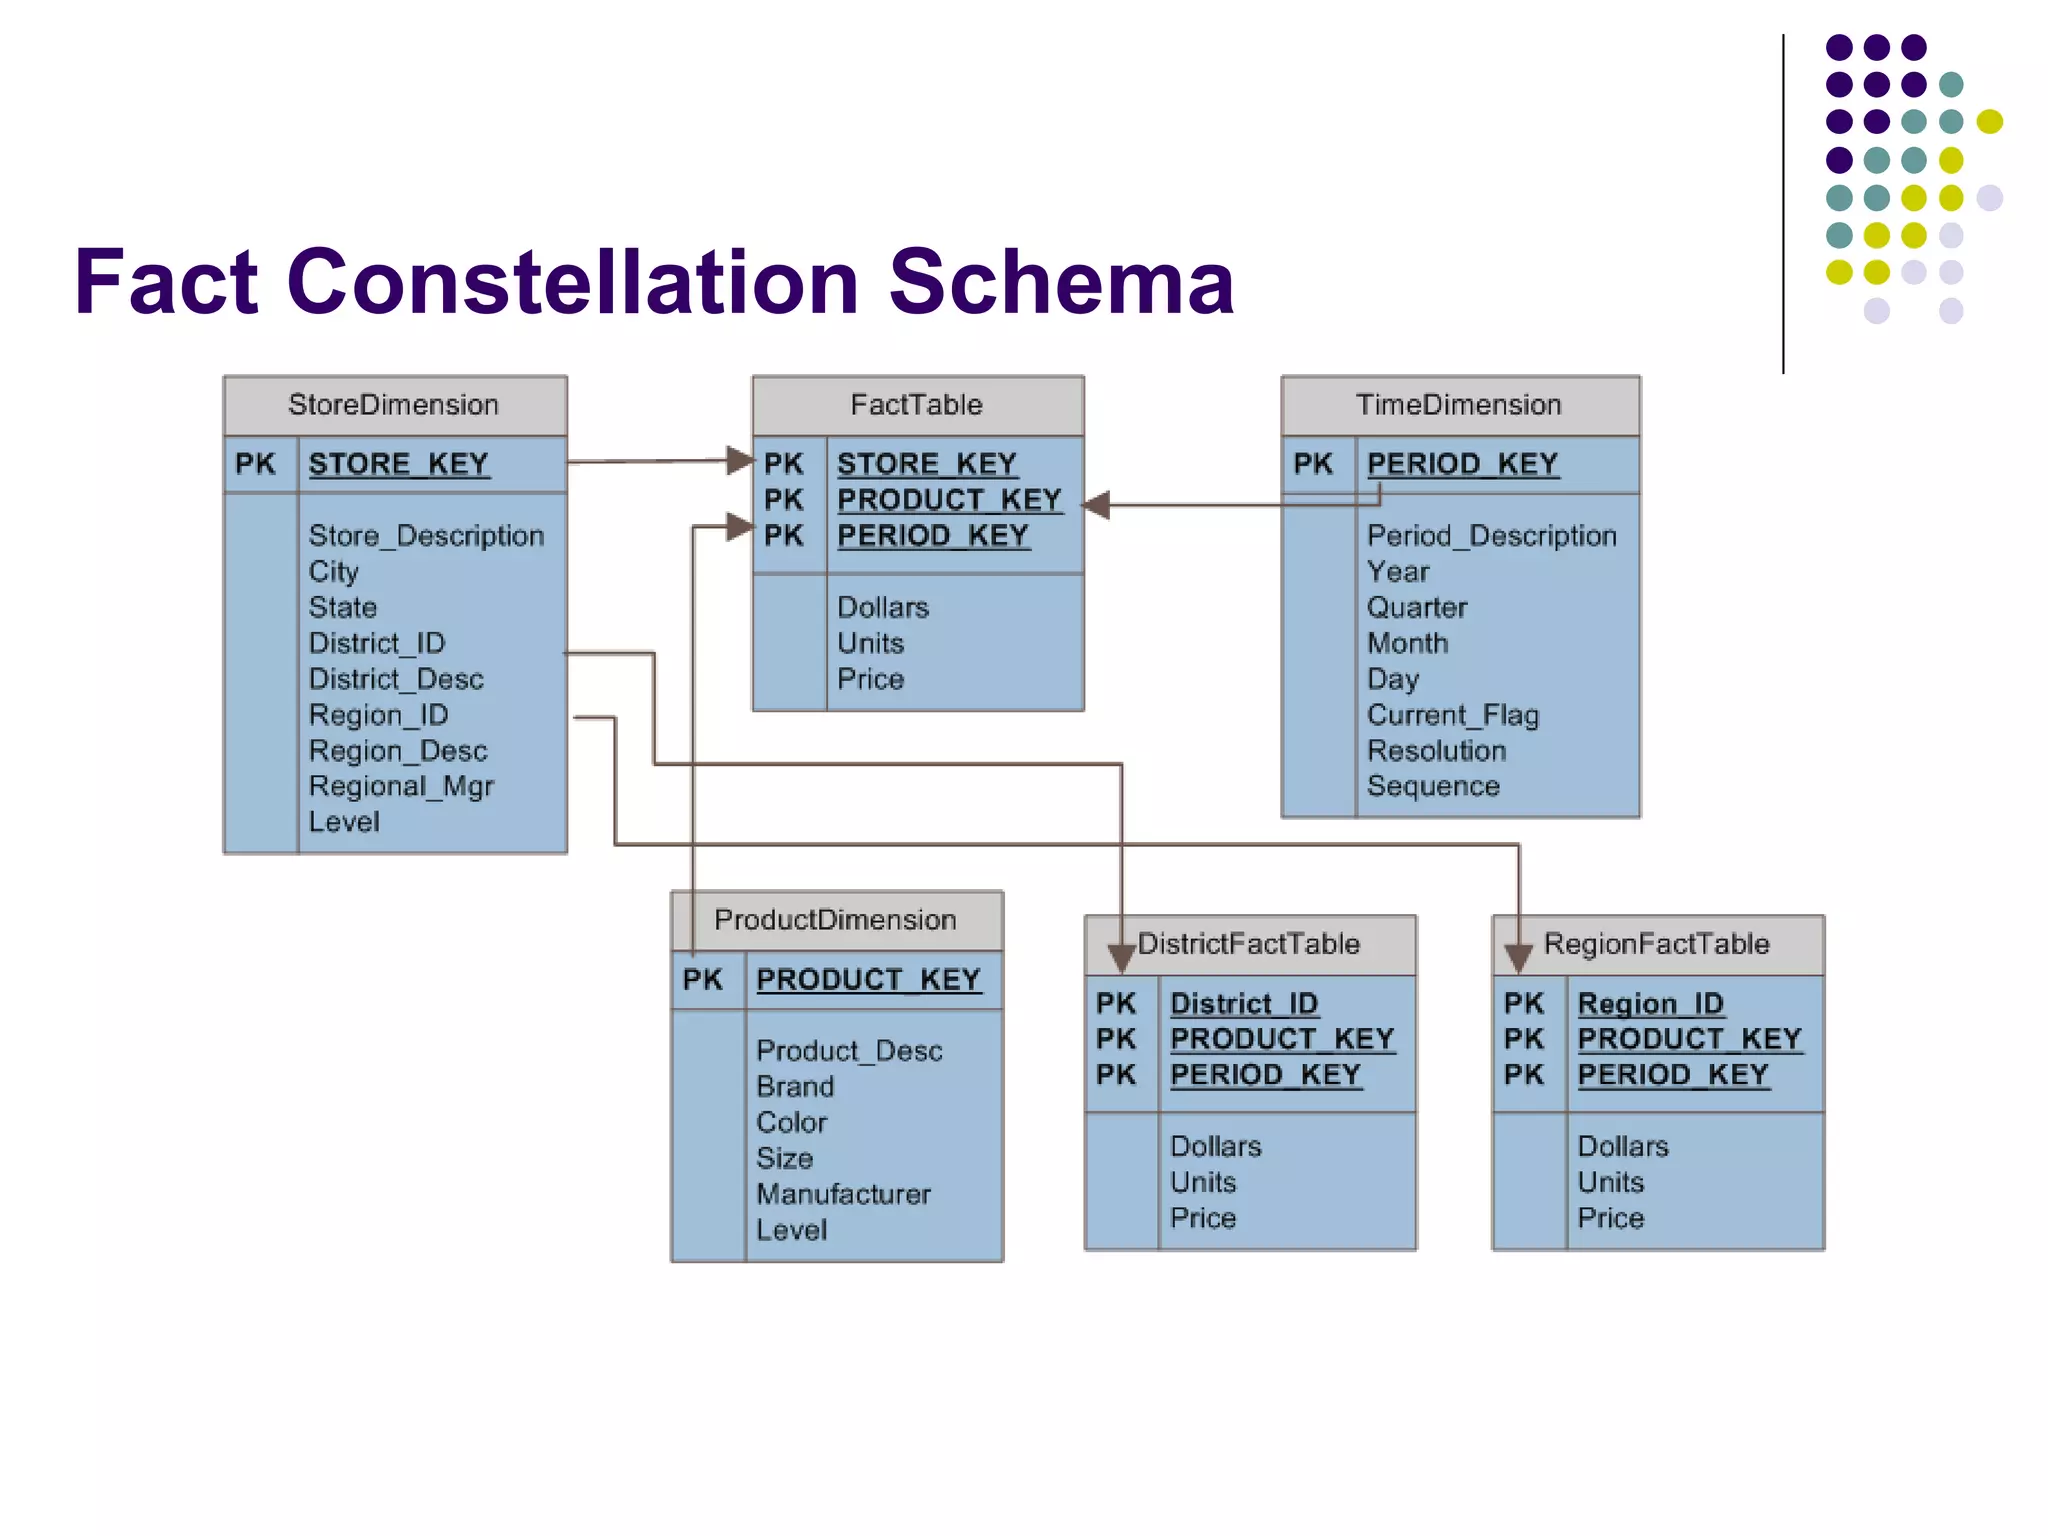
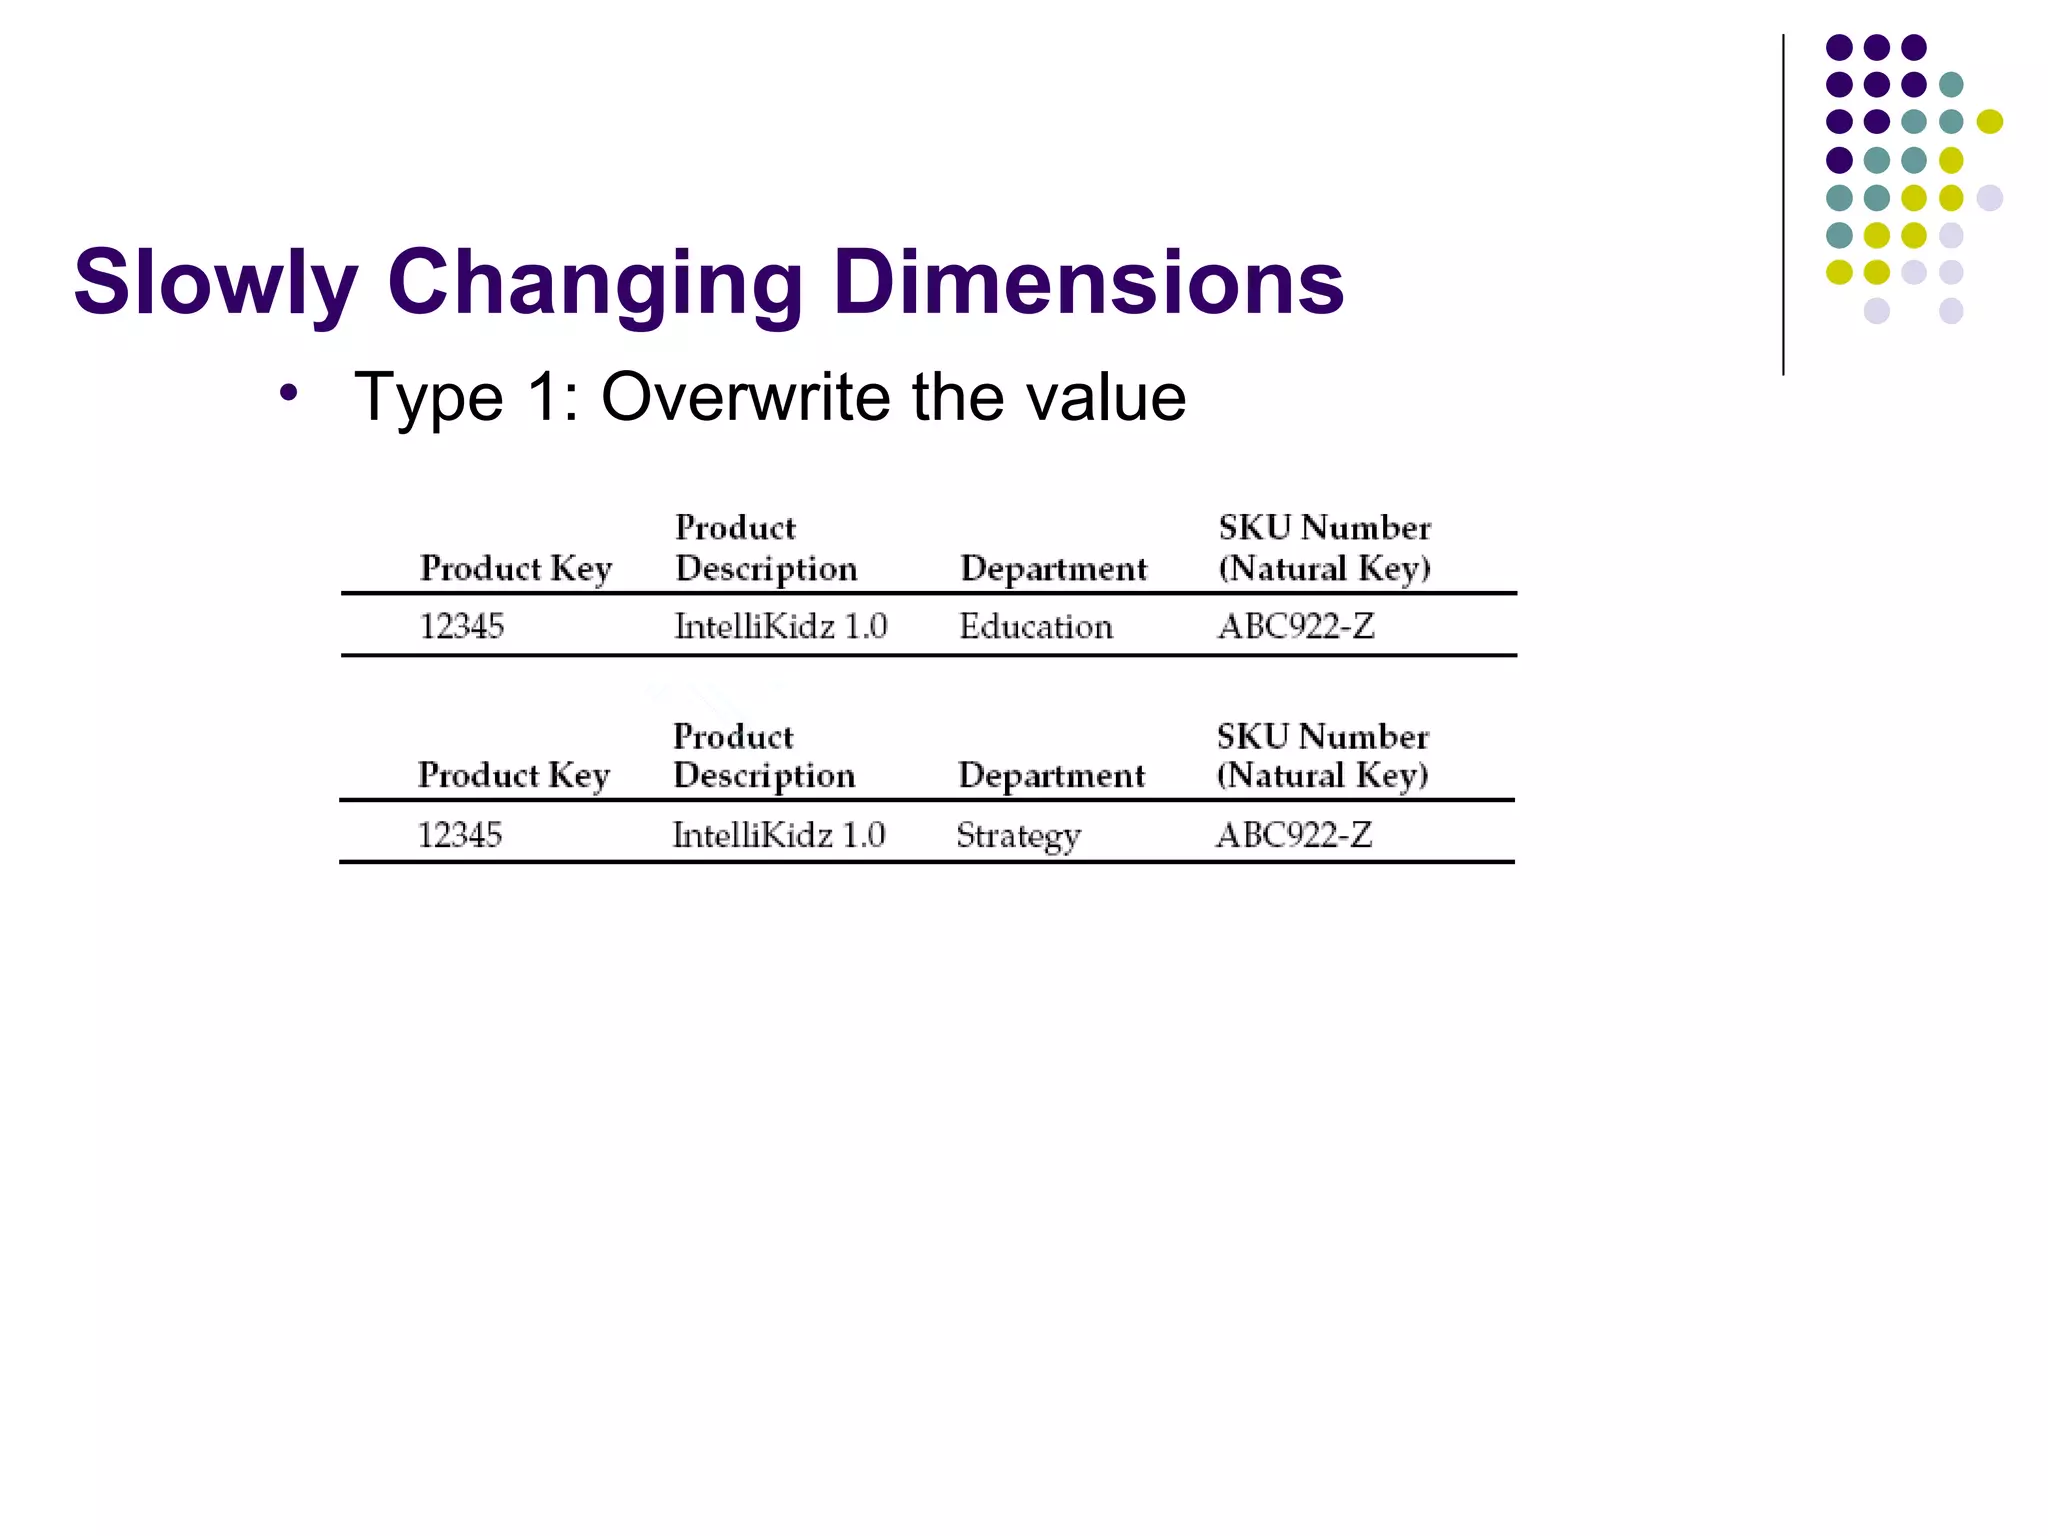
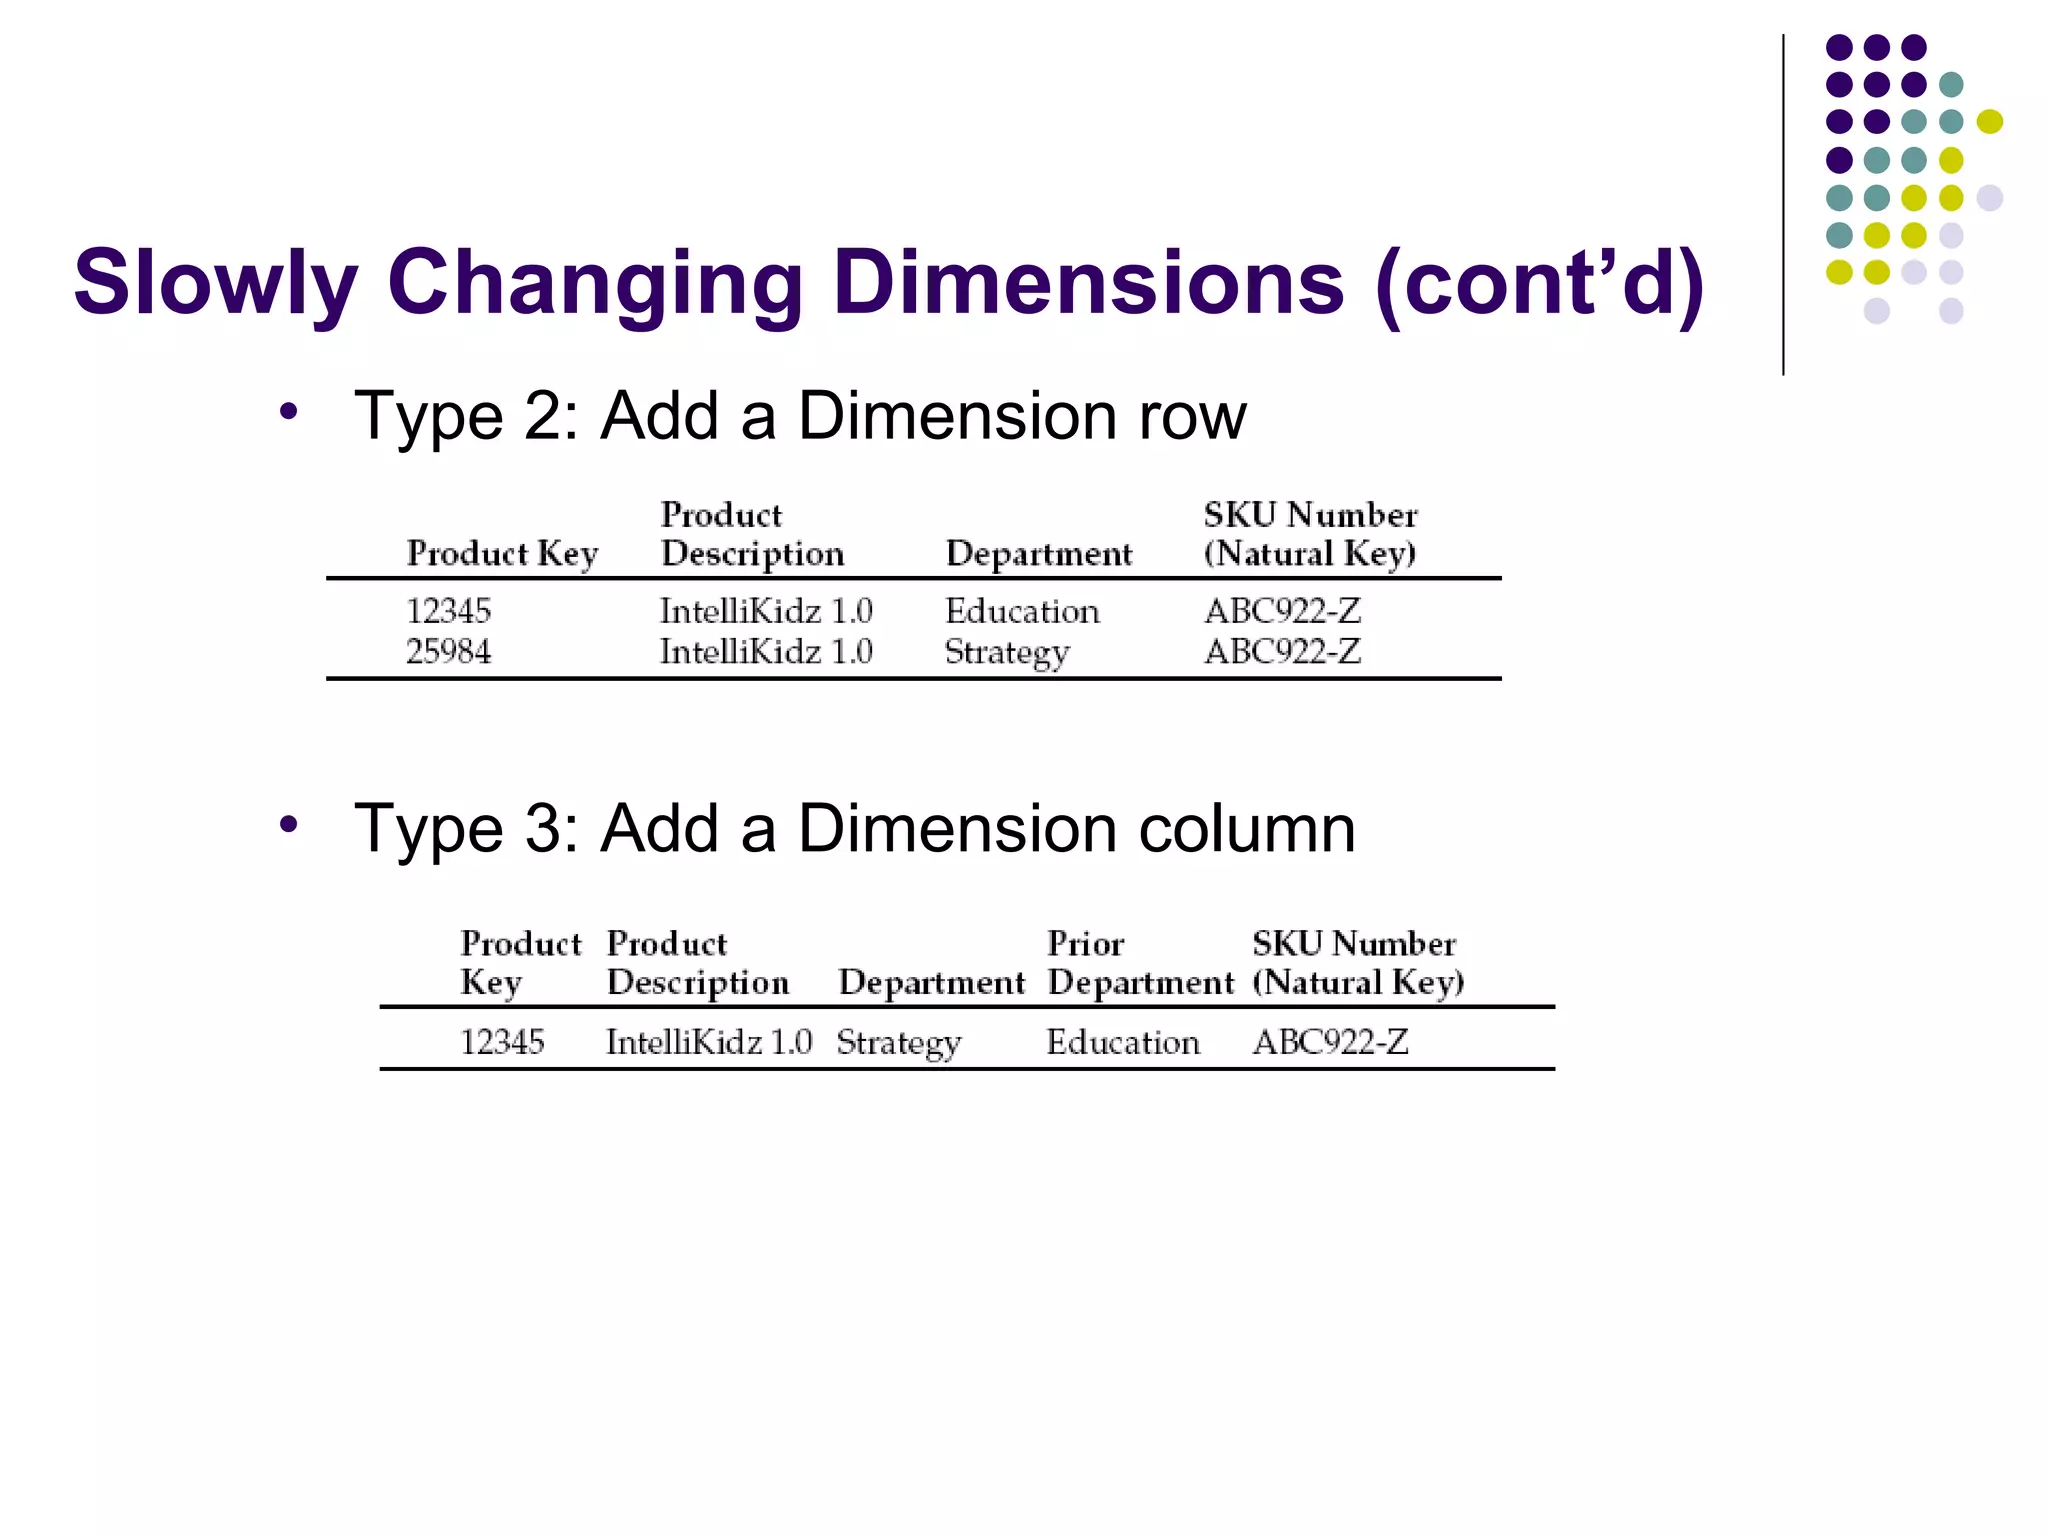
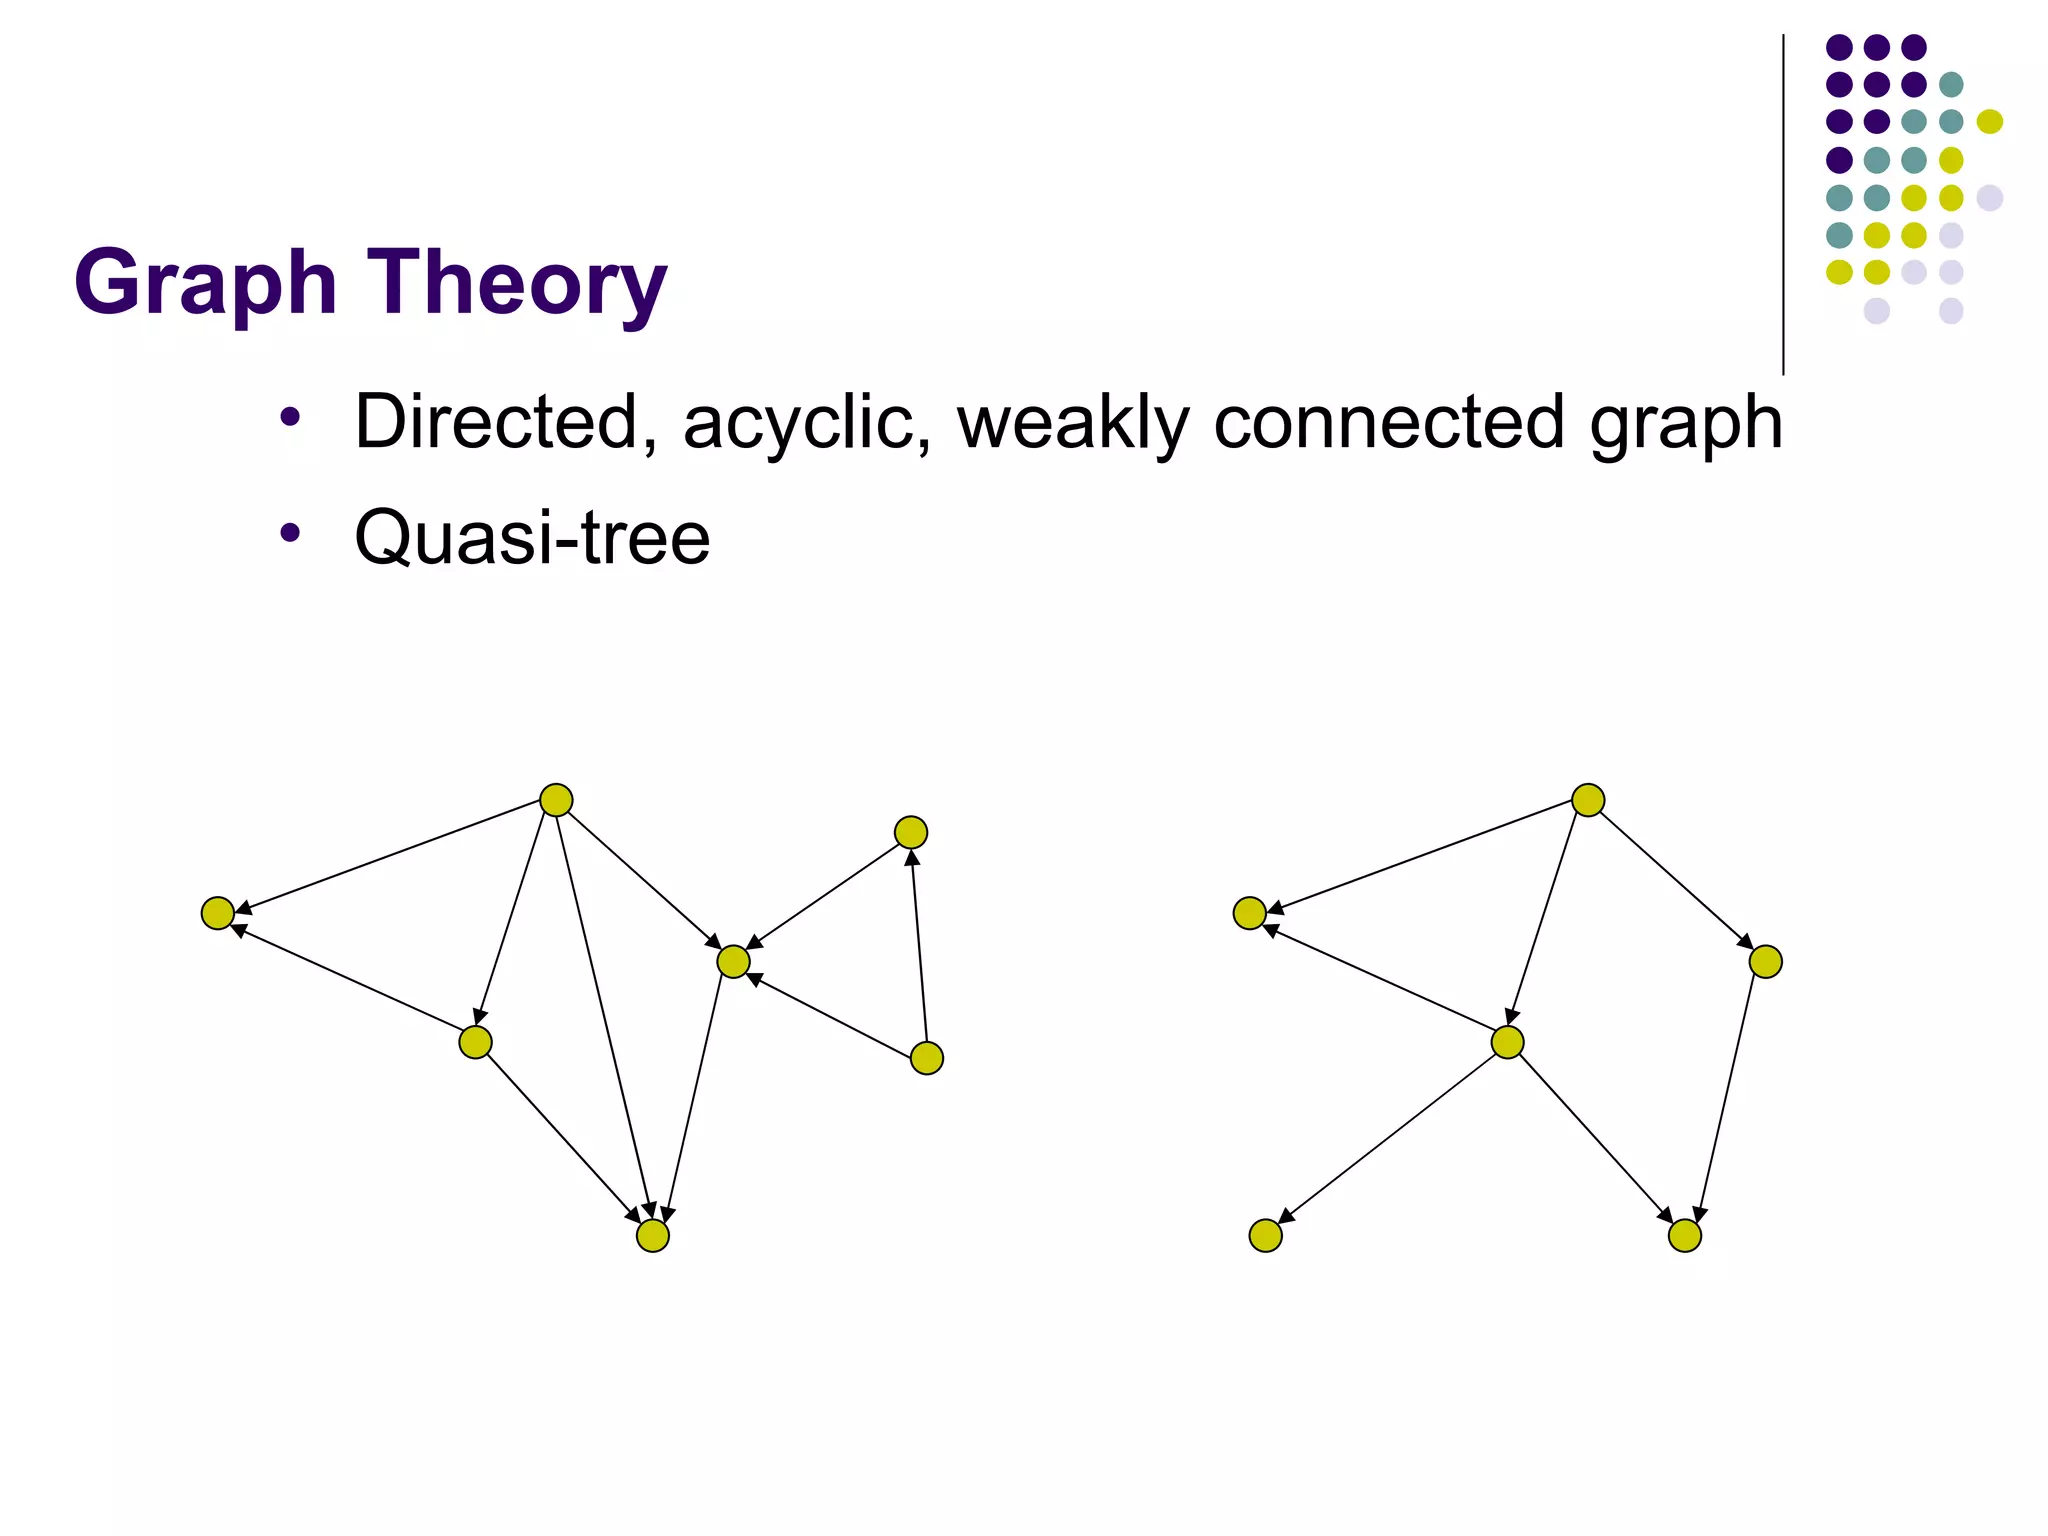
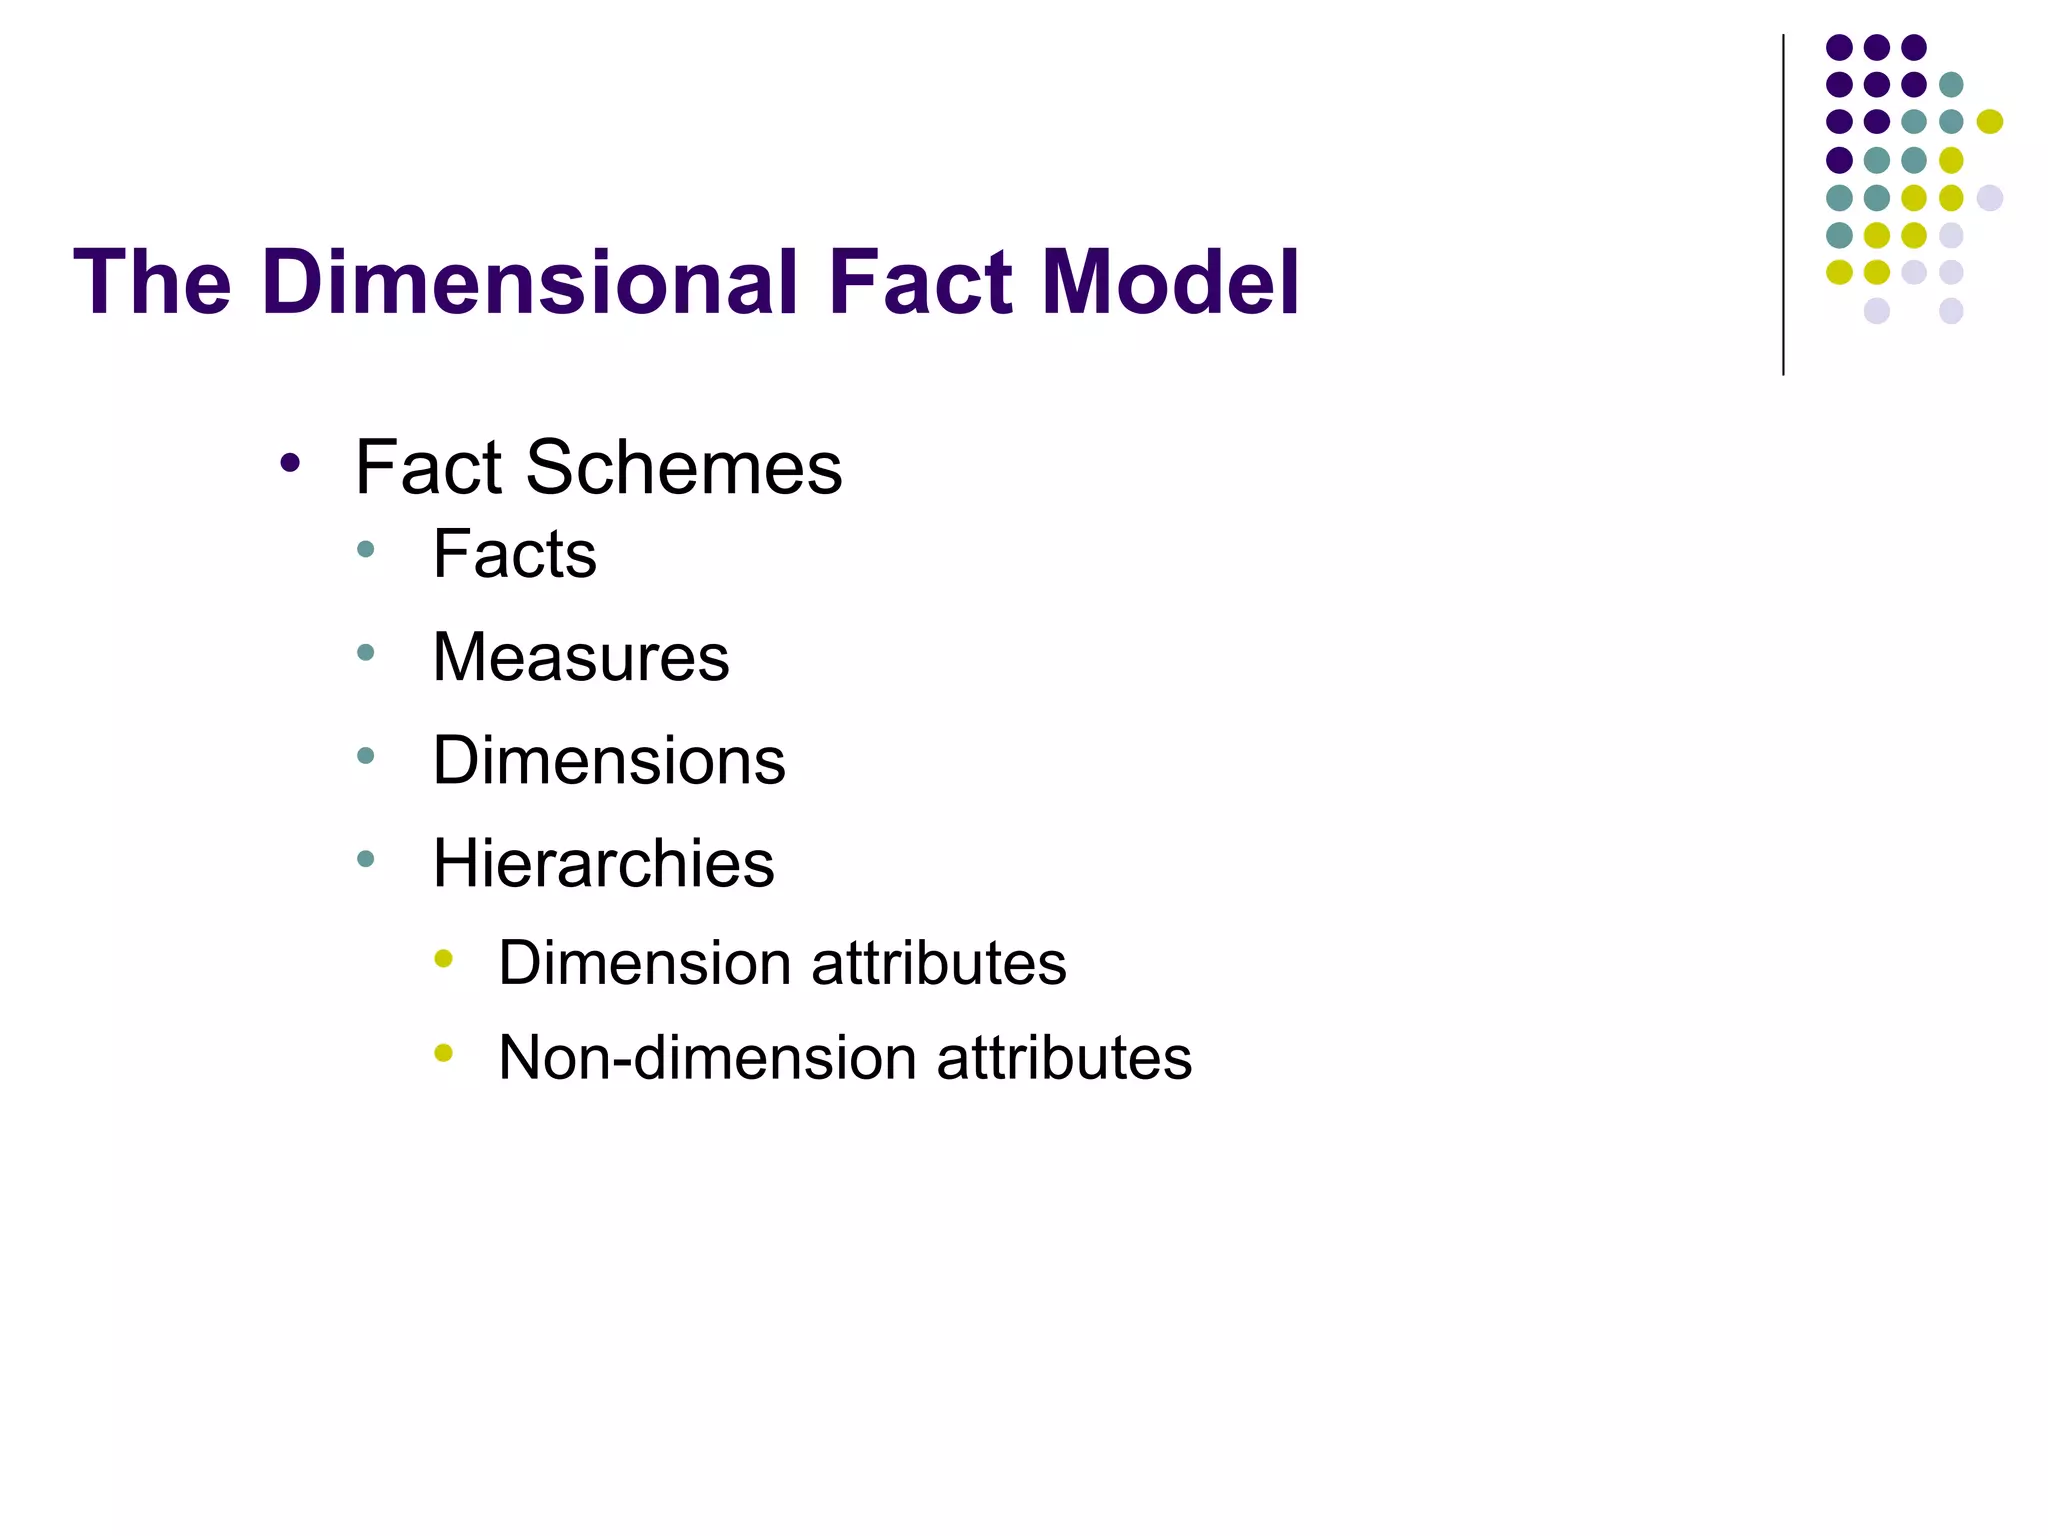
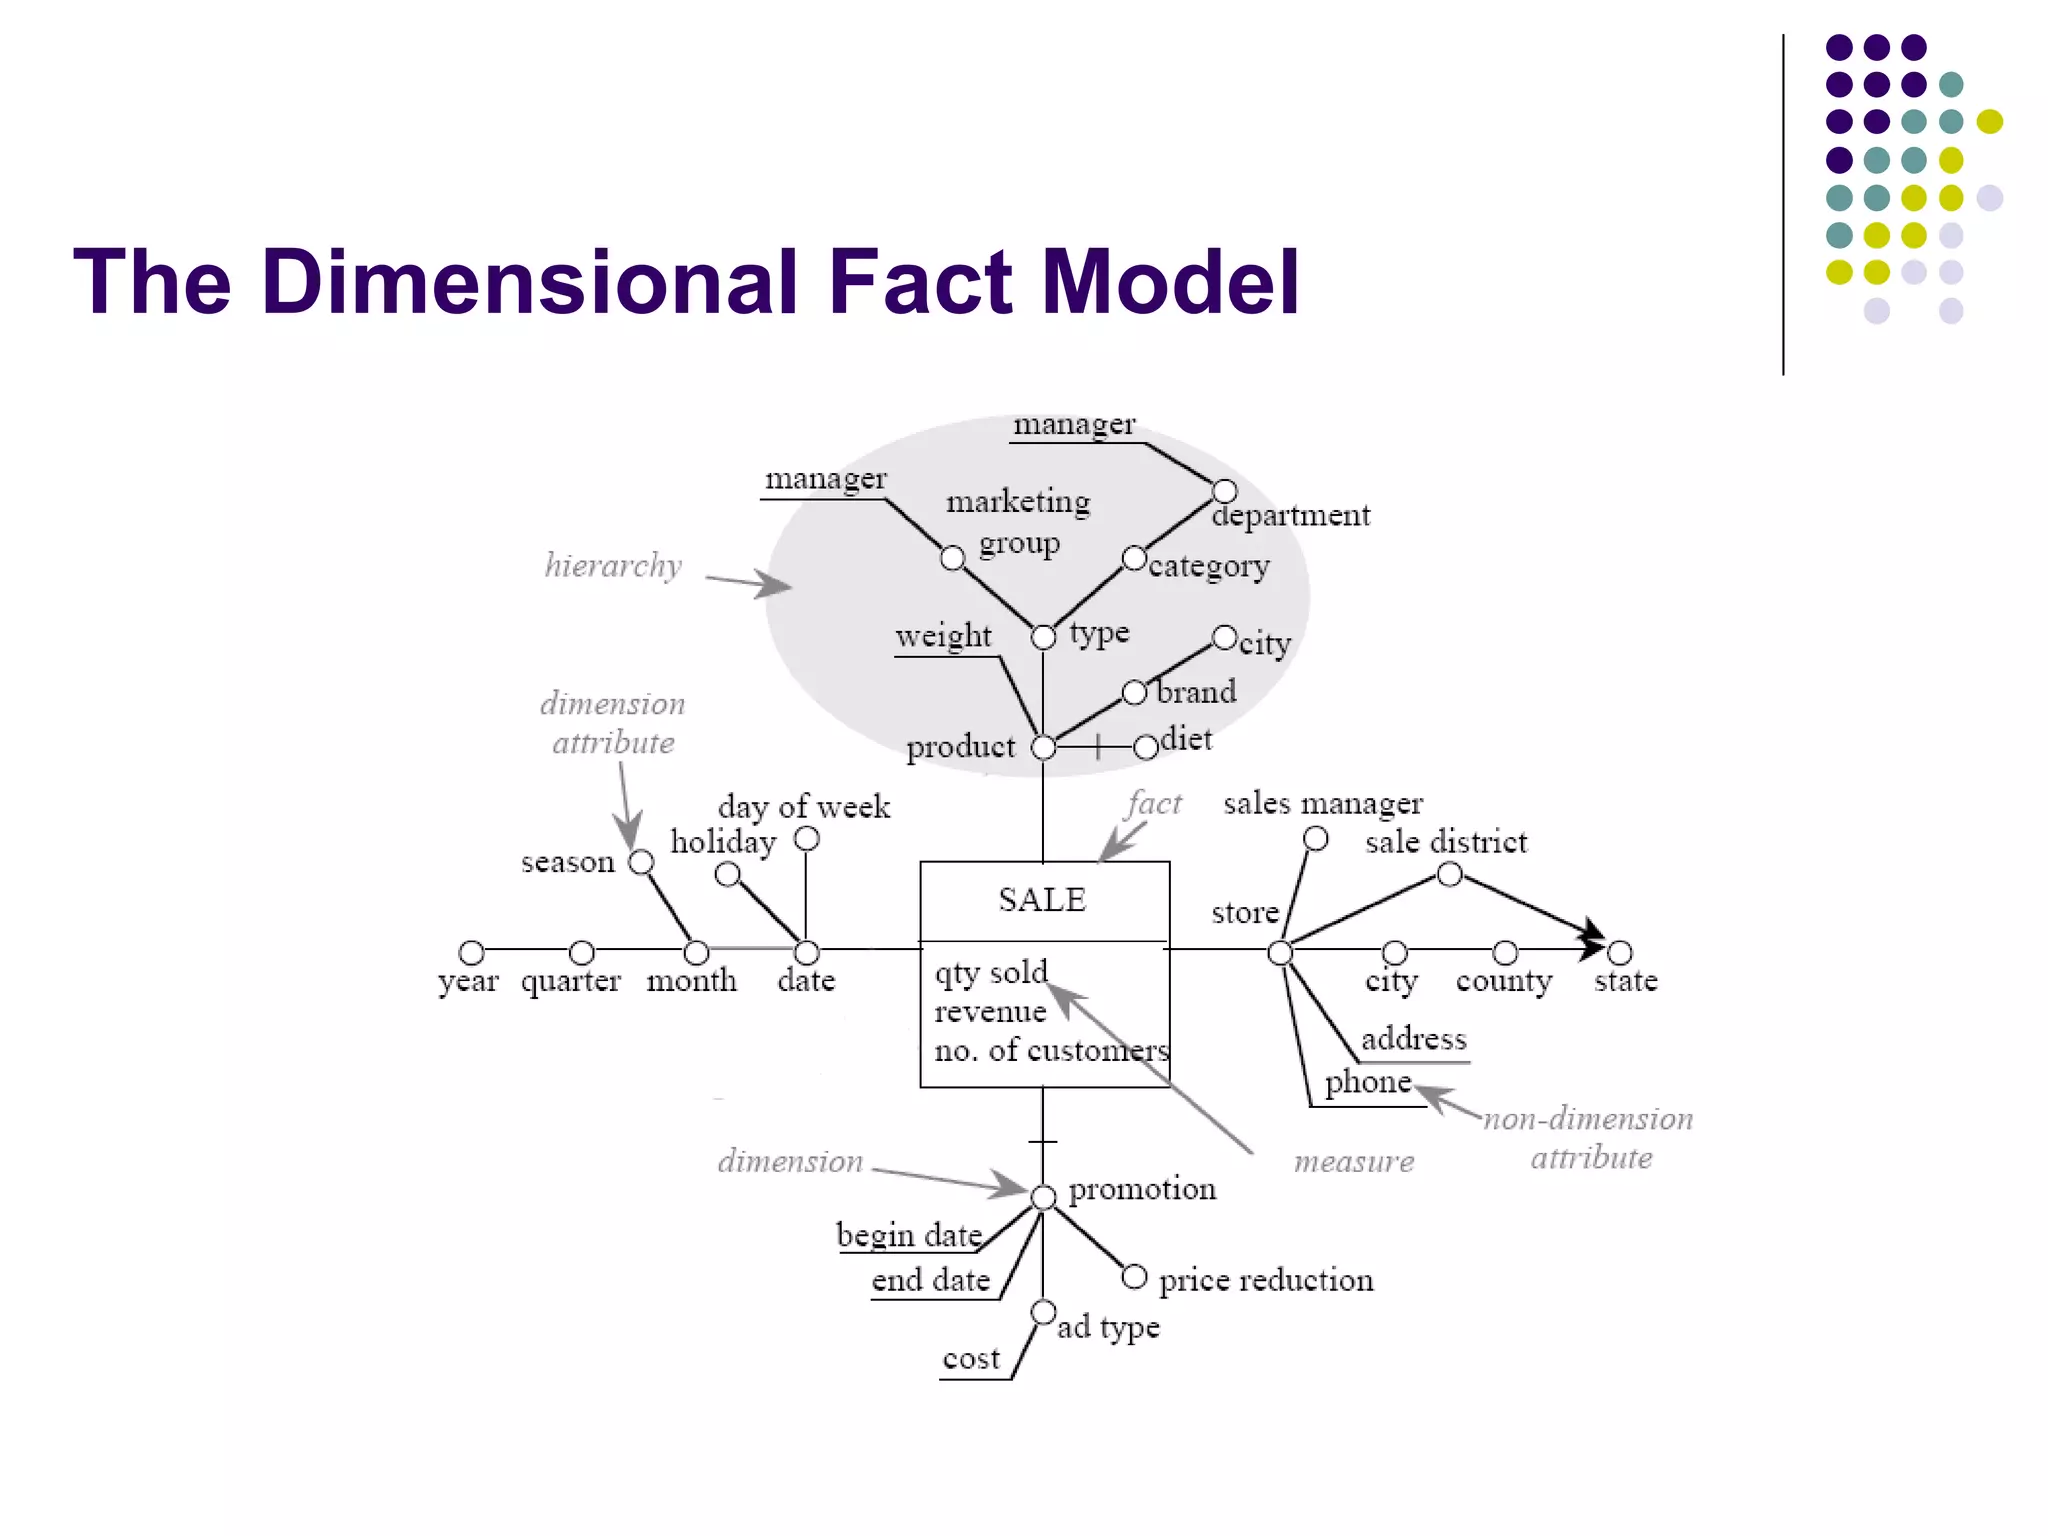
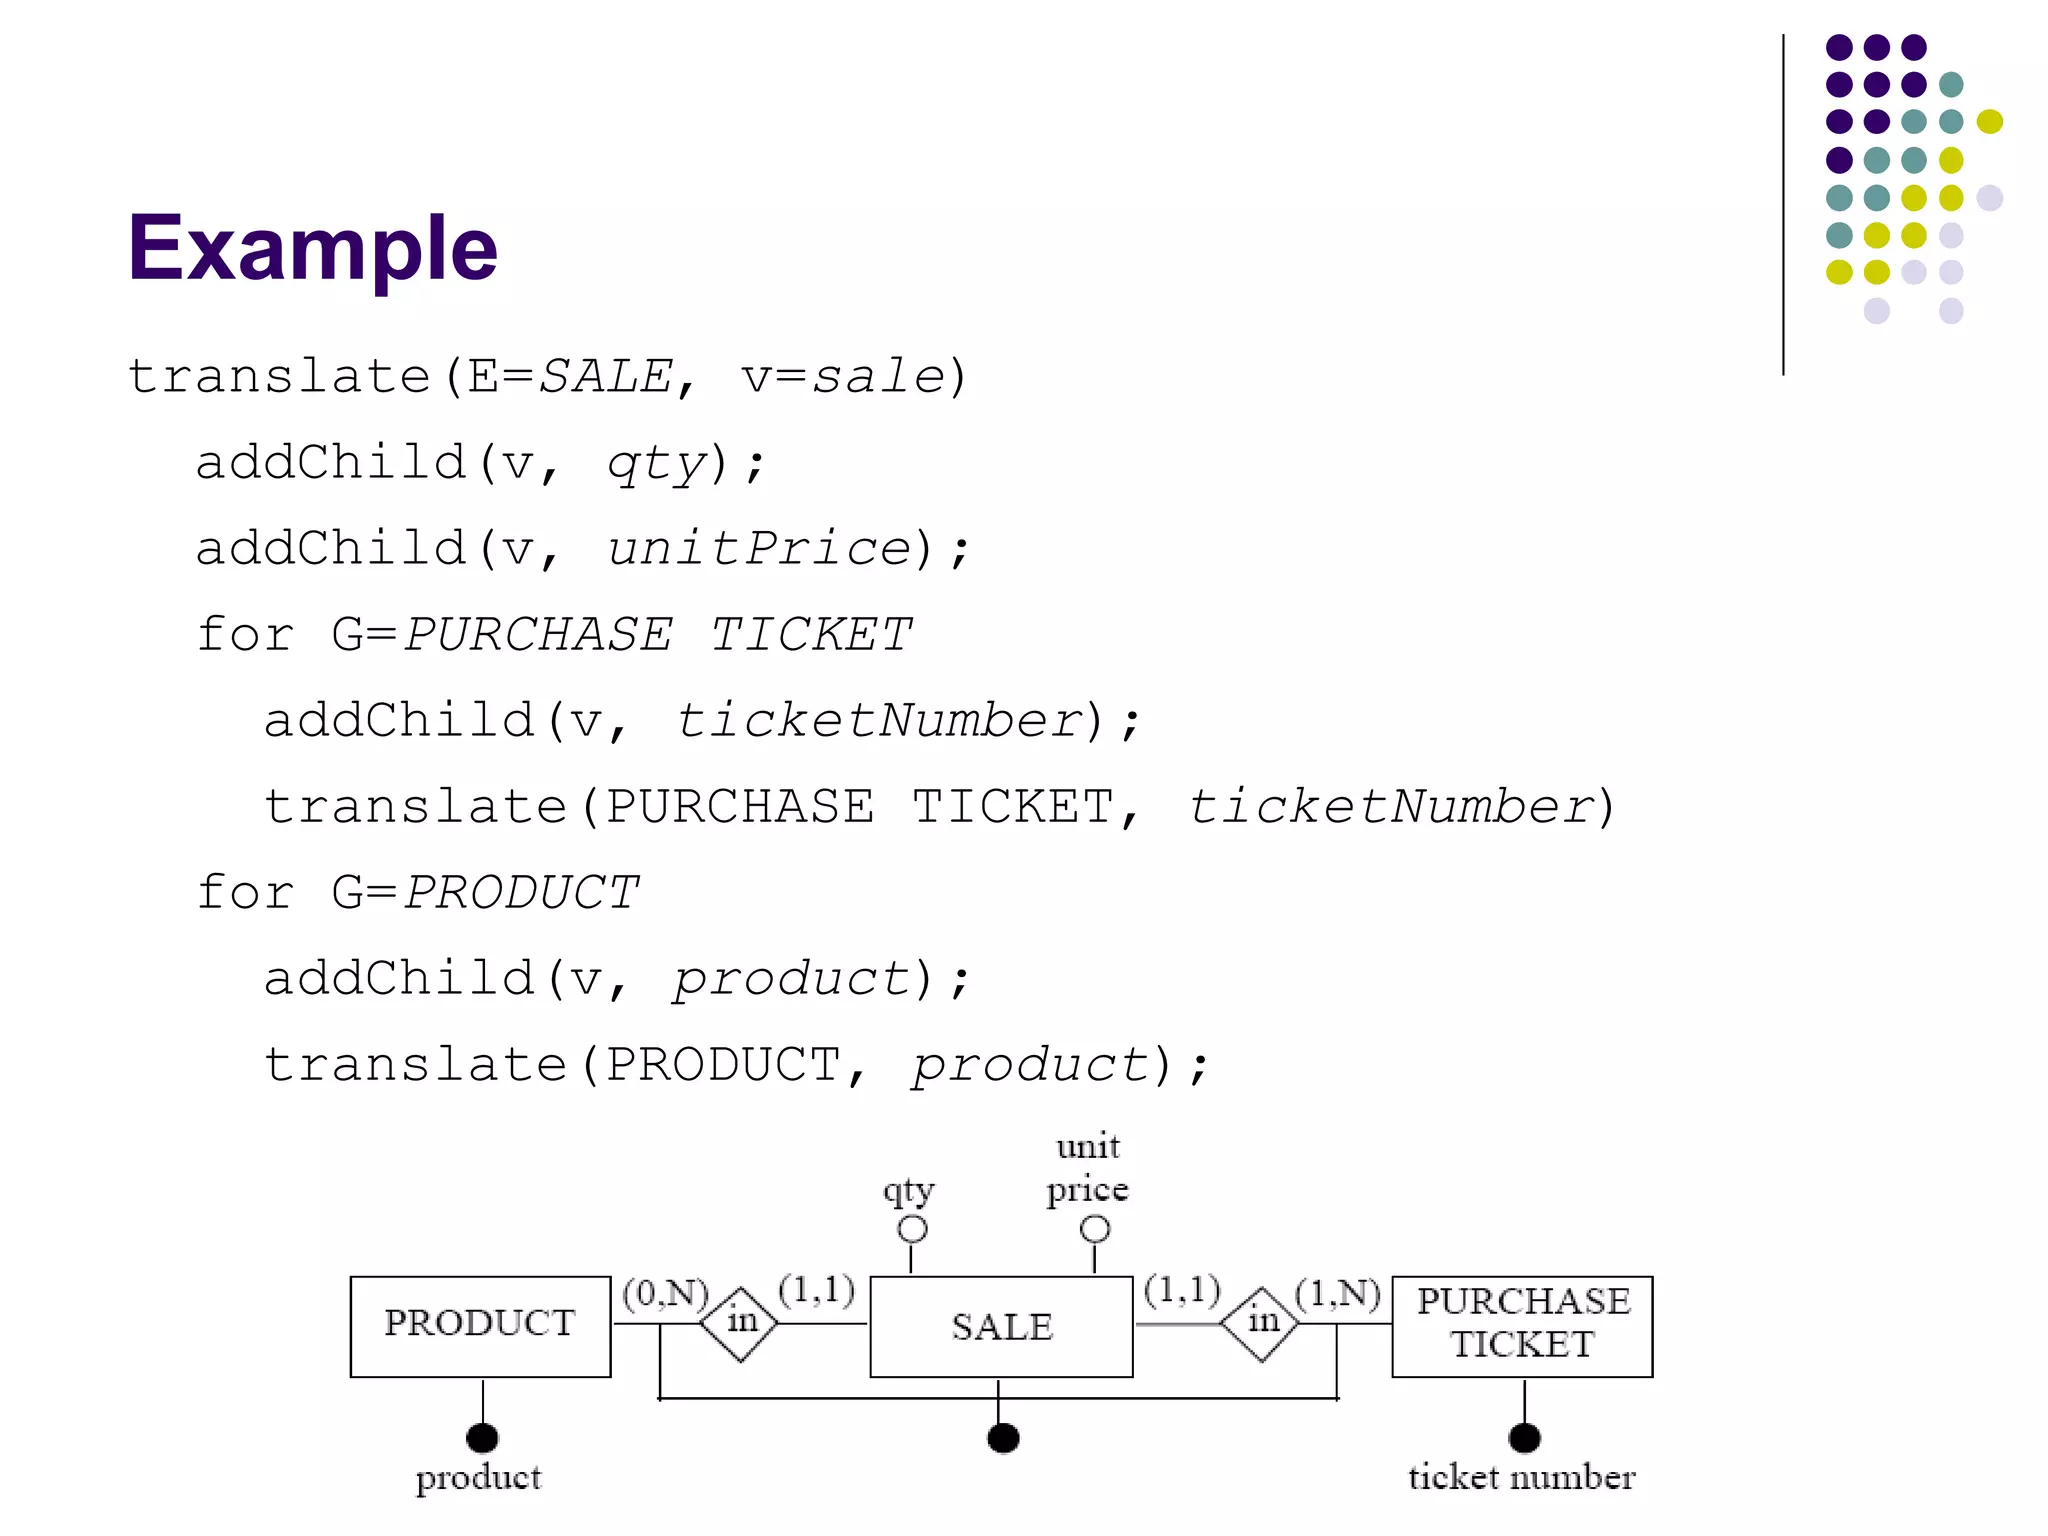
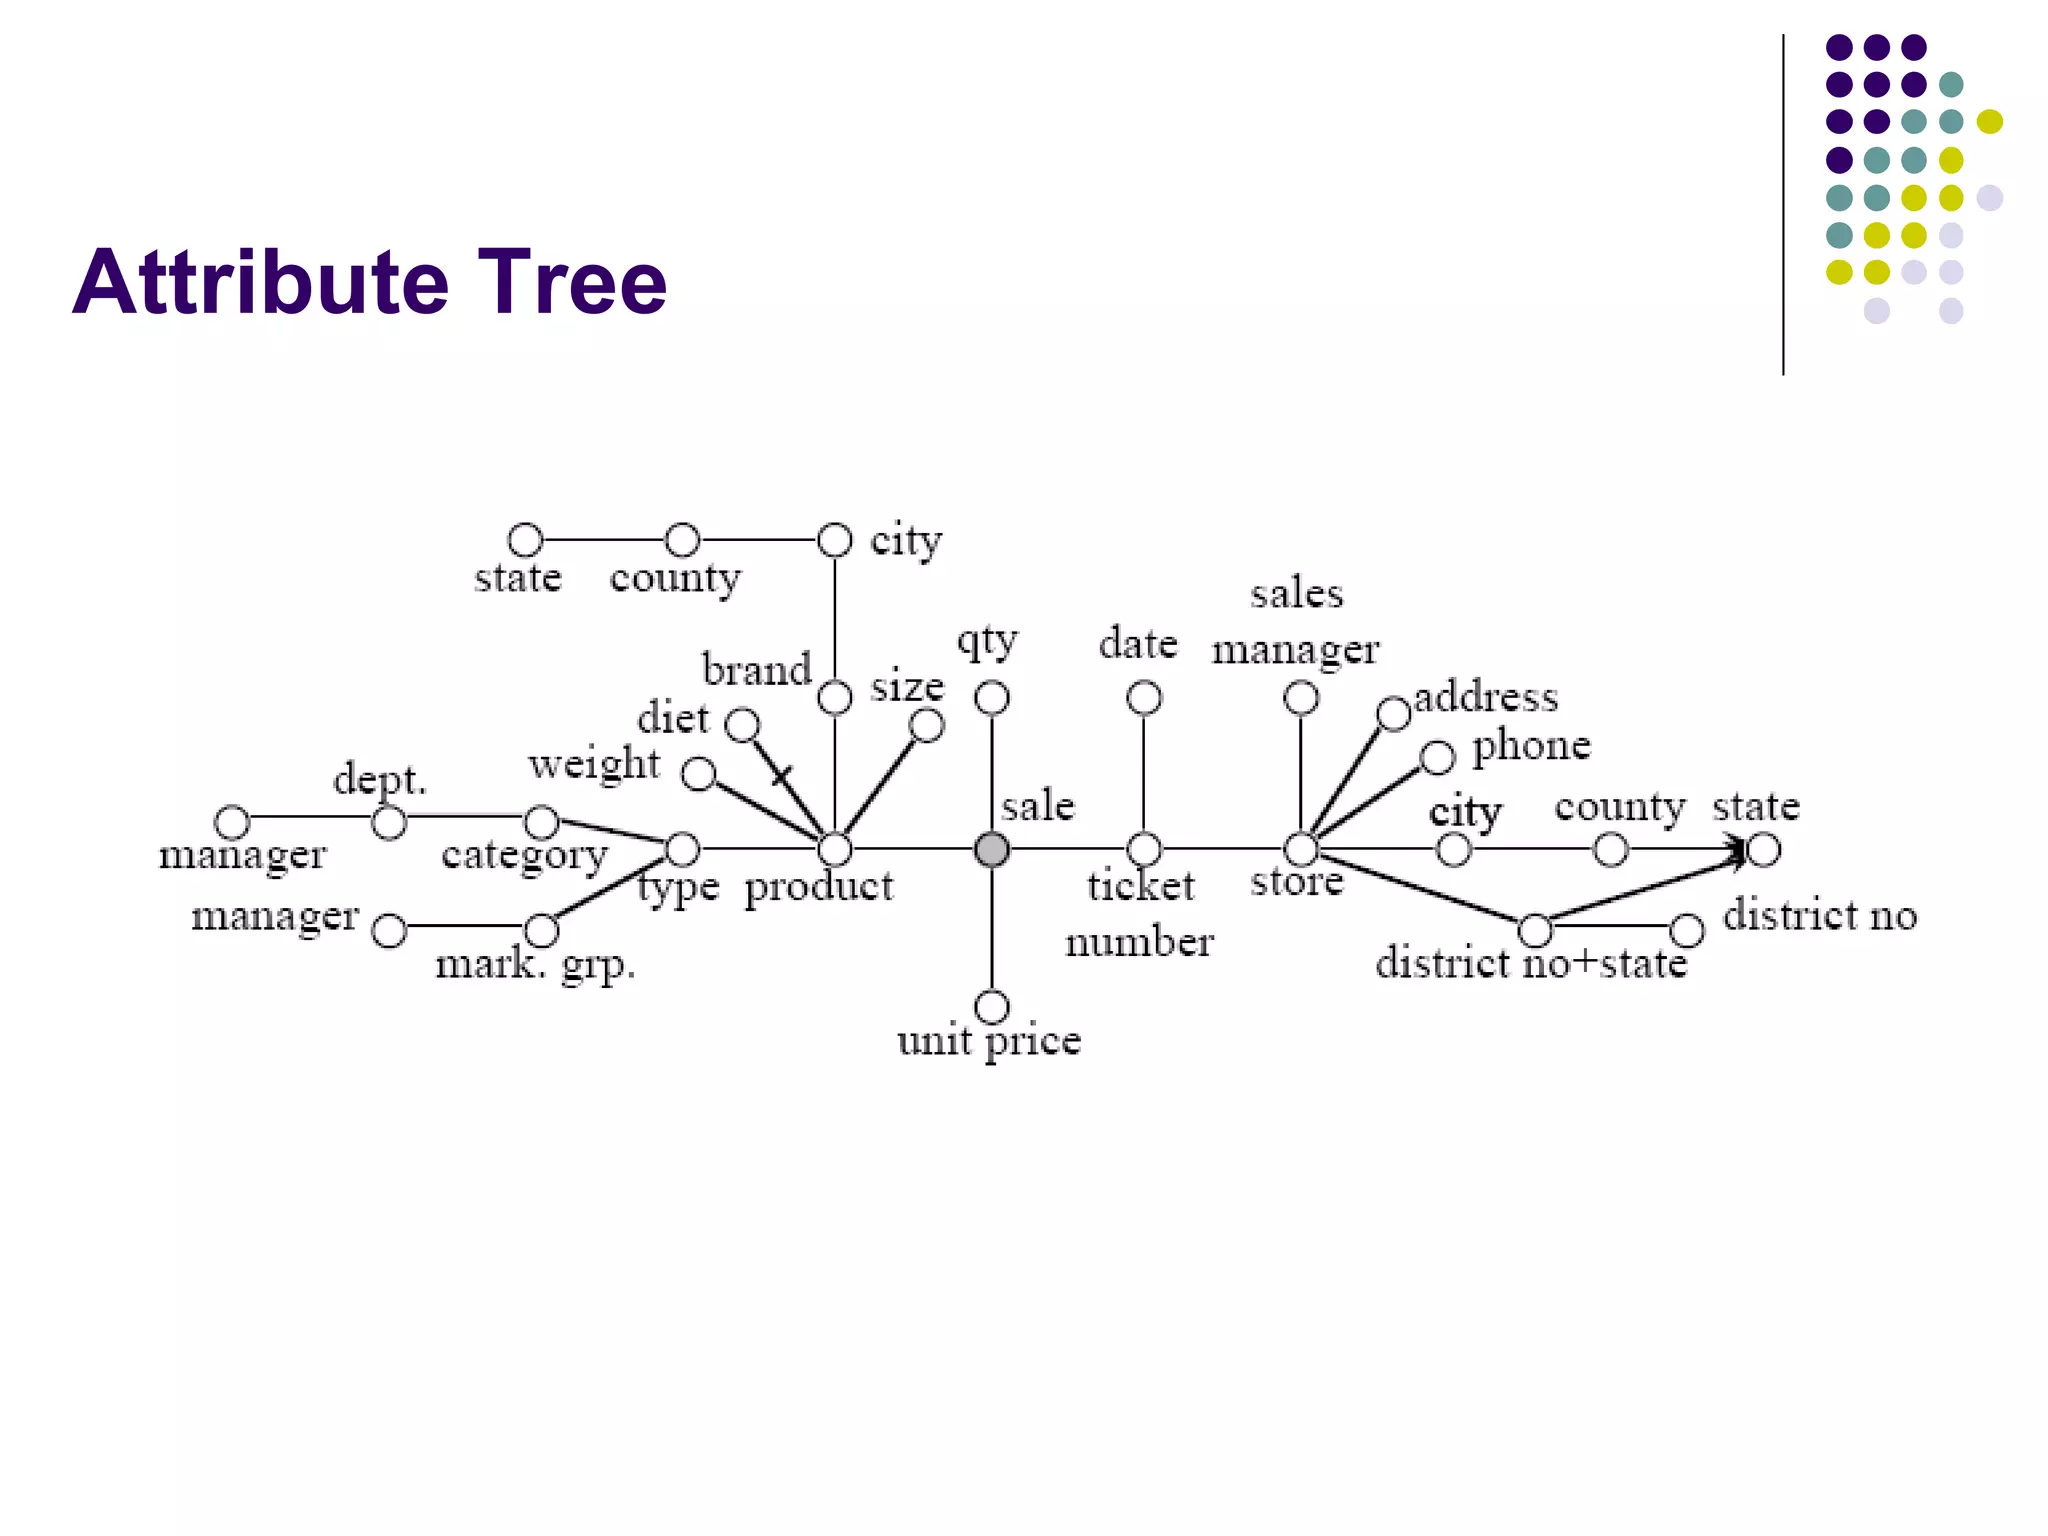
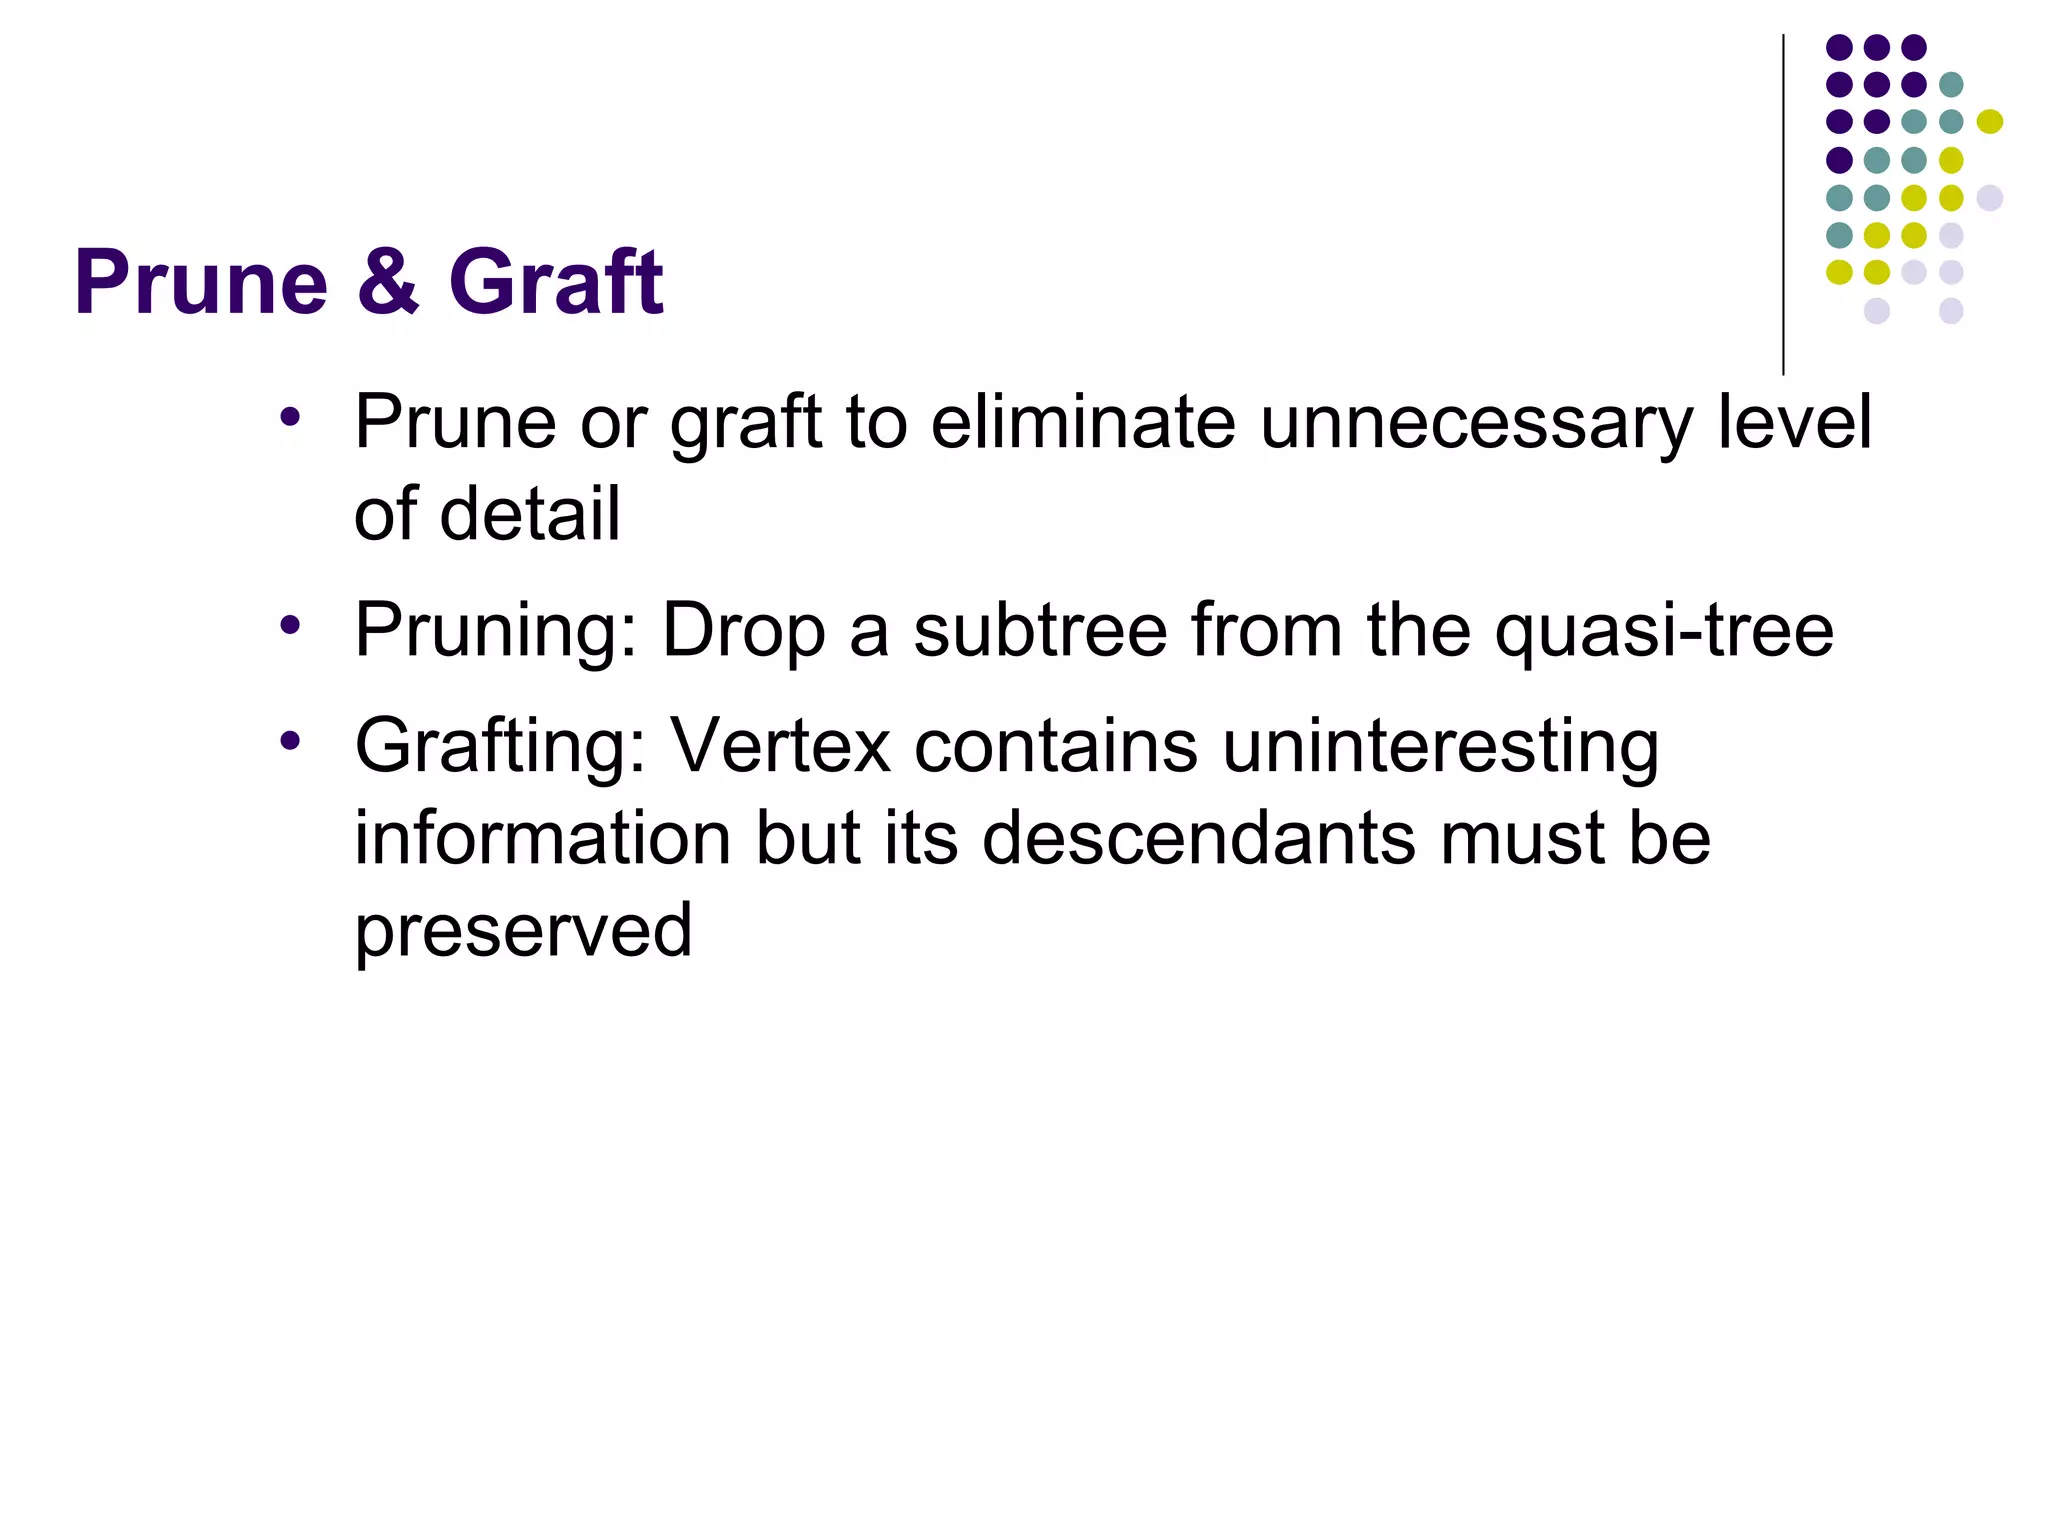
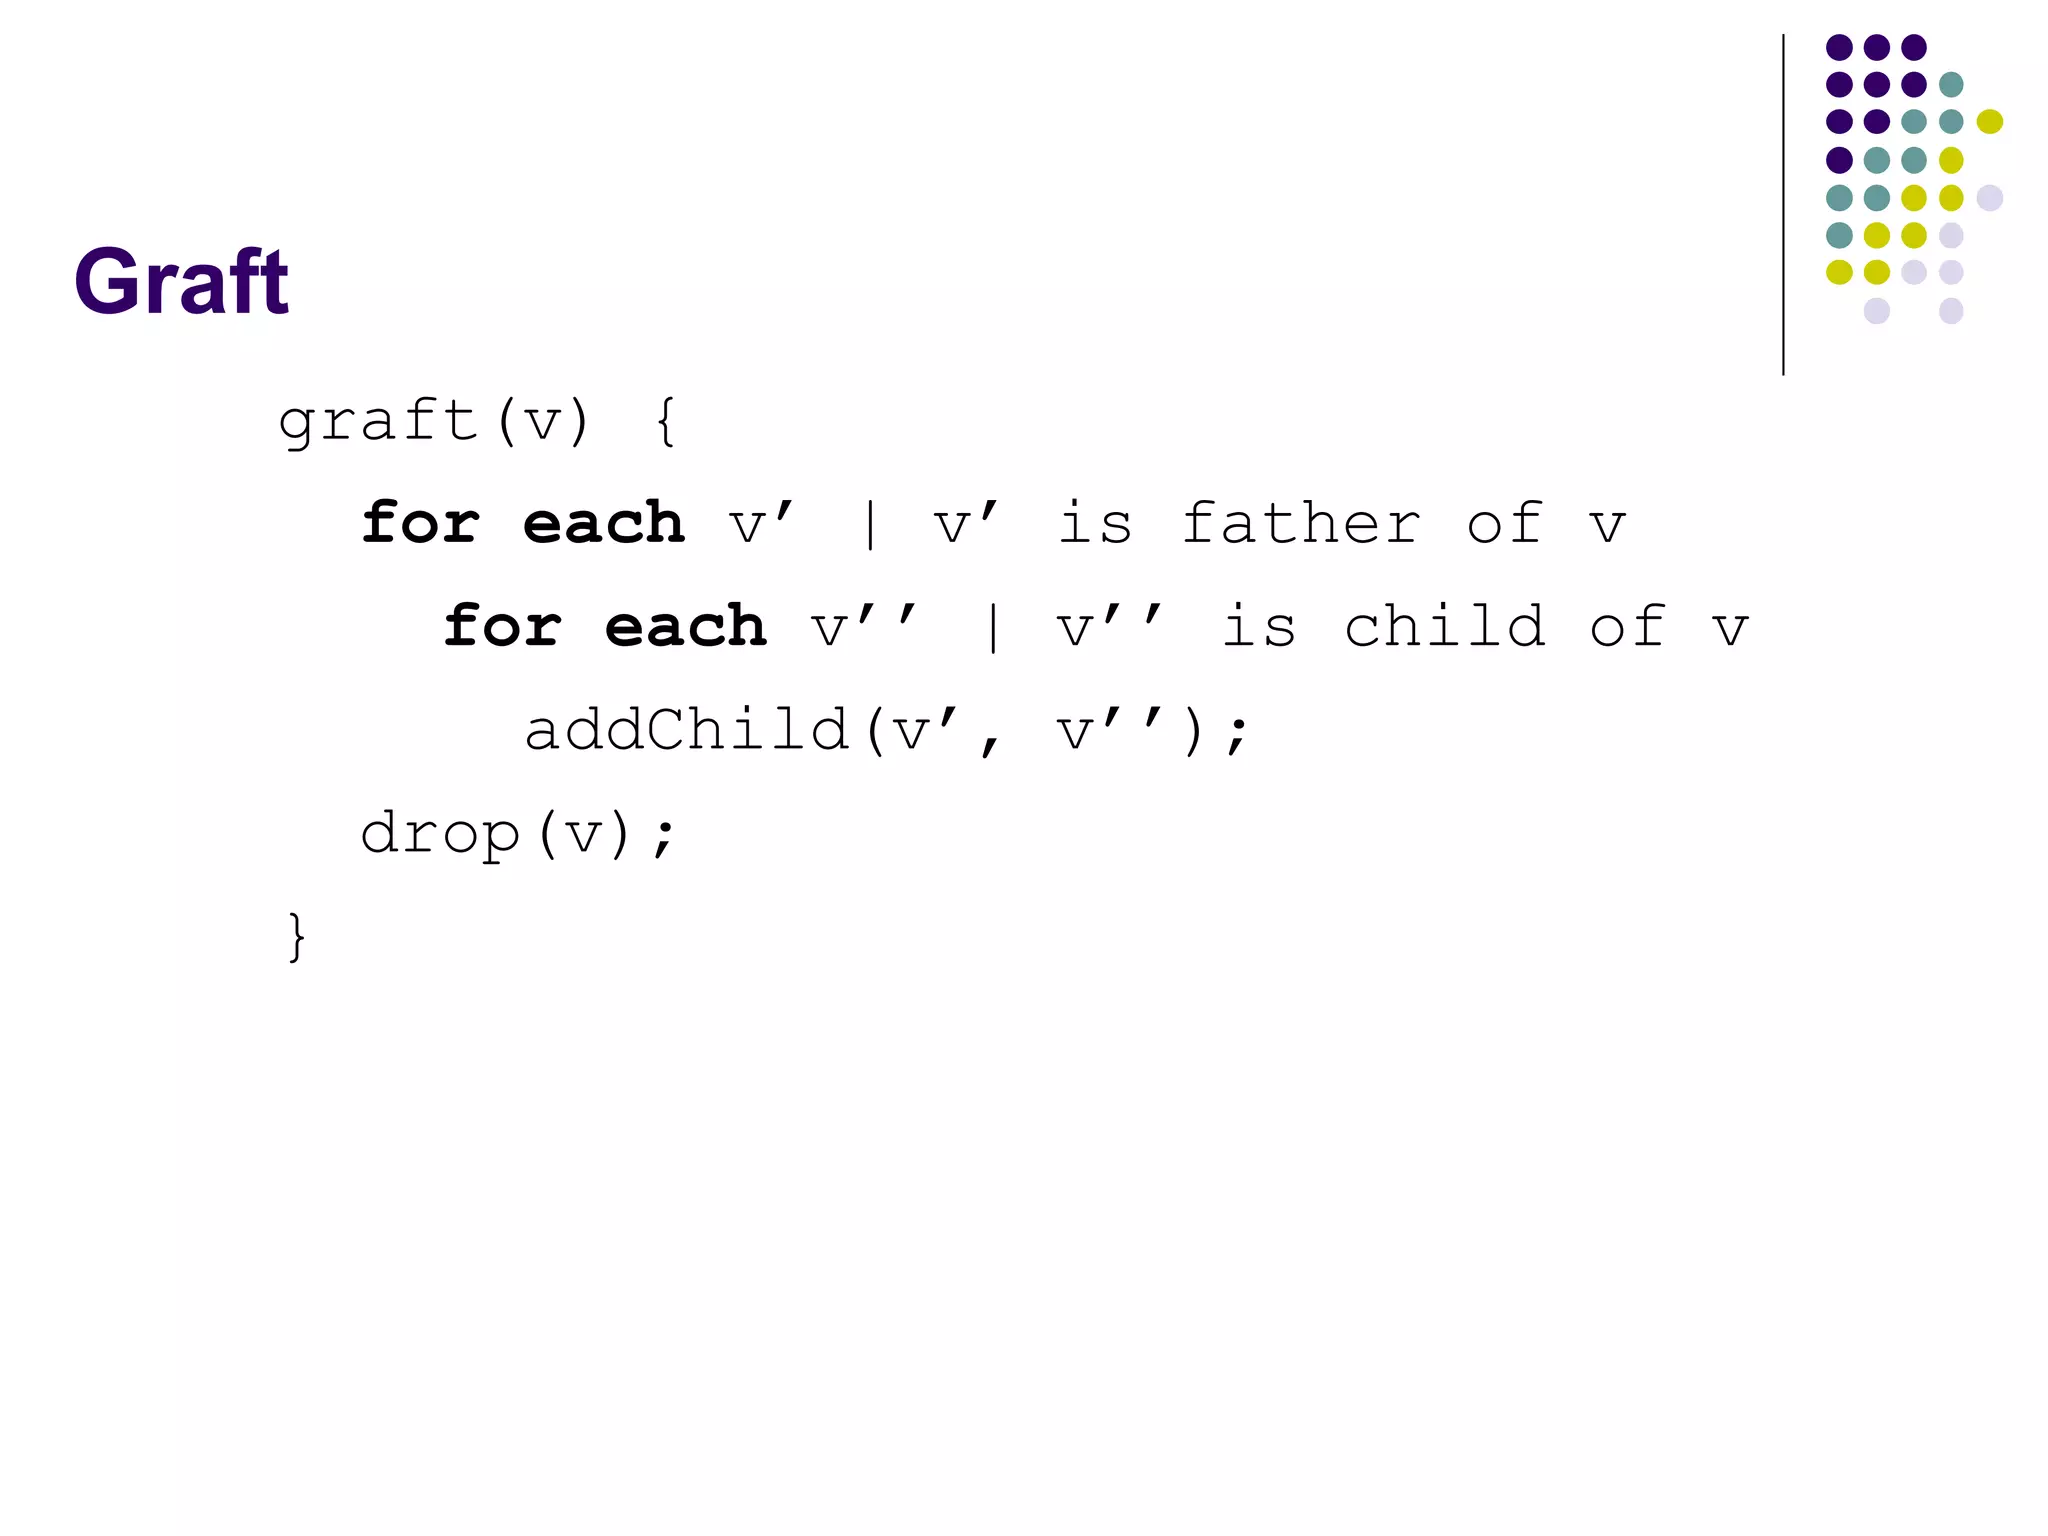
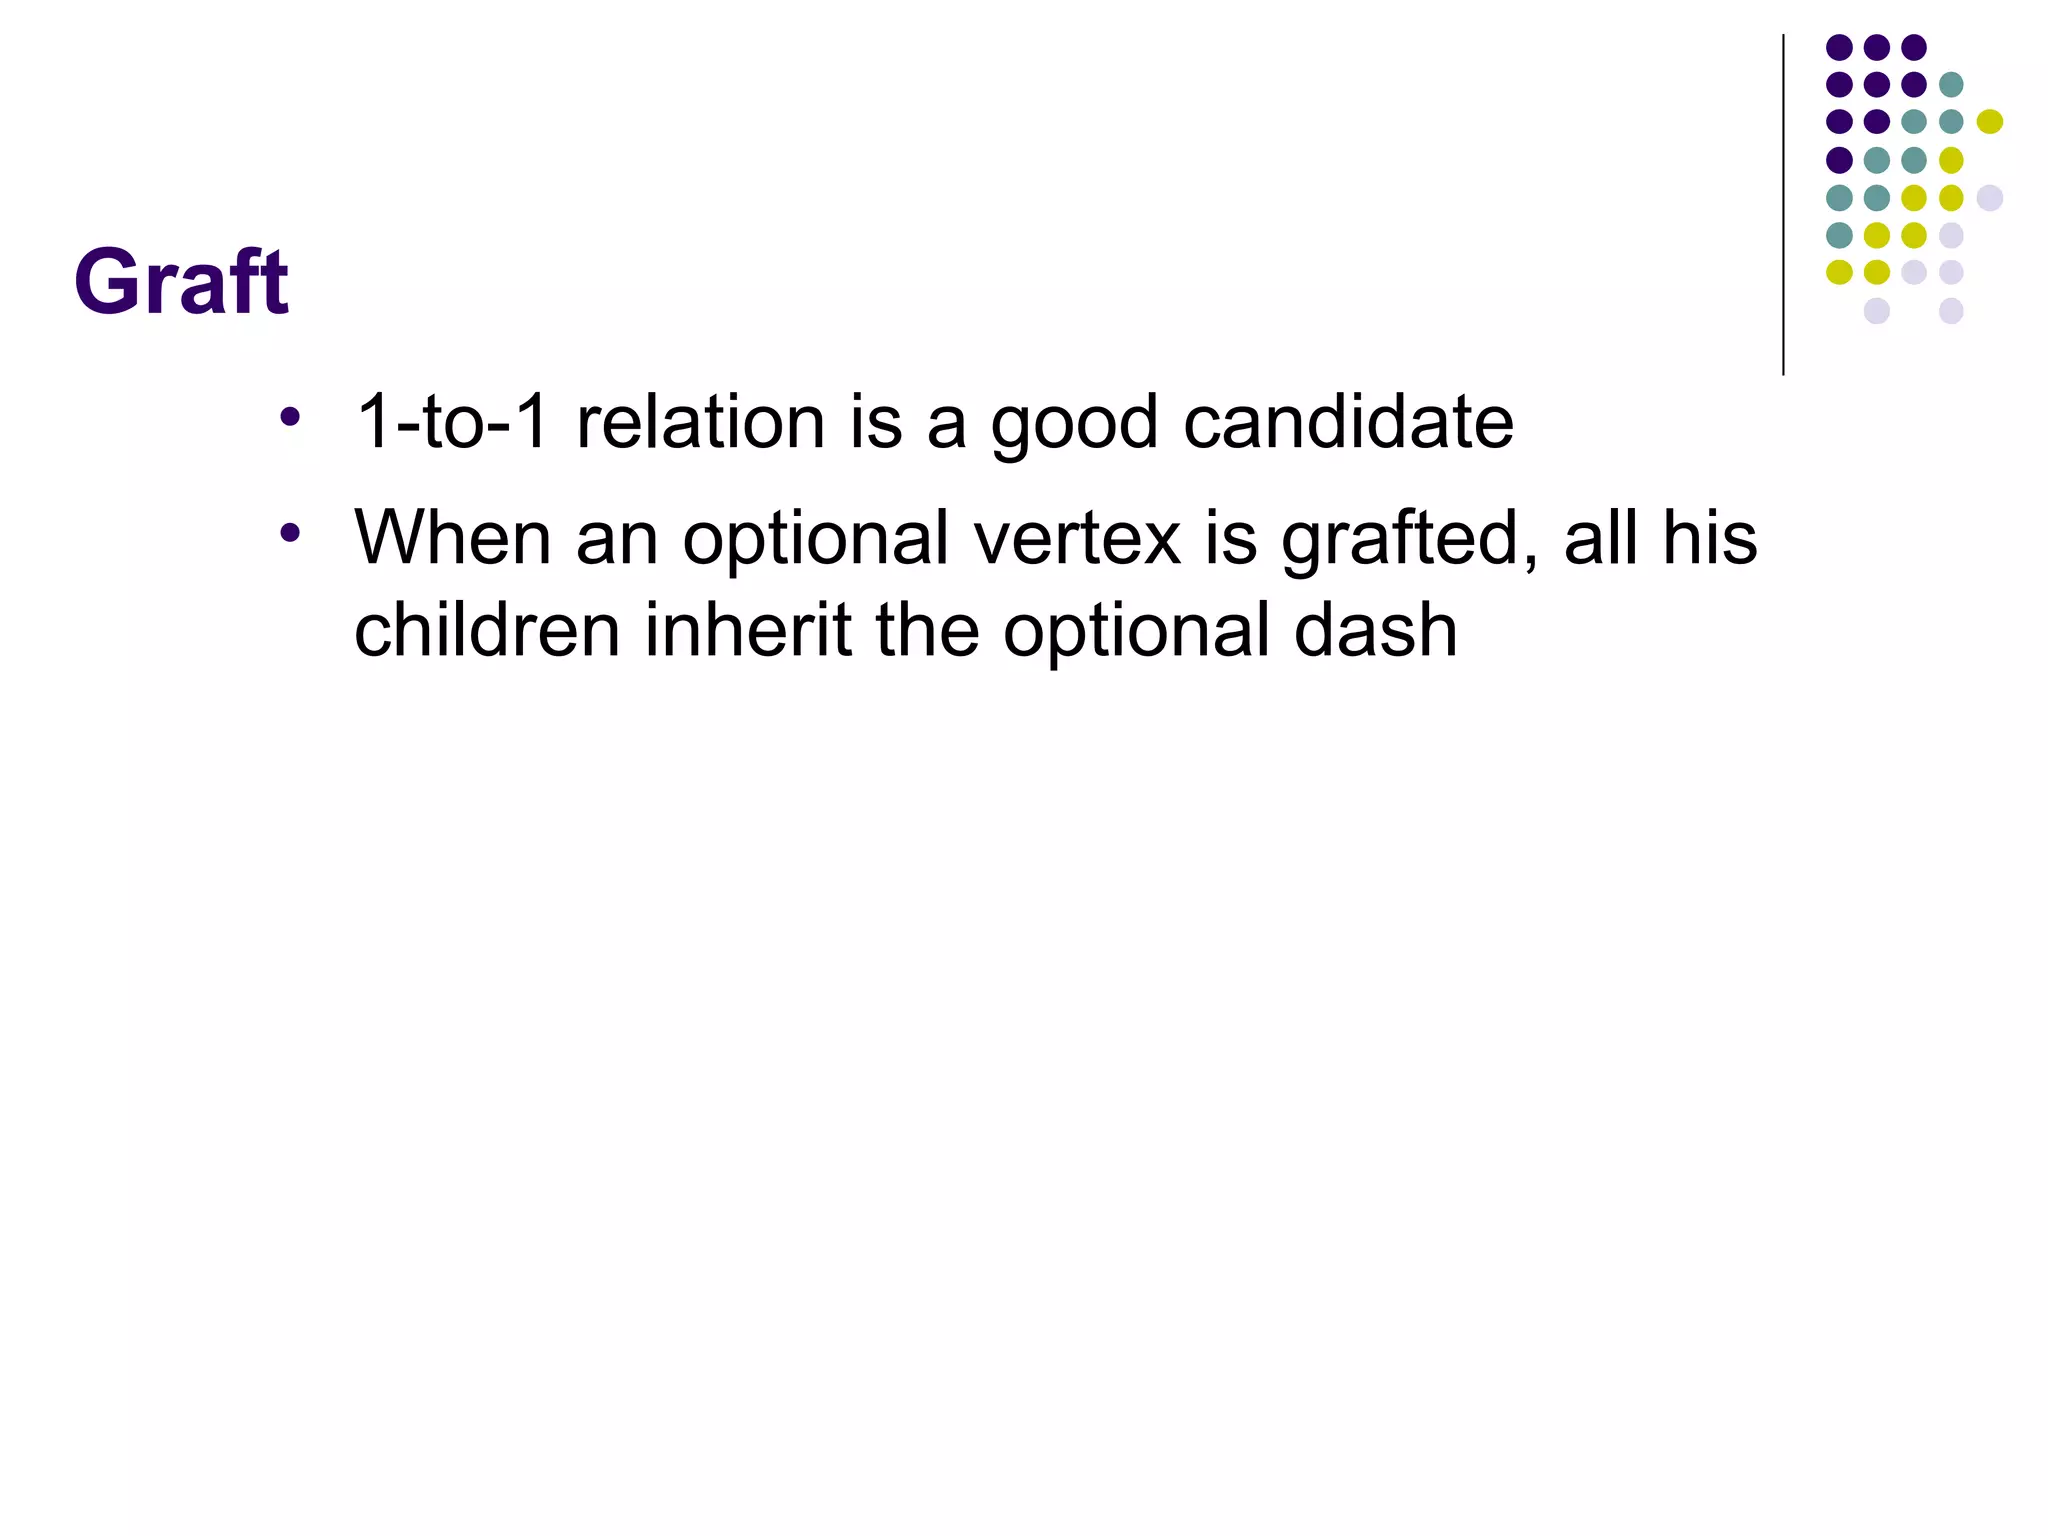
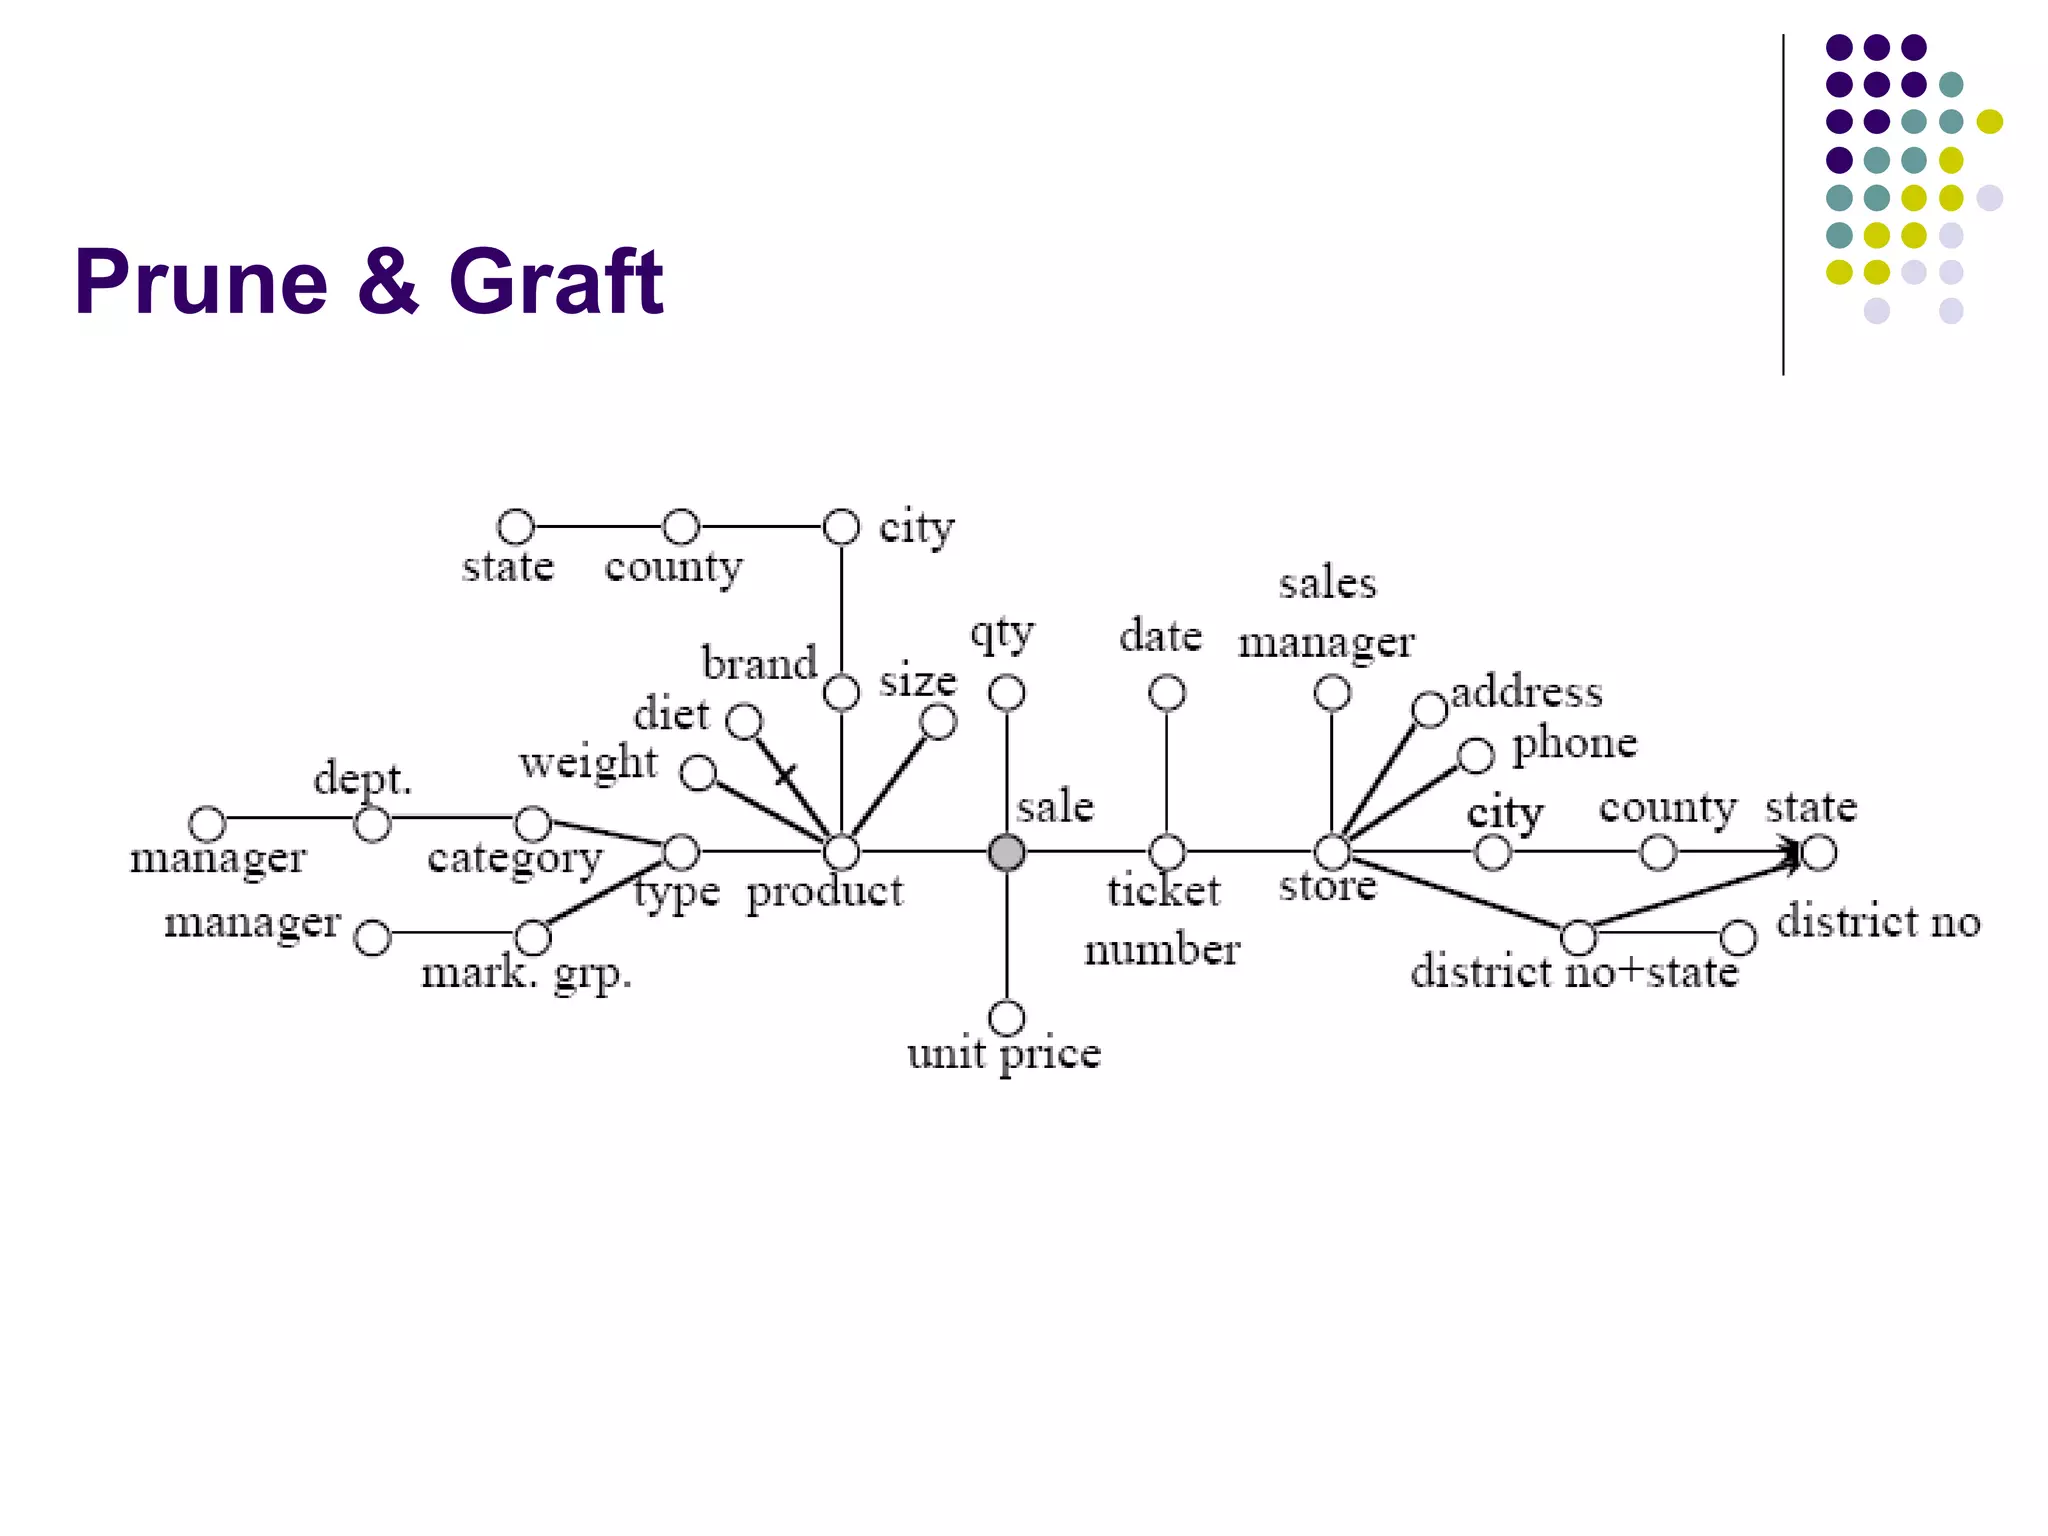
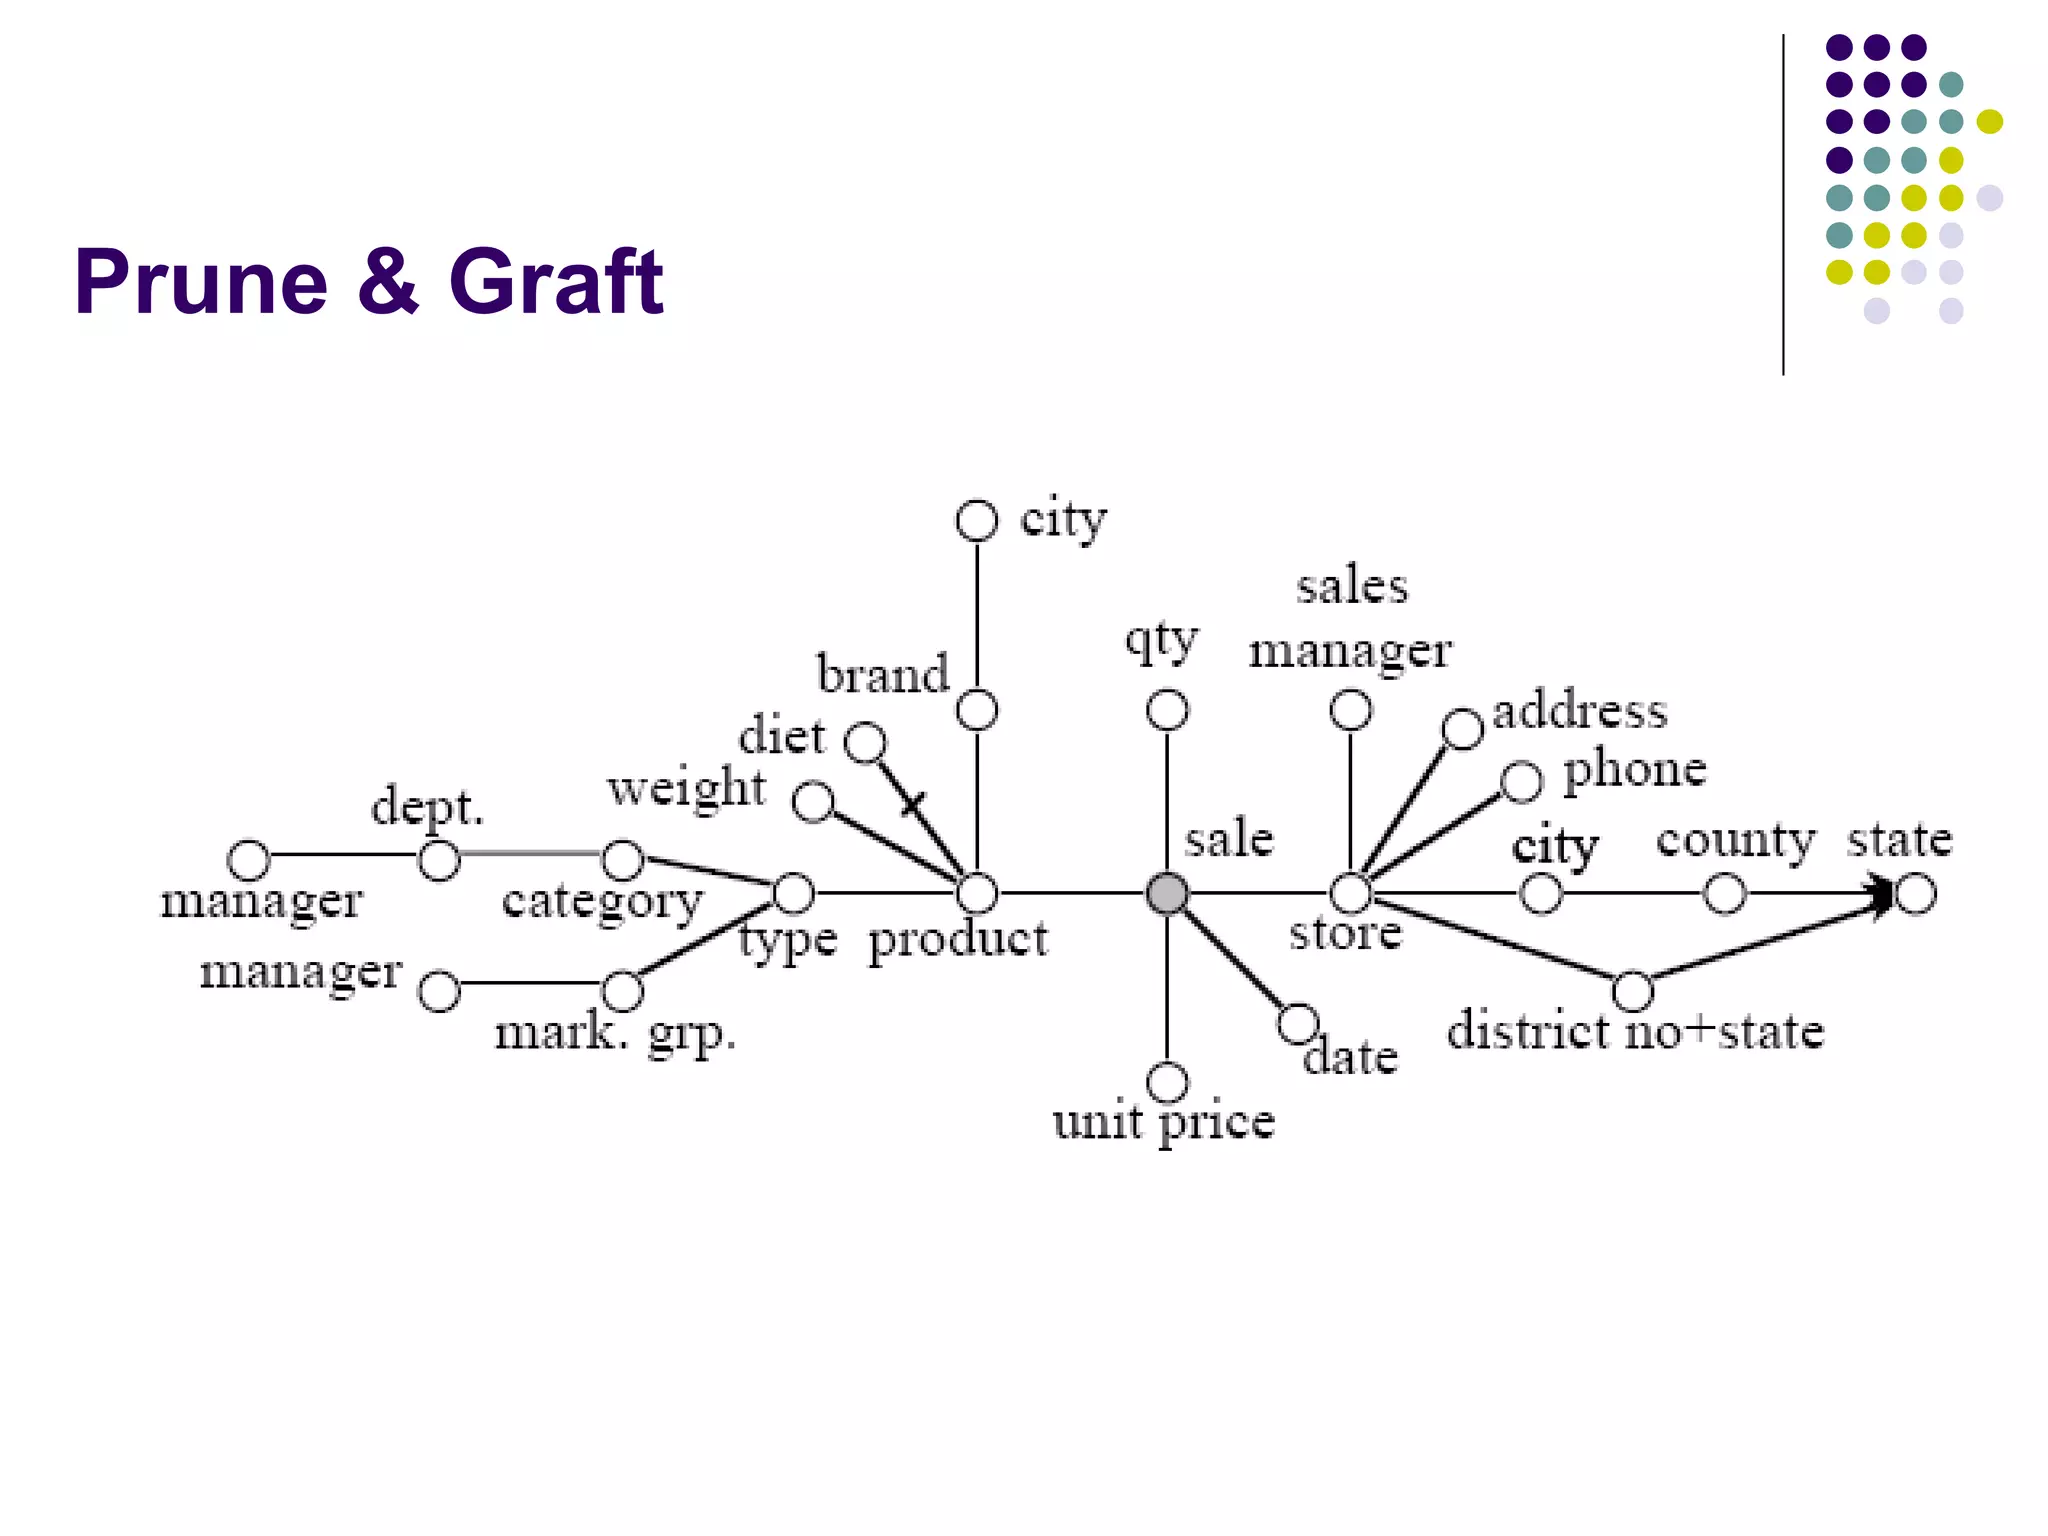
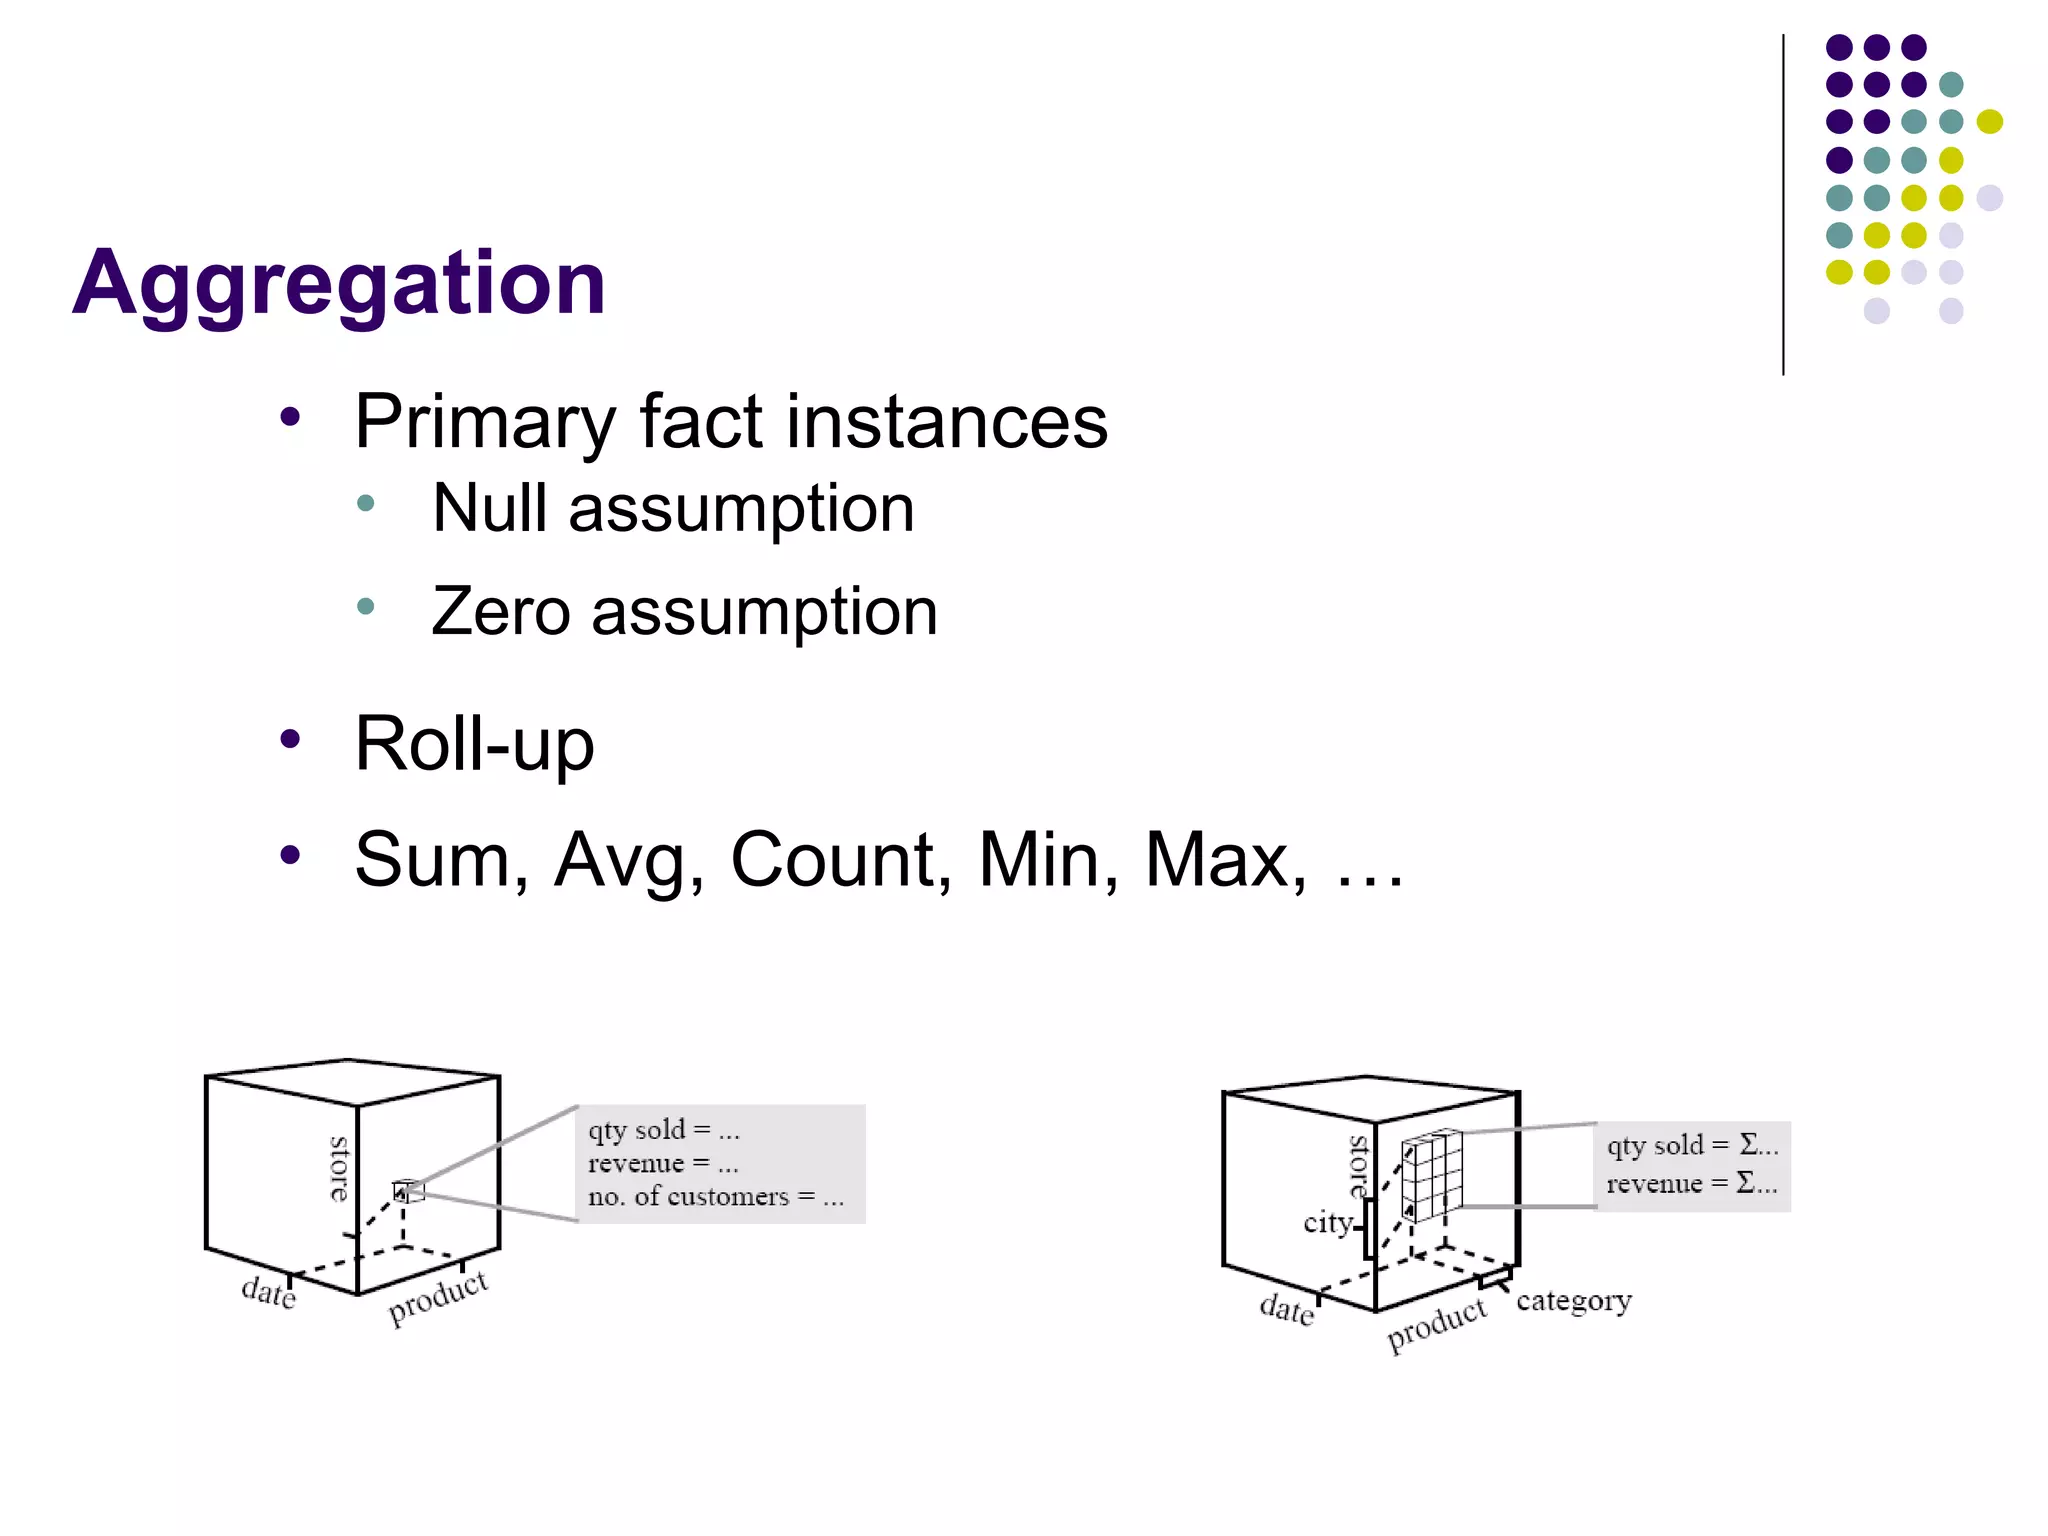
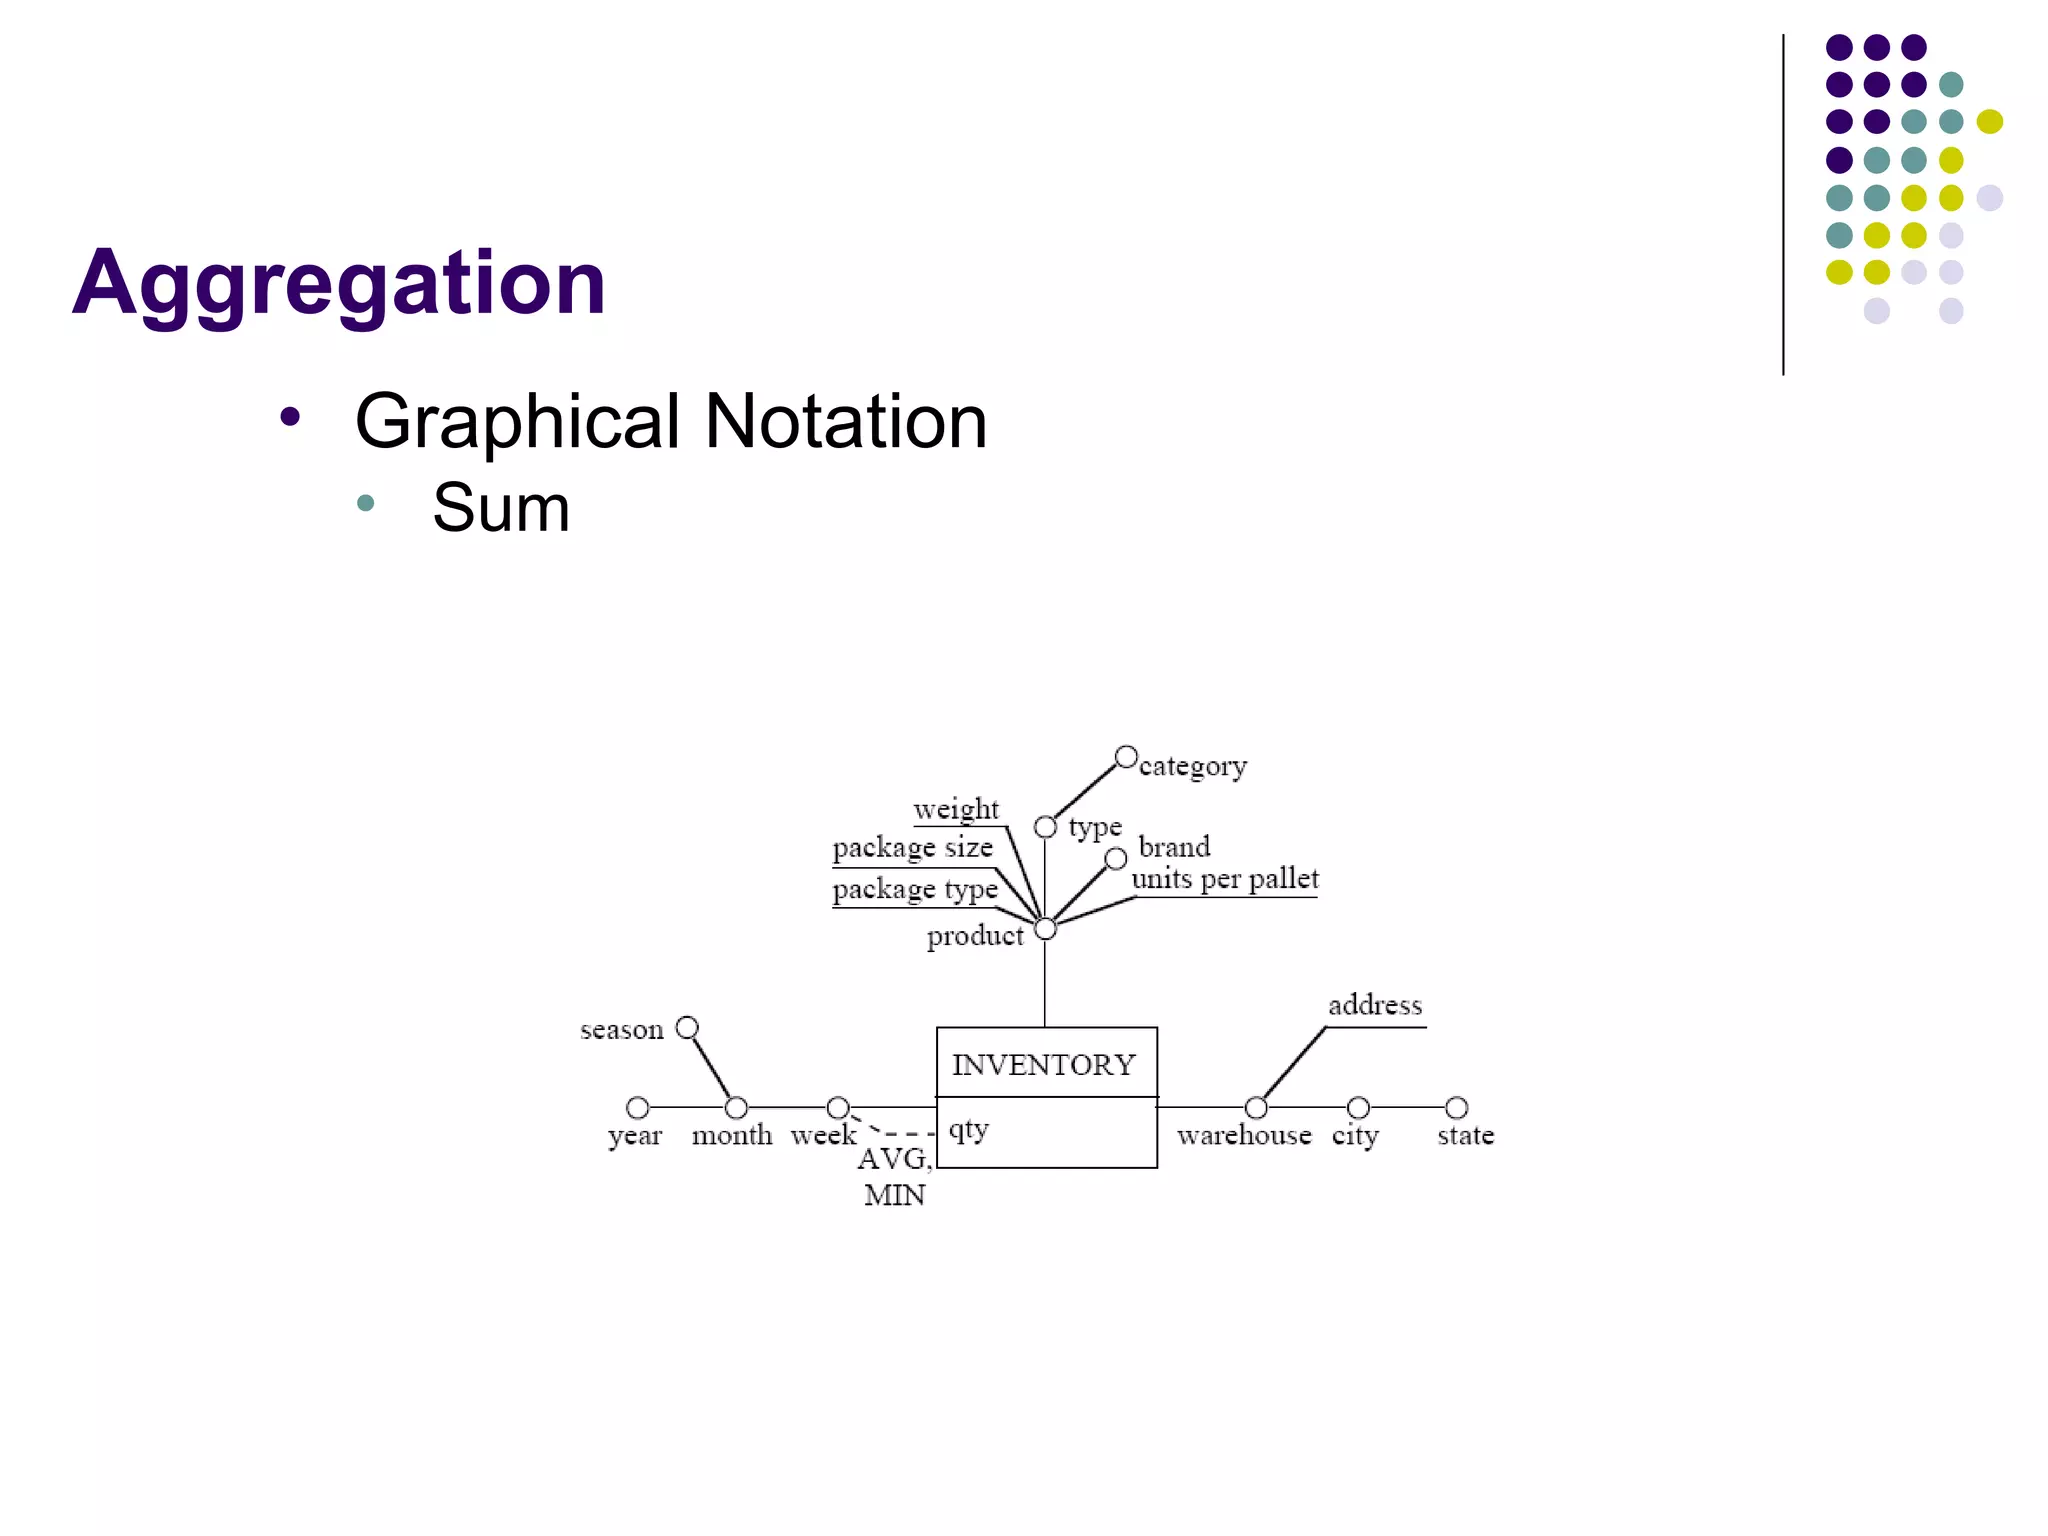
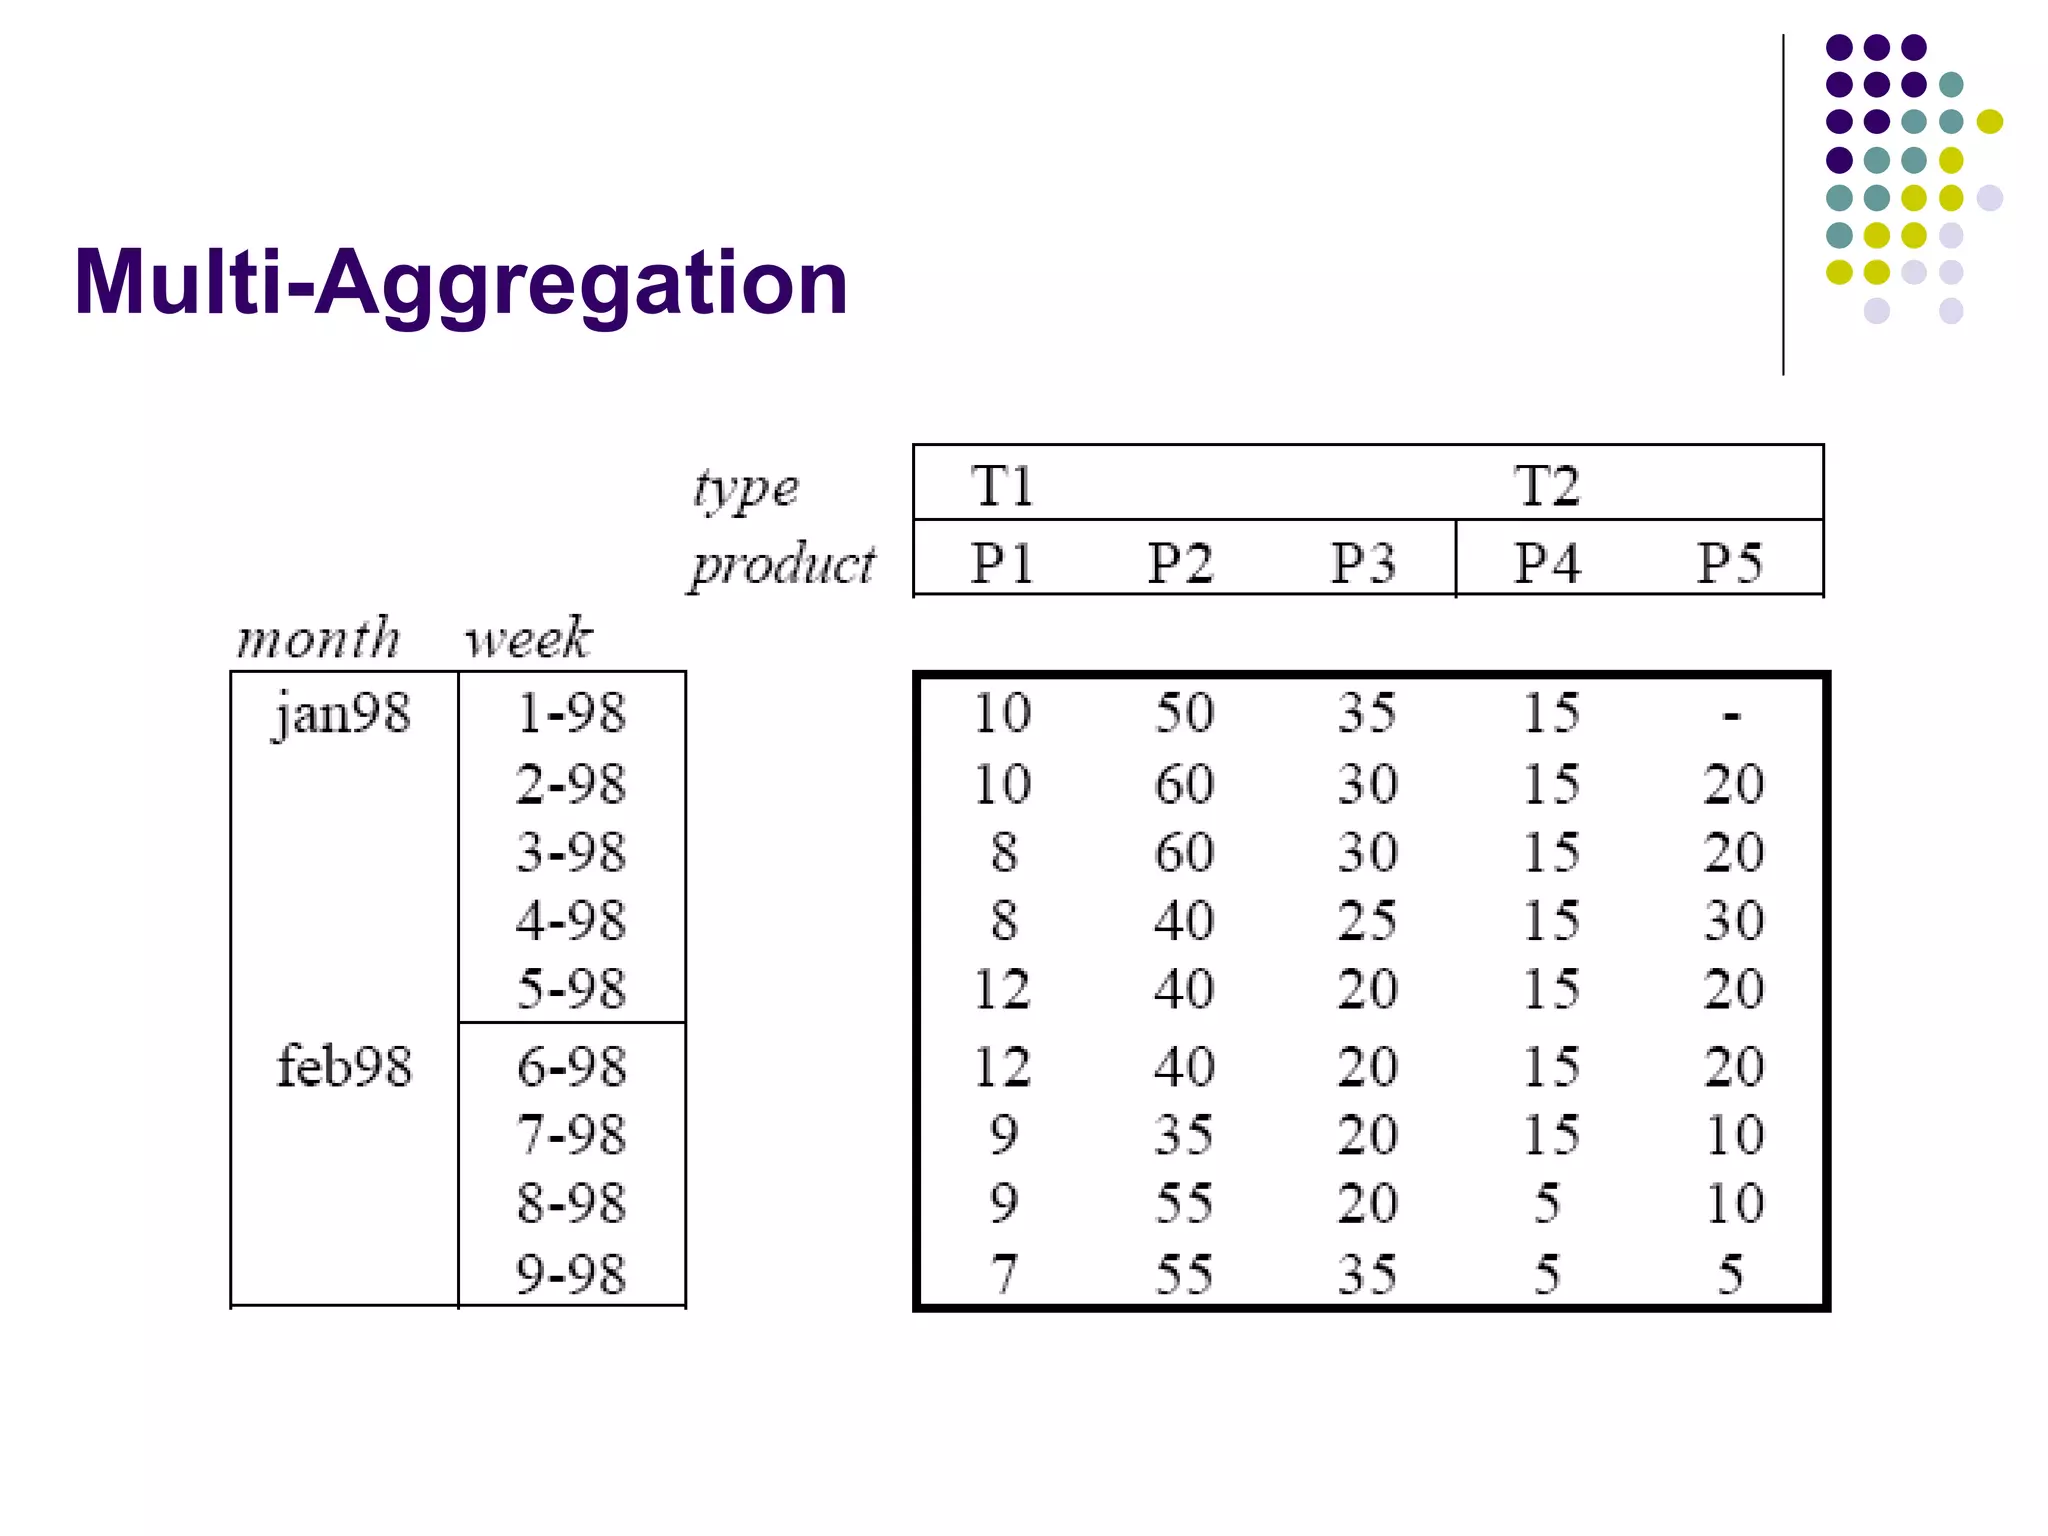
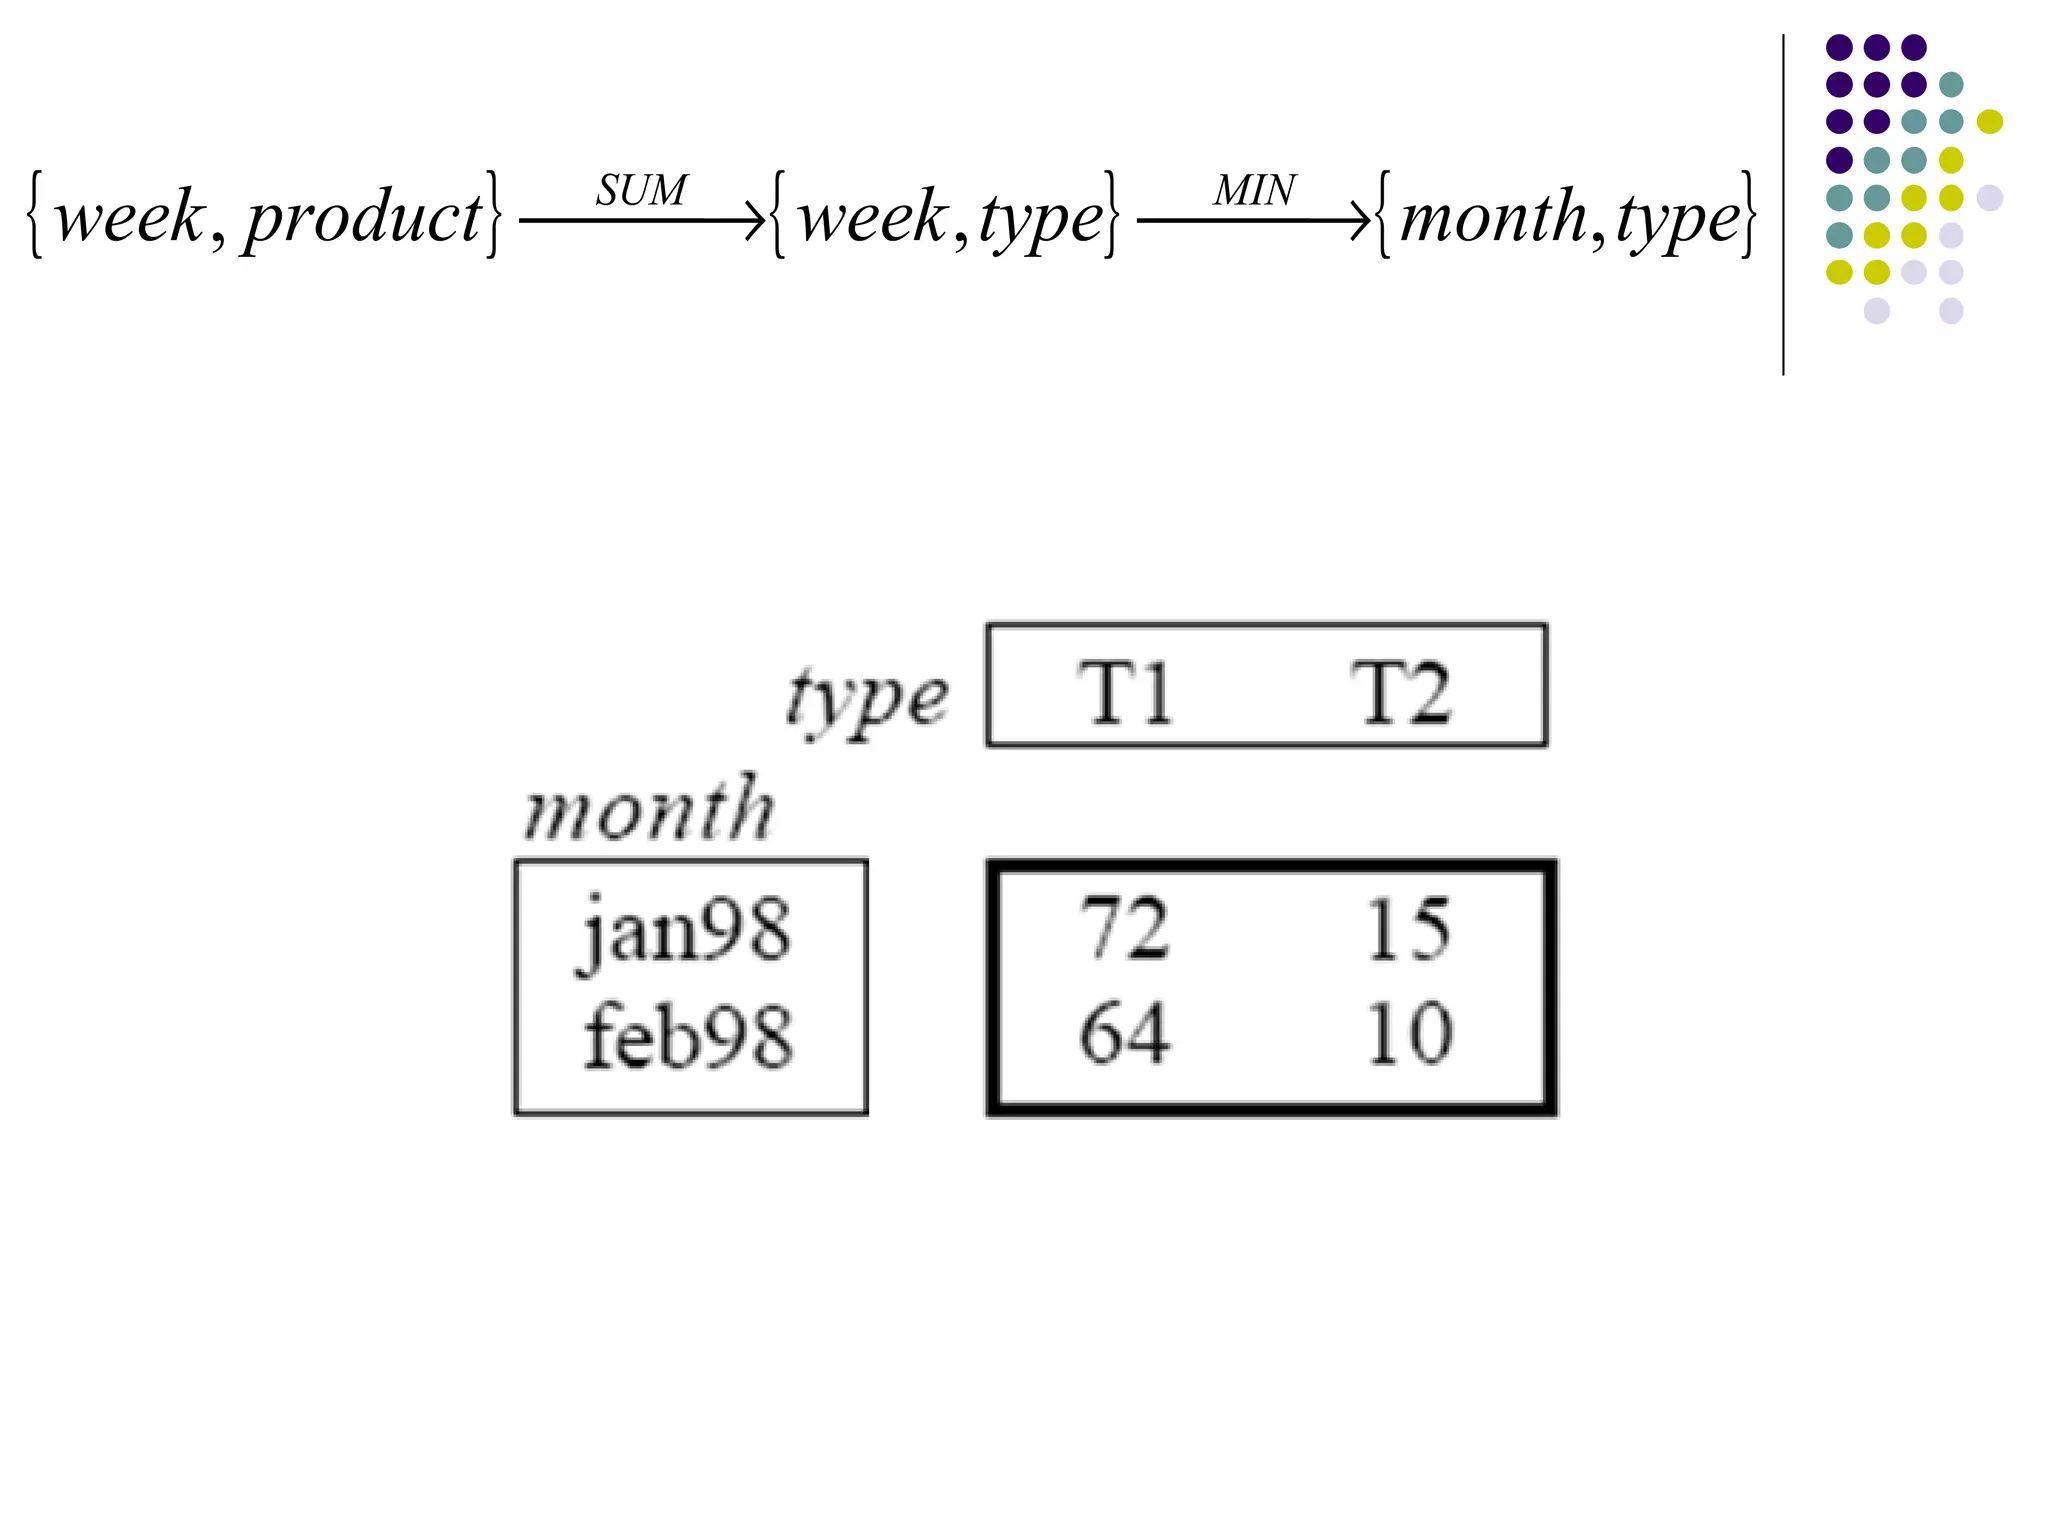
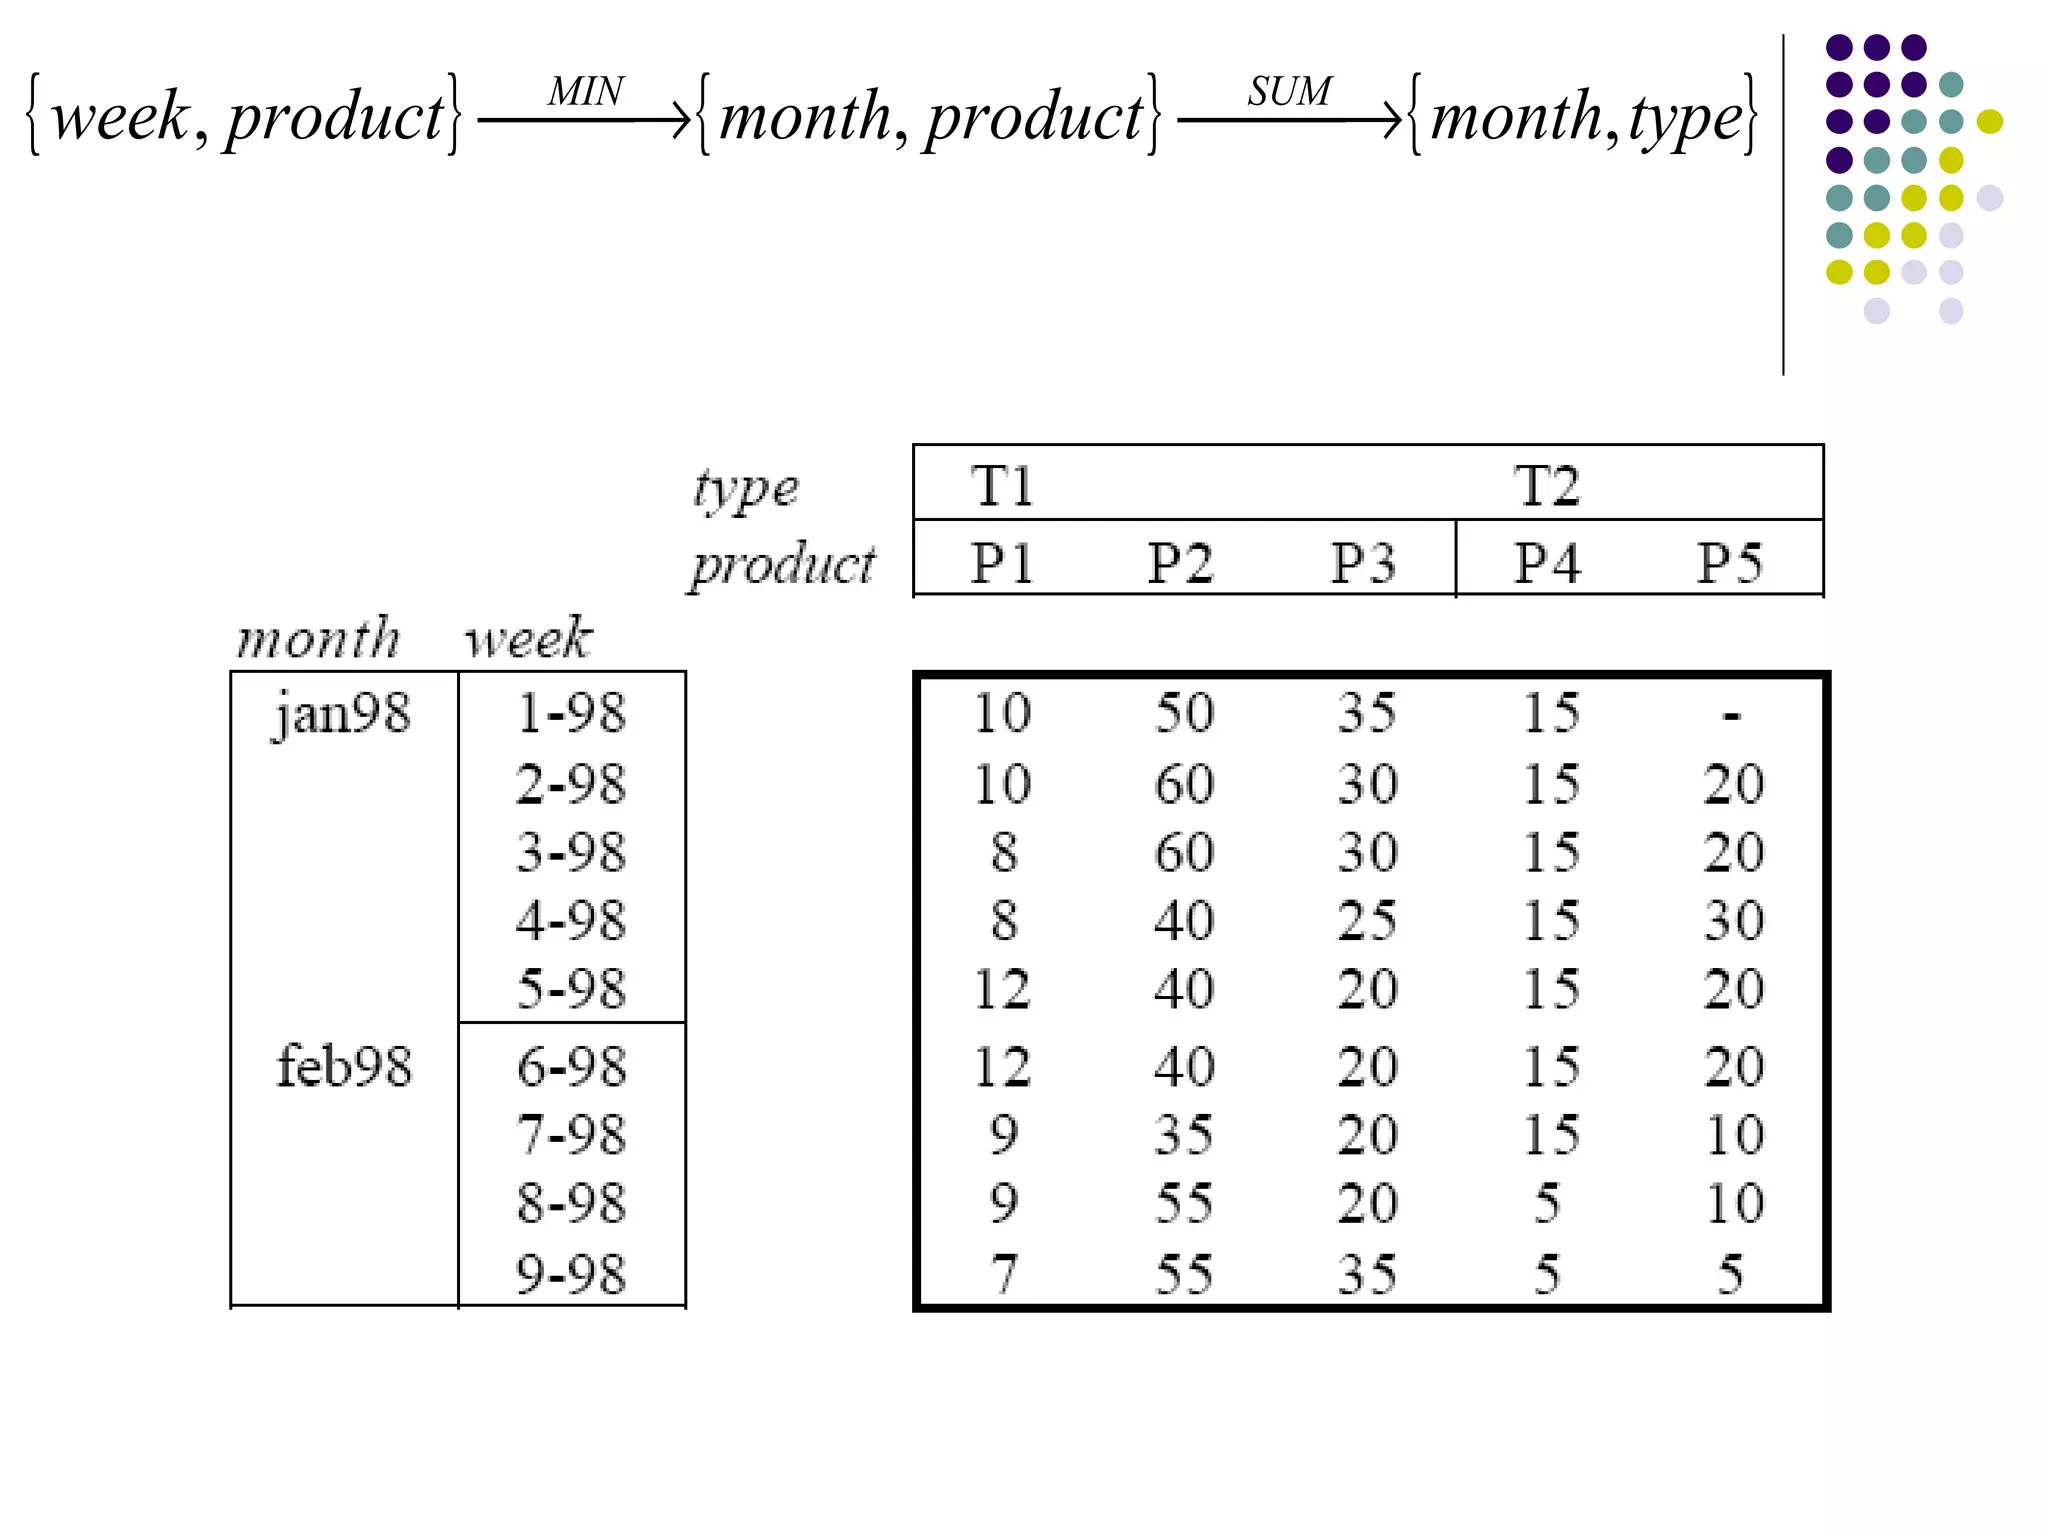
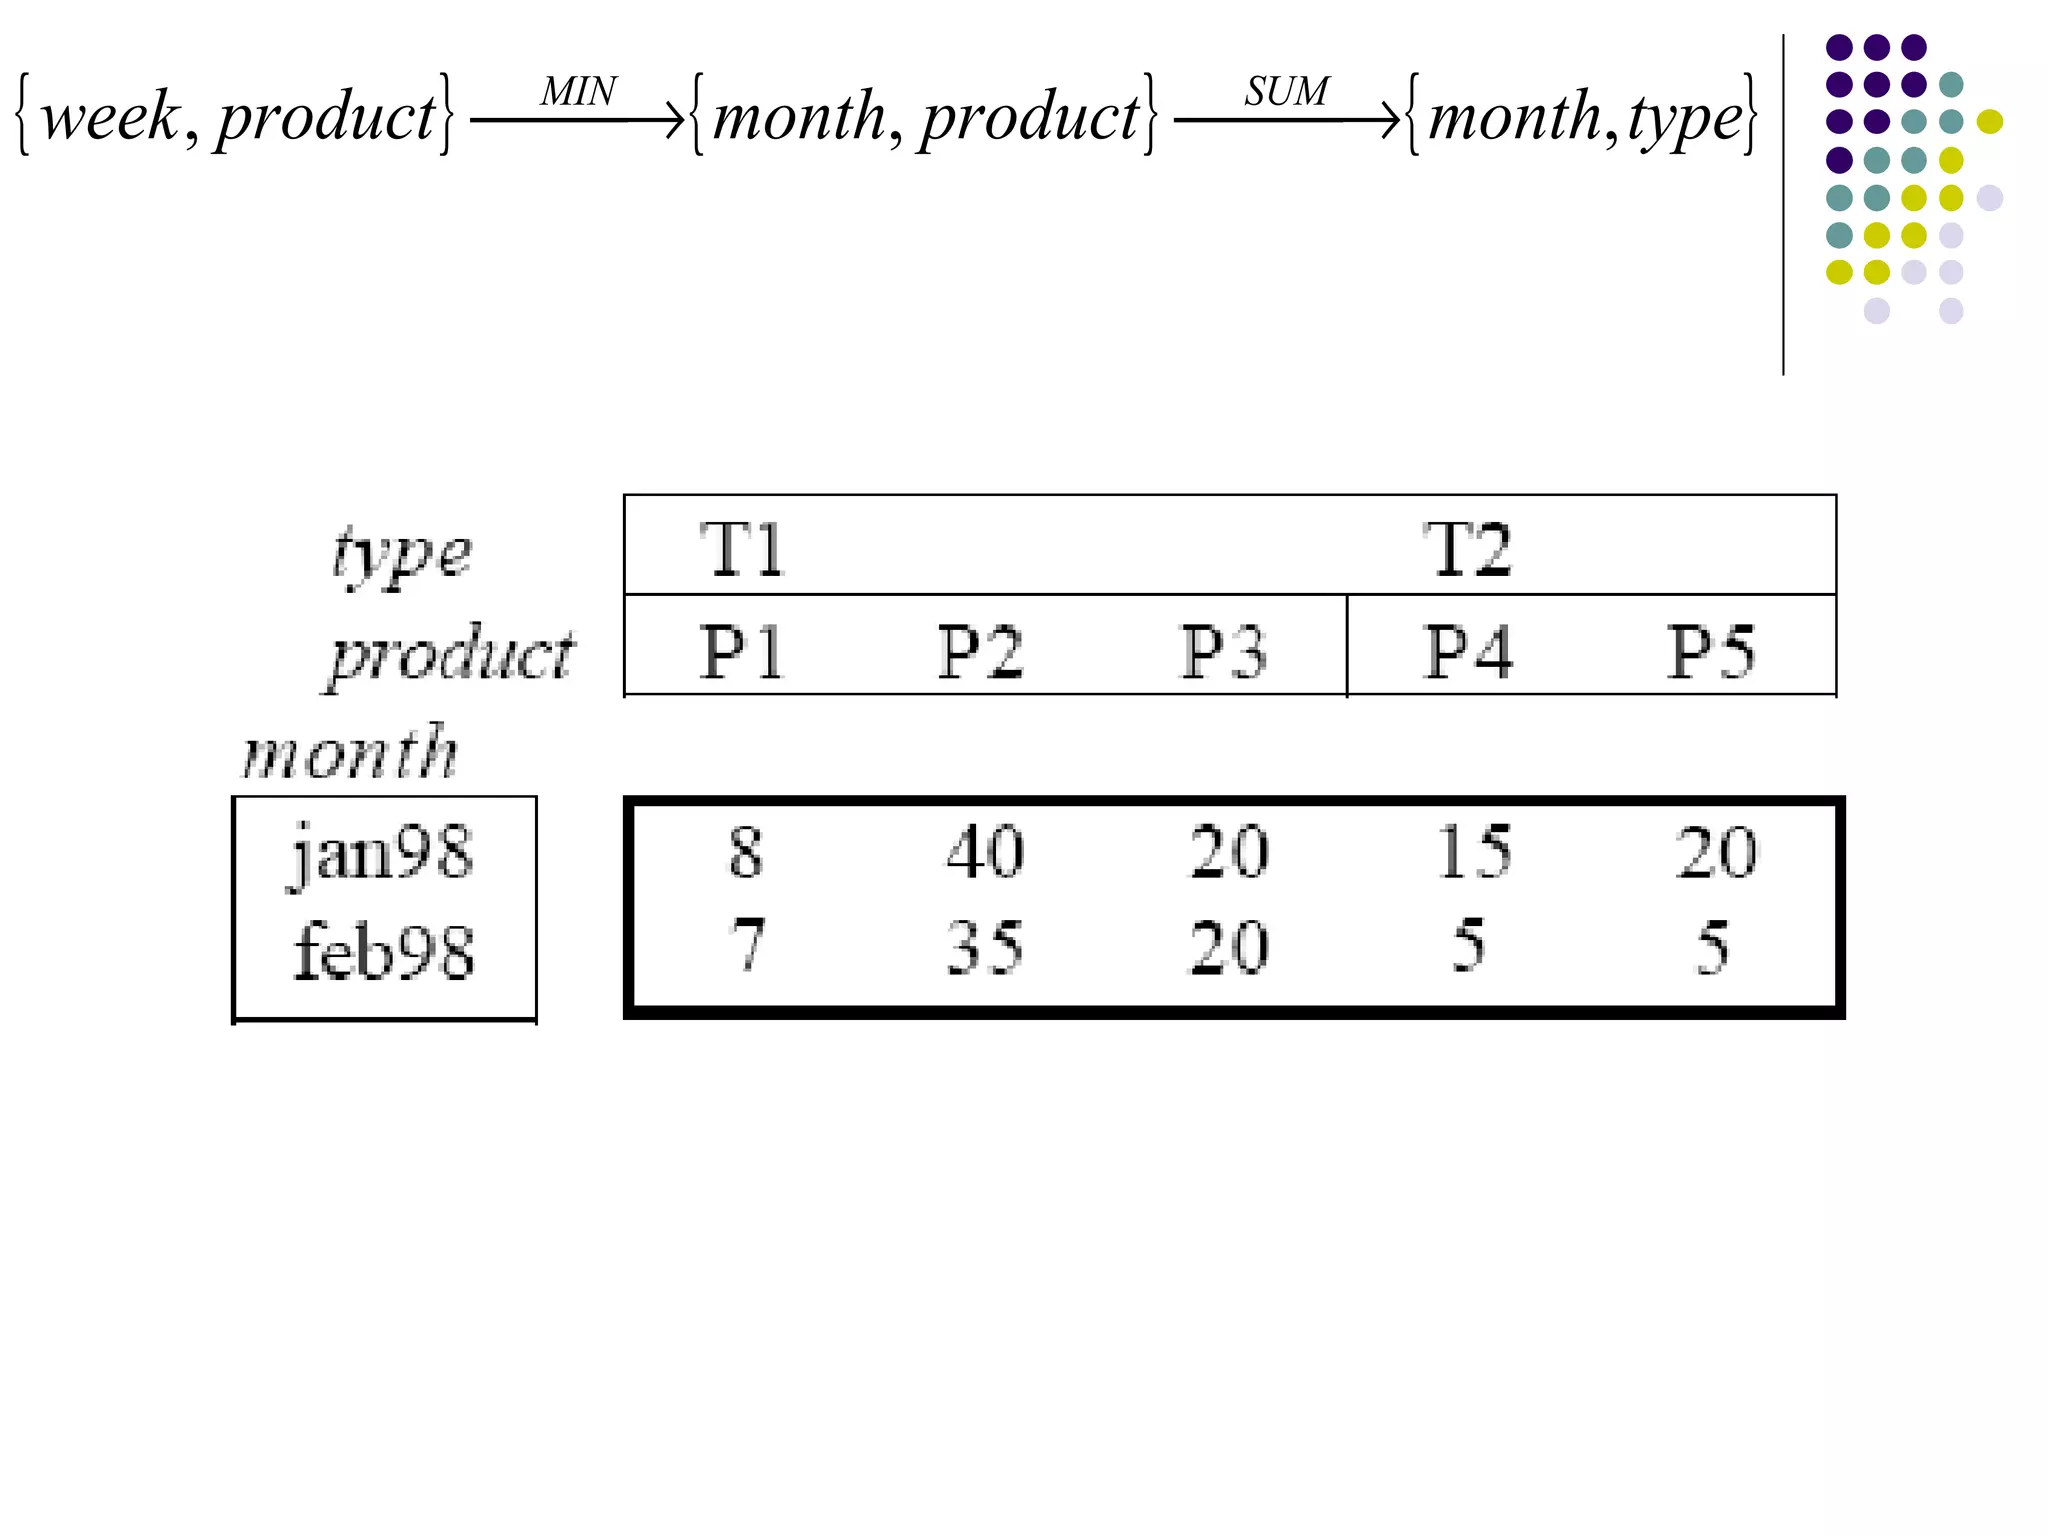
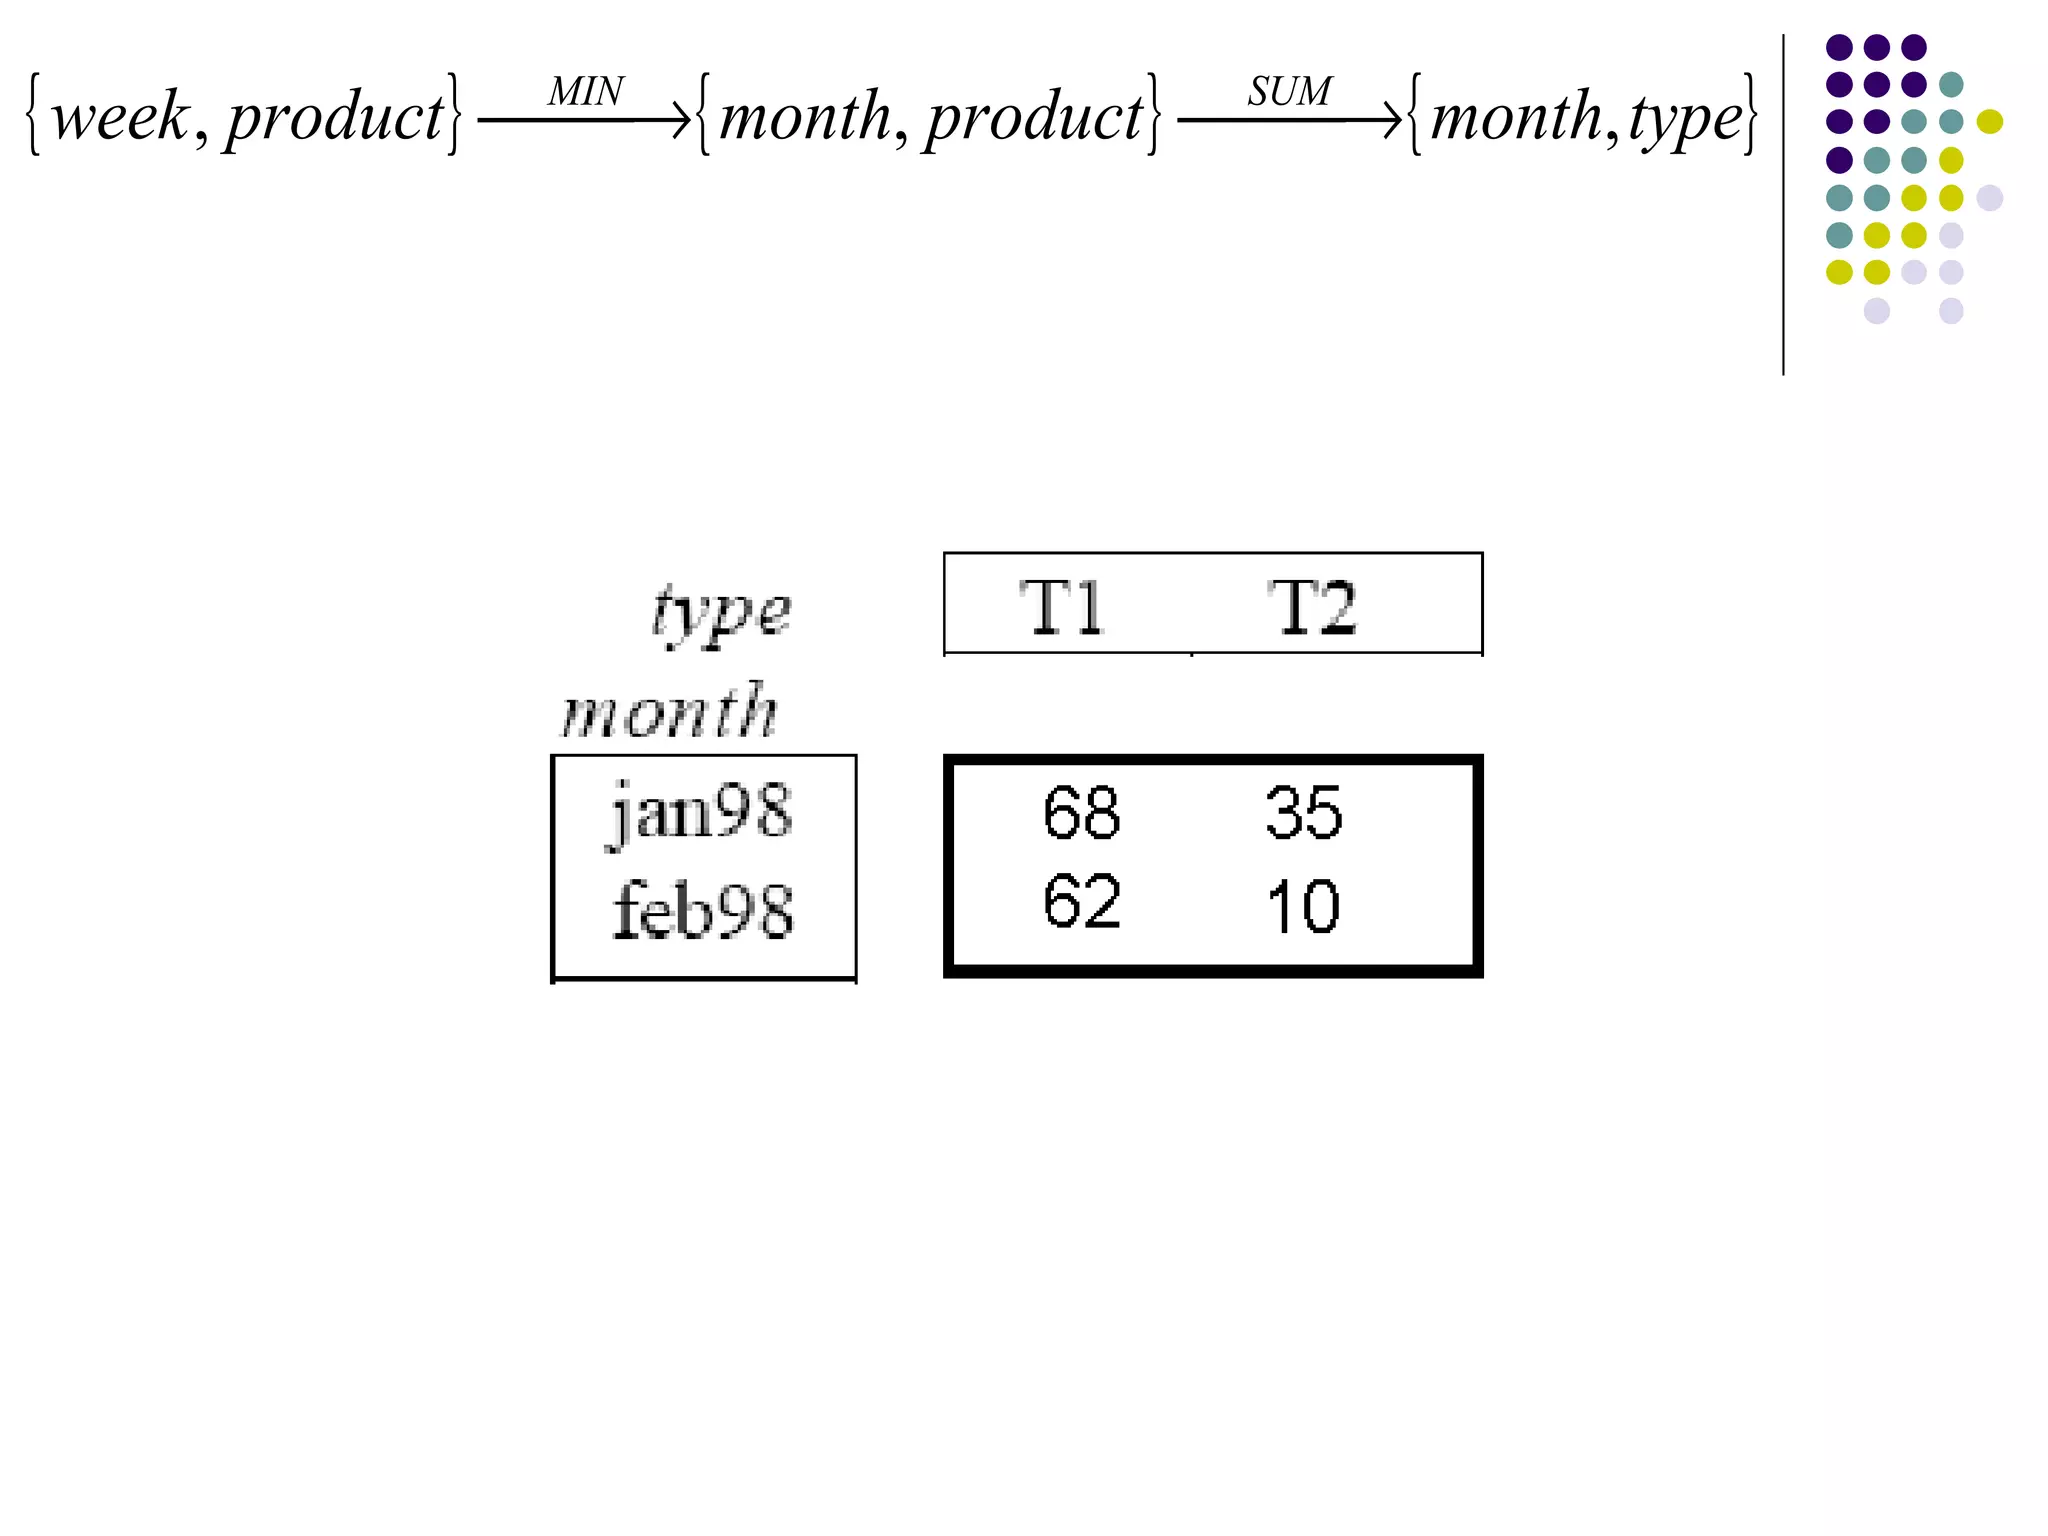
Data Warehouse Modeling Thijs Kupers Vivek Jonnaganti
Agenda Introduction Data Warehousing Concepts OLAP Dimension Modeling Conceptual Modeling Indexing Conclusion
Introduction
The Evolution 1960 - DSS processing using Fortron or COBOL 1970 - DBMS systems and the advent of DASD 1975 - OLTP systems facilitating faster access to data 1980 - PC/4GL technology and the advent of MIS 1985 - OLAP systems and separation of analytical processing from transactional processing 1994 - Architectured environments with integrated OLAP engines and tools
What is a Data Warehouse? A copy of transaction data specifically structured to Query and Analysis (Ralph Kimball, 1996) A collection of integrated, subject oriented databases designed to support the DSS function where each unit of data is relevant at some moment of time (Bill Inmon, 1991) The data characteristics of a Data Warehouse are; Subject-oriented Time-variant Non-volatile Integrated
What is a Data Warehouse? (cont’d) A single, complete and consistent store of data obtained from a variety of different sources made available to end users, in what they can understand and use in a business context (Barry Devlin 1992) A process of transforming data into information and making it available to users in a timely enough manner to make a difference (Forrester Research 1996)
Data Warehouse Goals/Characteristics It must make an organization’s information easily accessible (slicing and dicing) It must present the organization’s information consistently It must be adaptive and resilient to change It must be a secure bastion that protects our information assets It must serve as the foundation for improved decision making The business community must accept the DW, if it is to be deemed successful
Data Warehouse Applications Retail Industry Forecasting, Market research, Merchandising etc. Manufacturing and distribution Sales history/trends, Market demand projects etc. Banks Spot market trends, Marketing, Credit cards etc. Insurance Companies Property and casualty fraud etc. Health Care Providers Fraud detection, Patient matching etc.
Data Warehouse Applications Government Agencies Auditing tax records, information sharing across different agencies etc. Internet Companies Analyzing shopping behavior,  CRM etc. Telecommunications Telemarketing, Product development etc. Sports Analyzing strategies, Winning player combinations etc.
Data Warehouse Sizes Terabyte (10^12) - Walmart (24 TB) Petabyte (10^15) - Geographic Information Systems Exabyte (10^18) - National Medical Association Zettabyte (10^21) - Weather Images Zottabyte (10^24) - Intelligence Agency (Video)
Data Warehousing Concepts
Data Warehouse (OLAP) and OLTP
Data Warehouse Architecture Enterprise Data Warehouse Data Mart Data Mart Execution Systems CRM ERP Legacy e-Commerce Reporting Tools OLAP Tools Ad Hoc Query Tools Data Mining Tools External Data Purchased Market Data Spreadsheets Oracle SQL Server Teradata DB2 Custom Tools HTML Reports Cognos Business Objects MicroStrategy Oracle Discoverer Brio Data Mining Tools Portals Data and Metadata Repository Layer Informatica PowerMart Ab Initio Data Stage Oracle Warehouse Builder Custom programs SQL scripts Extract, Transformation, and Load (ETL) Layer Cleanse Data Filter Records Standardize Values Decode Values Apply Business Rules Householding Dedupe Records Merge Records Presentation Layer ETL Layer Operational Source Systems Technologies: Metadata Repository ODS PeopleSoft SAP Siebel Oracle Applications Custom Systems Data Mart
Data Warehouse Structure Highly Summarized Lightly Summarized Atomic/Detailed Departmentally Structured Individually Structured Data Warehouse Organizationally Structured Data Information
Data Warehouse Architecture Drivers The requirements that drive the DW architecture are; Granularity of data Data retention and timeliness Reporting capability Availability Scalability
Data Mart Centric Data Marts Data Sources Data Warehouse
Data Mart Centric If you end up creating multiple warehouses, integrating them is a problem
Data Warehouse Centric Data Marts Data Sources Data Warehouse
OLAP
OLAP: 3 Tier DSS Data Warehouse Database Layer Store atomic data in industry standard Data Warehouse. OLAP Engine Application Logic Layer Generate SQL execution plans in the OLAP engine to obtain OLAP functionality. Decision Support Client Presentation Layer Obtain multi-dimensional reports from the DSS Client.
OLAP Servers Support multidimensional OLAP queries Characterized by how the underlying data is stored Multidimensional OLAP (MOLAP) Servers Data stored in array based structures e.g. Hyperion Essbase Relational OLAP (ROLAP) Servers Data stored in relational tables e.g. Microstrategy, IBM Informix Hybrid OLAP (HOLAP) Servers Data distributed between relational and specialized storage e.g. Cognos, Microsoft Analysis Services
OLAP Operations Rollup; summarize operations E.g. given sales data, summarize sales for last year by product category and region Drill down; get more details E.g. given summarized sales as above, find breakup of sales within each region Slice and dice; select and project Sales of soft-drinks in Gothenburg over the last quarter Pivot; change the view of data
Strengths of OLAP It is a powerful visualization tool It provides fast, interactive response times It is good for analyzing time series It can be useful to find some clusters and outliners Many vendors offer OLAP tools
Dimensional Modeling
What is Dimensional Modeling? Logical design technique that seeks to present the data in a standard, intuitive framework that allows for high-performance access. Adheres to a discipline that uses the relational model with some important restrictions.  Composed of one table with a multi-part key, called the fact table, and a set of smaller tables called dimension tables.
DM v/s ER Models  DM ER Used to design database for Online Analytical Processing (OLAP) Used to design database for Online Transaction Processing (OLTP) Support ad hoc end-user queries Support defined queries Intuitive & facilitates high-performance retrieval of data Removes redundancy of data De-normalized Normalized
Fact Tables Primary table in the DM Each row corresponds to a measurement Facts in the fact table are numeric and additive Narrow rows with a few columns Large number of rows (billions) Express many-to-many relationships  between dimensions
Dimension Tables Define business in terms already familiar to users Implement the user interface to the DW Wide rows with lots of descriptive text Small tables (about a million rows)  Joined to fact table by a foreign key Heavily indexed E.g. of typical dimensions time periods, geographic region (markets, cities), products, customers, salesperson, etc.
Four Step Dimensional Design Process Step 1 - Select the business process to model The first step in converting an ER diagram to a set of DM diagrams is to separate the ER diagram into its discrete business processes and to model each one separately. Step 2 - Choose The Grain of the Business Process The grain is the fundamental atomic level of data to be represented in the fact table.
Four Step Dimensional Design Process (cont’d) Step 3 - Designate the Fact Tables The third step is to select those many-to-many relationships in the ER model containing numeric and additive non-key facts and to designate them as fact tables. Step 4 - Choose the dimensions that will apply to each fact table record This involves de-normalizing all of the remaining tables into flat tables with single-part keys that connect directly to the fact tables.
Classic Star Schema Model
Snowflake Schema
Fact Constellation Schema
Slowly Changing Dimensions Type 1: Overwrite the value
Slowly Changing Dimensions (cont’d) Type 2: Add a Dimension row Type 3: Add a Dimension column
Conceptual Modeling
Graph Theory Directed, acyclic, weakly connected graph Quasi-tree
The Dimensional Fact Model Fact Schemes Facts Measures Dimensions Hierarchies Dimension attributes Non-dimension attributes
The Dimensional Fact Model
Why Formalize?
Why Formalize? Give meaning to the model Tool support Transformation Algorithms CASE-Tool  (Computer Aided Software Engineering)
Fact Scheme M is a set of measures A is a set of dimension attributes N is a set of non-dimension attributes R is a set of ordered couples, having the form (a i , a j ), indicating the ‘edges’ of the scheme
Fact Scheme O is a set of optional relationships S is a set of aggregation statements, in the form (m j , d i ,  Ω )
Fact Scheme We call the set Dim(f) a dimension pattern. Each element in Dim(f) is a dimension
Fact Scheme
Algorithm From ER to Conceptual Design Define Facts For each fact Build attribute tree Prune & Graft Define Dimensions Define Measures Define Hierarchies
Sample Schema
Define Facts Entity F Relationship R between entities E 1 …E n Transform R into an entity F Frequently updated archives are good candidates for defining facts E.g. Sale Not: Store, City Each Fact becomes a root in a fact scheme
Transform Relation
Build Attribute Tree Each vertex corresponds to an attribute of the scheme Root corresponds to the identifier of F
Build Attribute Tree root=newVertex(identifier(F)); translate(F, root);
Build Attribute Tree translate(E,v) { for each  attribute a E | a identifier(E) addChild(v, newVertex({a})); for each  entity G connected to E by a relationship R | max(E,R) = 1 { for each  attribute b R addChild(v, newVertex({b})); next=newVertex(identifier(G)); addChild(v, next); translate(G, next); } }
Example translate(E= SALE , v= sale ) addChild(v,  qty ); addChild(v,  unitPrice ); for G= PURCHASE TICKET addChild(v,  ticketNumber ); translate(PURCHASE TICKET,  ticketNumber ) for G= PRODUCT addChild(v,  product ); translate(PRODUCT,  product );
Attribute Tree
Attribute Tree Label the root with the name of the entity F instead of his identifier Optional relationships not in algorithm if  min(E,R)=0
From ER till Conceptual Design Build attribute tree Prune & Graft Define Dimensions Define Measures Define Hierarchies
Prune & Graft Prune or graft to eliminate unnecessary level of detail Pruning: Drop a subtree from the quasi-tree Grafting: Vertex contains uninteresting information but its descendants must be preserved
Graft graft(v) { for each  v’ | v’ is father of v for each  v’’ | v’’ is child of v addChild(v’, v’’); drop(v); }
Graft 1-to-1 relation is a good candidate When an optional vertex is grafted, all his children inherit the optional dash
Prune & Graft
Prune & Graft
Dimensions Determines the granularity of fact instances Time is a key dimension Snapshot Temporal
Measures Numerical attributes of the attribute tree Glossary How measure can be calculated from source scheme e.g. qty sold, no. of customers
Hierarchies Tree has already a kind of hierarchy We can still prune/graft details Add new levels for aggregation E.g. month-quarter-year Identify non-dimension attributes E.g. address
Aggregation Primary fact instances Null assumption Zero assumption Roll-up Sum, Avg, Count, Min, Max, …
Aggregation Graphical Notation Sum
Multi-Aggregation
Multi-Aggregation Order matters {week, product}    {month, type} Time-Dimension: Min Product-Dimension: Sum
Multi-Aggregation
Multi-Aggregation


Indexing
Cost Model Cost of answering a query is number of rows processed Subcubes Powerset of the dimensions
Cost Model
Indexes B-tree indexes to speed up query processing E.g. for cube ps, we can construct the following indexes I ps I sp
Example Consider Q 1 : Using subcube ps: 0,8M rows Using subcube psc: 6M rows What if we use index I sp  on subcube ps? 80 rows
Indexes Ideal situation All subcubes All indexes
Algorithms Balance space subcubes – indexes Greedy Algorithm Given a set of queries Every step select index/subcube with the highest benefit
?
References Text books Ralph Kimball, The Data Warehouse Toolkit, John Wiley and Sons, 1996 W.H. Inmon, Building the Data Warehouse, Second Edition, John Wiley and Sons, 1996 Barry Devlin, Data Warehouse from Architecture to Implementation, Addison Wesley Longman, Inc 1997 Research Papers/Whitepapers M. Golfarelli, D. Maio, S. Rizzi, The Dimensional Fact Model: a Conceptual Model for Data Warehouses, International Journal of Cooperative Information, Vol.7 (issue 2/3), pages 215-247, 1998. H. Gupta, V. Harinarayan, A. Rajaraman, J.D. Ullman, Index Selection for OLAP, Proceedings of the Thirteenth international Conference on Data Engineering,  April 07 - 11, pages 208-219, 1997. S. Luján-Mora J. Trujillo. A comprehensive method for data warehouse design. Proc. DMDW, 2003.
References (cont’d) Luján-Mora, S., Trujillo, J., and Song, I. Extending the UML for Multidimensional Modeling. Lecture Notes In Computer Science, Vol. 2460, pages 290-304., 2002. Husemann, B., Lechtenborger, J., Vossen, G.: Conceptual Data Warehouse Design. In: Proc. of the 2nd. Intl. Workshop on Design and Management of Data Warehouses (DMDW'2000), Stockholm, pages 3-9, 2000. Lehner, W., Albrecht, J., and Wedekind, H. 1998. Normal Forms for Multidimensional Databases. In Proceedings of the 10th international Conference on Scientific and Statistical Database Management (July 01 – 03), pages 63-72, 1998. Web Articles http://en.wikipedia.org/wiki/Data_warehouse http://en.wikipedia.org/wiki/Online_analytical_processing http://en.wikipedia.org/wiki/OLTP
References (cont’d) http://www.sidadelman.com/data_warehouse_applications.htm http://infolab.stanford.edu/infoseminar/Archive/FallY97/slides/ncr www.cdd.go.th/it/file/DataWarehousing_and_DataMining.pdf http://www.ciobriefings.com/whitepapers/StarSchema.asp

Data Warehouse Modeling

  • 1.
    Data Warehouse ModelingThijs Kupers Vivek Jonnaganti
  • 2.
    Agenda Introduction DataWarehousing Concepts OLAP Dimension Modeling Conceptual Modeling Indexing Conclusion
  • 3.
  • 4.
    The Evolution 1960- DSS processing using Fortron or COBOL 1970 - DBMS systems and the advent of DASD 1975 - OLTP systems facilitating faster access to data 1980 - PC/4GL technology and the advent of MIS 1985 - OLAP systems and separation of analytical processing from transactional processing 1994 - Architectured environments with integrated OLAP engines and tools
  • 5.
    What is aData Warehouse? A copy of transaction data specifically structured to Query and Analysis (Ralph Kimball, 1996) A collection of integrated, subject oriented databases designed to support the DSS function where each unit of data is relevant at some moment of time (Bill Inmon, 1991) The data characteristics of a Data Warehouse are; Subject-oriented Time-variant Non-volatile Integrated
  • 6.
    What is aData Warehouse? (cont’d) A single, complete and consistent store of data obtained from a variety of different sources made available to end users, in what they can understand and use in a business context (Barry Devlin 1992) A process of transforming data into information and making it available to users in a timely enough manner to make a difference (Forrester Research 1996)
  • 7.
    Data Warehouse Goals/CharacteristicsIt must make an organization’s information easily accessible (slicing and dicing) It must present the organization’s information consistently It must be adaptive and resilient to change It must be a secure bastion that protects our information assets It must serve as the foundation for improved decision making The business community must accept the DW, if it is to be deemed successful
  • 8.
    Data Warehouse ApplicationsRetail Industry Forecasting, Market research, Merchandising etc. Manufacturing and distribution Sales history/trends, Market demand projects etc. Banks Spot market trends, Marketing, Credit cards etc. Insurance Companies Property and casualty fraud etc. Health Care Providers Fraud detection, Patient matching etc.
  • 9.
    Data Warehouse ApplicationsGovernment Agencies Auditing tax records, information sharing across different agencies etc. Internet Companies Analyzing shopping behavior, CRM etc. Telecommunications Telemarketing, Product development etc. Sports Analyzing strategies, Winning player combinations etc.
  • 10.
    Data Warehouse SizesTerabyte (10^12) - Walmart (24 TB) Petabyte (10^15) - Geographic Information Systems Exabyte (10^18) - National Medical Association Zettabyte (10^21) - Weather Images Zottabyte (10^24) - Intelligence Agency (Video)
  • 11.
  • 12.
  • 13.
    Data Warehouse ArchitectureEnterprise Data Warehouse Data Mart Data Mart Execution Systems CRM ERP Legacy e-Commerce Reporting Tools OLAP Tools Ad Hoc Query Tools Data Mining Tools External Data Purchased Market Data Spreadsheets Oracle SQL Server Teradata DB2 Custom Tools HTML Reports Cognos Business Objects MicroStrategy Oracle Discoverer Brio Data Mining Tools Portals Data and Metadata Repository Layer Informatica PowerMart Ab Initio Data Stage Oracle Warehouse Builder Custom programs SQL scripts Extract, Transformation, and Load (ETL) Layer Cleanse Data Filter Records Standardize Values Decode Values Apply Business Rules Householding Dedupe Records Merge Records Presentation Layer ETL Layer Operational Source Systems Technologies: Metadata Repository ODS PeopleSoft SAP Siebel Oracle Applications Custom Systems Data Mart
  • 14.
    Data Warehouse StructureHighly Summarized Lightly Summarized Atomic/Detailed Departmentally Structured Individually Structured Data Warehouse Organizationally Structured Data Information
  • 15.
    Data Warehouse ArchitectureDrivers The requirements that drive the DW architecture are; Granularity of data Data retention and timeliness Reporting capability Availability Scalability
  • 16.
    Data Mart CentricData Marts Data Sources Data Warehouse
  • 17.
    Data Mart CentricIf you end up creating multiple warehouses, integrating them is a problem
  • 18.
    Data Warehouse CentricData Marts Data Sources Data Warehouse
  • 19.
  • 20.
    OLAP: 3 TierDSS Data Warehouse Database Layer Store atomic data in industry standard Data Warehouse. OLAP Engine Application Logic Layer Generate SQL execution plans in the OLAP engine to obtain OLAP functionality. Decision Support Client Presentation Layer Obtain multi-dimensional reports from the DSS Client.
  • 21.
    OLAP Servers Supportmultidimensional OLAP queries Characterized by how the underlying data is stored Multidimensional OLAP (MOLAP) Servers Data stored in array based structures e.g. Hyperion Essbase Relational OLAP (ROLAP) Servers Data stored in relational tables e.g. Microstrategy, IBM Informix Hybrid OLAP (HOLAP) Servers Data distributed between relational and specialized storage e.g. Cognos, Microsoft Analysis Services
  • 22.
    OLAP Operations Rollup;summarize operations E.g. given sales data, summarize sales for last year by product category and region Drill down; get more details E.g. given summarized sales as above, find breakup of sales within each region Slice and dice; select and project Sales of soft-drinks in Gothenburg over the last quarter Pivot; change the view of data
  • 23.
    Strengths of OLAPIt is a powerful visualization tool It provides fast, interactive response times It is good for analyzing time series It can be useful to find some clusters and outliners Many vendors offer OLAP tools
  • 24.
  • 25.
    What is DimensionalModeling? Logical design technique that seeks to present the data in a standard, intuitive framework that allows for high-performance access. Adheres to a discipline that uses the relational model with some important restrictions. Composed of one table with a multi-part key, called the fact table, and a set of smaller tables called dimension tables.
  • 26.
    DM v/s ERModels DM ER Used to design database for Online Analytical Processing (OLAP) Used to design database for Online Transaction Processing (OLTP) Support ad hoc end-user queries Support defined queries Intuitive & facilitates high-performance retrieval of data Removes redundancy of data De-normalized Normalized
  • 27.
    Fact Tables Primarytable in the DM Each row corresponds to a measurement Facts in the fact table are numeric and additive Narrow rows with a few columns Large number of rows (billions) Express many-to-many relationships between dimensions
  • 28.
    Dimension Tables Definebusiness in terms already familiar to users Implement the user interface to the DW Wide rows with lots of descriptive text Small tables (about a million rows) Joined to fact table by a foreign key Heavily indexed E.g. of typical dimensions time periods, geographic region (markets, cities), products, customers, salesperson, etc.
  • 29.
    Four Step DimensionalDesign Process Step 1 - Select the business process to model The first step in converting an ER diagram to a set of DM diagrams is to separate the ER diagram into its discrete business processes and to model each one separately. Step 2 - Choose The Grain of the Business Process The grain is the fundamental atomic level of data to be represented in the fact table.
  • 30.
    Four Step DimensionalDesign Process (cont’d) Step 3 - Designate the Fact Tables The third step is to select those many-to-many relationships in the ER model containing numeric and additive non-key facts and to designate them as fact tables. Step 4 - Choose the dimensions that will apply to each fact table record This involves de-normalizing all of the remaining tables into flat tables with single-part keys that connect directly to the fact tables.
  • 31.
  • 32.
  • 33.
  • 34.
    Slowly Changing DimensionsType 1: Overwrite the value
  • 35.
    Slowly Changing Dimensions(cont’d) Type 2: Add a Dimension row Type 3: Add a Dimension column
  • 36.
  • 37.
    Graph Theory Directed,acyclic, weakly connected graph Quasi-tree
  • 38.
    The Dimensional FactModel Fact Schemes Facts Measures Dimensions Hierarchies Dimension attributes Non-dimension attributes
  • 39.
  • 40.
  • 41.
    Why Formalize? Givemeaning to the model Tool support Transformation Algorithms CASE-Tool (Computer Aided Software Engineering)
  • 42.
    Fact Scheme Mis a set of measures A is a set of dimension attributes N is a set of non-dimension attributes R is a set of ordered couples, having the form (a i , a j ), indicating the ‘edges’ of the scheme
  • 43.
    Fact Scheme Ois a set of optional relationships S is a set of aggregation statements, in the form (m j , d i , Ω )
  • 44.
    Fact Scheme Wecall the set Dim(f) a dimension pattern. Each element in Dim(f) is a dimension
  • 45.
  • 46.
    Algorithm From ERto Conceptual Design Define Facts For each fact Build attribute tree Prune & Graft Define Dimensions Define Measures Define Hierarchies
  • 47.
  • 48.
    Define Facts EntityF Relationship R between entities E 1 …E n Transform R into an entity F Frequently updated archives are good candidates for defining facts E.g. Sale Not: Store, City Each Fact becomes a root in a fact scheme
  • 49.
  • 50.
    Build Attribute TreeEach vertex corresponds to an attribute of the scheme Root corresponds to the identifier of F
  • 51.
    Build Attribute Treeroot=newVertex(identifier(F)); translate(F, root);
  • 52.
    Build Attribute Treetranslate(E,v) { for each attribute a E | a identifier(E) addChild(v, newVertex({a})); for each entity G connected to E by a relationship R | max(E,R) = 1 { for each attribute b R addChild(v, newVertex({b})); next=newVertex(identifier(G)); addChild(v, next); translate(G, next); } }
  • 53.
    Example translate(E= SALE, v= sale ) addChild(v, qty ); addChild(v, unitPrice ); for G= PURCHASE TICKET addChild(v, ticketNumber ); translate(PURCHASE TICKET, ticketNumber ) for G= PRODUCT addChild(v, product ); translate(PRODUCT, product );
  • 54.
  • 55.
    Attribute Tree Labelthe root with the name of the entity F instead of his identifier Optional relationships not in algorithm if min(E,R)=0
  • 56.
    From ER tillConceptual Design Build attribute tree Prune & Graft Define Dimensions Define Measures Define Hierarchies
  • 57.
    Prune & GraftPrune or graft to eliminate unnecessary level of detail Pruning: Drop a subtree from the quasi-tree Grafting: Vertex contains uninteresting information but its descendants must be preserved
  • 58.
    Graft graft(v) {for each v’ | v’ is father of v for each v’’ | v’’ is child of v addChild(v’, v’’); drop(v); }
  • 59.
    Graft 1-to-1 relationis a good candidate When an optional vertex is grafted, all his children inherit the optional dash
  • 60.
  • 61.
  • 62.
    Dimensions Determines thegranularity of fact instances Time is a key dimension Snapshot Temporal
  • 63.
    Measures Numerical attributesof the attribute tree Glossary How measure can be calculated from source scheme e.g. qty sold, no. of customers
  • 64.
    Hierarchies Tree hasalready a kind of hierarchy We can still prune/graft details Add new levels for aggregation E.g. month-quarter-year Identify non-dimension attributes E.g. address
  • 65.
    Aggregation Primary factinstances Null assumption Zero assumption Roll-up Sum, Avg, Count, Min, Max, …
  • 66.
  • 67.
  • 68.
    Multi-Aggregation Order matters{week, product}  {month, type} Time-Dimension: Min Product-Dimension: Sum
  • 69.
  • 70.
  • 71.
  • 72.
  • 73.
  • 74.
  • 75.
  • 76.
  • 77.
  • 78.
    Cost Model Costof answering a query is number of rows processed Subcubes Powerset of the dimensions
  • 79.
  • 80.
    Indexes B-tree indexesto speed up query processing E.g. for cube ps, we can construct the following indexes I ps I sp
  • 81.
    Example Consider Q1 : Using subcube ps: 0,8M rows Using subcube psc: 6M rows What if we use index I sp on subcube ps? 80 rows
  • 82.
    Indexes Ideal situationAll subcubes All indexes
  • 83.
    Algorithms Balance spacesubcubes – indexes Greedy Algorithm Given a set of queries Every step select index/subcube with the highest benefit
  • 84.
  • 85.
    References Text booksRalph Kimball, The Data Warehouse Toolkit, John Wiley and Sons, 1996 W.H. Inmon, Building the Data Warehouse, Second Edition, John Wiley and Sons, 1996 Barry Devlin, Data Warehouse from Architecture to Implementation, Addison Wesley Longman, Inc 1997 Research Papers/Whitepapers M. Golfarelli, D. Maio, S. Rizzi, The Dimensional Fact Model: a Conceptual Model for Data Warehouses, International Journal of Cooperative Information, Vol.7 (issue 2/3), pages 215-247, 1998. H. Gupta, V. Harinarayan, A. Rajaraman, J.D. Ullman, Index Selection for OLAP, Proceedings of the Thirteenth international Conference on Data Engineering, April 07 - 11, pages 208-219, 1997. S. Luján-Mora J. Trujillo. A comprehensive method for data warehouse design. Proc. DMDW, 2003.
  • 86.
    References (cont’d) Luján-Mora,S., Trujillo, J., and Song, I. Extending the UML for Multidimensional Modeling. Lecture Notes In Computer Science, Vol. 2460, pages 290-304., 2002. Husemann, B., Lechtenborger, J., Vossen, G.: Conceptual Data Warehouse Design. In: Proc. of the 2nd. Intl. Workshop on Design and Management of Data Warehouses (DMDW'2000), Stockholm, pages 3-9, 2000. Lehner, W., Albrecht, J., and Wedekind, H. 1998. Normal Forms for Multidimensional Databases. In Proceedings of the 10th international Conference on Scientific and Statistical Database Management (July 01 – 03), pages 63-72, 1998. Web Articles http://en.wikipedia.org/wiki/Data_warehouse http://en.wikipedia.org/wiki/Online_analytical_processing http://en.wikipedia.org/wiki/OLTP
  • 87.
    References (cont’d) http://www.sidadelman.com/data_warehouse_applications.htmhttp://infolab.stanford.edu/infoseminar/Archive/FallY97/slides/ncr www.cdd.go.th/it/file/DataWarehousing_and_DataMining.pdf http://www.ciobriefings.com/whitepapers/StarSchema.asp