1. Oilwatch Monthly - August 2010
18 August 2010 - (next update: 15 September 2010)
Your coverage on the latest worldwide oil market developments
ASPO Netherlands
Rembrandt Koppelaar +31 (0)6 44082419
China’s oil consumption and giant oil fields oilwatchmonthly@gmail.com
Definitions www.peakoil.nl
Last year China surpassed the United States as largest energy
consuming country of the world according to the International Crude Oil, petroleum found in liquid and semi
Energy Agency. The US still consumes far more oil than China, liquid form including deepsea oil and Powered by www.theoildrum.com
however, at an average of 19 million barrels per day in the first half of lease condensates.
2010 versus 8.8 million in China. Growth in Chinese oil consumption
Liquids, all forms of liquid fuels including
has remained quite strong throughout the years at an average of 7% conventional, heavy, and extra heavy oil,
since 2003 while US consumption initially was stable around 20.7 oil shale, oil sands, natural gas liquids, lease
million b/d until the economic crisis caused a consumption decline. condensates, gas-to-liquids, coal-to-liquids,
If the current pace of Chinese growth could be continued and US and biofuels. Newsletter Index
consumption would stabilize it would take at least until 2020 for
China to surpass US oil consumption levels. One Barrel of oil is equivalent to 159 litres
Page 2 - 4: World Oil Production
Page 5: OPEC Oil Production
That change alone would require at least 10 million barrels of
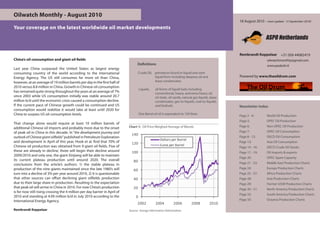
Chart 1: Oil Price Weighed Average of Blends Page 6: Non-OPEC Oil Production
additional Chinese oil imports and probably more due to the onset
of peak oil in China in this decade. In “the development journey and Page 7: OPEC Oil Consumption
140
outlook of Chinese giant oilfields” published in Petroleum Exploration Page 8 - 12: OECD Oil Consumption
Dollars per Barrel
and development in April of this year, Hook et al. find that 70% of 120 Page 13: Asia Oil Consumption
Chinese oil production was obtained from 9 giant oil fields. Five of Euros per Barrel
Page 14 - 16: OECD Crude Oil Stocks
these are already in decline, three will begin their decline around 100 Page 17 - 19: Oil Imports & exports
2009/2010 and only one, the giant Xinjiang will be able to maintain
Page 20: OPEC Spare Capacity
its current plateau production until around 2020. The overall 80
conclusions from the article’s authors: 1) the stable plateau in Page 21 - 23: Middle East Production Charts
production of the nine giants maintained since the late 1980’s will Page 24: Europe Production Charts
60
turn into a decline of 3% per year around 2010, 2) It is questionable Page 25 - 27: Africa Production Charts
that other sources can offset declining giant oilfields production 40 Page 28: Asia Production Charts
due to their large share in production. Resulting in the expectation Page 29: Former USSR Production Charts
that peak oil will arrive in China in 2010. For now China’s production 20 Page 30 - 31: North America Production Charts
is for now still rising crossing the 4 million per day barrier in April of
Page 32: South America Production Charts
2010 and standing at 4.09 million b/d in July 2010 according to the 0
International Energy Agency. Page 33: Oceania Production Charts
2002 2004 2006 2008 2010
Rembrandt Koppelaar Source: Energy Information Admistration
2. ASPO Netherlands World Oil Production
World liquid fuels production World biofuels production World oil production capacity
In July 2010 world production of all liquid fuels increased by Total world biofuels production in June 2010 is estimated at 1.84 Total oil production capacity in July 2010 increased by 820,000 b/d
860,000 b/d from June according to the latest fgures of the million b/d according to biofuel statistics of the International from June 2010 from 90.16 to 90.98 million b/d. World production
International Energy Agency (IEA). Resulting in total world liquid Energy Agency. capacity is measured here as the sum of world liquids production
fuels production of 87.22 million b/d. Liquids production for June excluding biofuels plus total OPEC spare capacity excluding Iraq,
2010 was revised upwards in the IEA Oil Market Report of August Venezuela and Nigeria.
from 86.15 to 86.36 million b/d. Average global liquid fuels
production in 2009 was 84.94 versus 86.6 and 85.32 million b/d
in 2008 and 2007.
Chart 2: Liquids Production January 2004 - July 2010 Chart 3: World Biofuels Production Jan. 2004 - July 2010 Chart 4: World Production Capacity Jan. 2003 - July 2010
90 2.0 94
1.8 92
88 90
1.6
88
1.4
Million barrels per day
86 86
1.2 84
84 1.0 82
0.8 80
82 78
0.6
76
Liquids (IEA) 0.4
80 74
Liquids (EIA) Biofuels (IEA) World Liquids Prod. excl. Biofuels (IEA)
0.2 72
World Production Capacity (IEA)
78 0.0 70
2004 2005 2006 2007 2008 2009 2010 2004 2005 2006 2007 2008 2009 2010 2003 2004 2005 2006 2007 2008 2009 2010
Source: International Energy Agency Source: IEA, EIA, Source: Energy Information Administration
Page 2
3. World Oil Production ASPO Netherlands
EIA liquids versus IEA liquids excluding biofuels production World crude oil production World natural gas liquids production
Liquid fuels production figures published by the Energy Latest figures from the Energy Information Administration (EIA) Natural Gas Liquids production from natural gas fields increased
Information Administration in their International Petroleum show that crude oil production including lease condensates 89,000 b/d from April to May 2010 according to the latest
Monthly excludes biofuels produced in countries beside the decreased by 103,000 b/d from April to May 2010. Resulting in International Petroleum Monthly of the Energy Information
United States and Brazil. The remaining difference is caused total production of crude oil including lease condensates of 73.34 Administration (EIA). Resulting in total NGL production of 8.56
by discrepancies between natural gas liquids and Canadian million b/d. million b/d.
unconventional oil production.
Chart 5: EIA & EIA Liquids Comparison Jan. 2004 - July 2010 Chart 6: Crude Oil Production January 2004 - May 2010 Chart 7: Nat. Gas Liquids Production Jan. 2004 - May 2010
88 75 9.0
87
74 8.5
86
85
Million barrels per day
73 8.0
84
83 72 7.5
82
71 7.0
81
80 Liquids excluding biofuels (IEA)
70 6.5
Crude Oil (EIA) Natural Gas Liquids (EIA)
Liquids (EIA)
79
78 69 6.0
2004 2005 2006 2007 2008 2009 2010 2004 2005 2006 2007 2008 2009 2010 2004 2005 2006 2007 2008 2009 2010
Source: Energy Information Administration Source: Energy Information Administration Source: Energy Information Administration
Page 3
4. ASPO Netherlands World Oil Production
World conventional crude versus liquids production ratio World unconventional liquid fuels production World energy content from liquid fuels production
Approximately 85% of world liquid fuels production in 2008 came In 2008 the biggest part of unconventional liquid fuels production In production statistics all liquid fuels are aggregated as total
from conventional crude oil including lease condensates. The came from Natural Gas Liquids at 11% or 7.94 million b/d. ‘oil’ production while containing different amounts of energy
remaining share of 15% was produced by unconventional sources Secondly, extra heavy crude and bitumen at 3.4% or 2.68 million per barrel produced. For example, a barrel of crude oil contains
including Biofuels, Extra Heavy Oil, Tar Sands, Polar Oil and Natural b/d of which 1.27 million b/d from Canadian oil sands and 1.41 around 5.8 million British Thermal Units while a similar barrel of
Gas Liquids. In absolute amounts unconventional production has million b/d from other sources. Thirdly, Biofuels at 1.8% or 1.45 natural gas liquids contains 4.2 million BTU. Conversion to BTU’s
increased steadily, from 4 million b/d at the end of the 1970s, to million b/d. A and finally Polar Oil at a production rate of 840,000 shows that actual available energy worldwide in January 2010
approximately 12.9 mb/d in 2008, excluding lease condensates. b/d in 2008 or 1.1% of total liquids supply. was 3.3% lower than liquids statistics counted in barrels would
suggest.
Chart 8: World Crude and Liquids production 1938 - 2008 Chart 9: Unconventional Oil Production 1938 - 2008 Chart 10: World Production in BTU January 2003 - July 2010
100 14 550
Liquids Biofuels Biofuels
90 X-Heavy crude (excl. Canada)
Conventional crude 525 Natural Gas Liquids
12 Canadian Oil Sands
80 Polar Oil Crude Oil
Natural Gas Liquids 500
70 10
Million barrels per day
Trillion BTU per day
475
60
8
50 450
6
40
425
30 4
400
20
2 375
10
0 0 350
1938 1948 1958 1968 1978 1988 1998 2008 1938 1948 1958 1968 1978 1988 1998 2008 2003 2004 2005 2006 2007 2008 2009 2010
Source: International Energy Agency & Energy Information Administration Source: EIA, EIA & CAPP Source: International Energy Agency
Page 4
5. OPEC Oil Production ASPO Netherlands
OPEC liquid fuels production & production capacity OPEC crude oil production OPEC natural gas liquids production
Total liquid fuels production in OPEC countries increased by Total crude oil production excluding lease condensates of the OPEC natural gas liquids remained stable from June to July 2010
230,000 b/d from June to July 2010 to a level of 34.28 million OPEC cartel increased by 230,000 b/d to a level of 29.2 million b/d, at a level of 5.08 million b/d. Average OPEC natural gas liquids
b/d. Liquids production for June 2010 was revised upwards in from June to July 2010, according to the latest available estimate production in 2009 was 4.67 million b/d, versus 4.47 and 4.55
the IEA Oil Market Report of August from 33.97 to 34.05 million of the IEA. Average crude oil production in 2009 was 28.7 million million b/d in respectively 2008 and 2007.
b/d. Average liquid fuels production in 2009 was 33.7 million b/d, b/d, versus 31.43 and 30.37 million b/d in respectively 2008 and
versus 36.09 and 35.02 million b/d in respectively 2008 and 2007. 2007.
All time high production of OPEC liquid fuels stands at 36.4 million
b/d reached in July 2008.
Chart 11: OPEC Liquids Production Jan. 2004 - July 2010 Chart 12: OPEC Crude Oil Production Jan. 2004 - July 2010 Chart 13: OPEC NGL Production January 2004 - July 2010
38 33 5.5
37 32
5.0
36
31
Million barrels per day
35 4.5
30
34
29 4.0
33
28
32 3.5
27
31
Liquids (IEA) Crude Oil (IEA) 3.0 Natural Gas Liquids (IEA)
30 Liquids (EIA) 26 Crude Oil (EIA) Natural Gas Liquids (EIA)
29 25 2.5
2004 2005 2006 2007 2008 2009 2010 2004 2005 2006 2007 2008 2009 2010 2004 2005 2006 2007 2008 2009 2010
Source: International Energy Agency & Energy Information Administration Source: Energy Information Administration Source: Energy Information Administration
Page 5
6. ASPO Netherlands Non-OPEC Oil Production
Non-OPEC liquid fuels production Non-OPEC crude oil production Non-OPEC natural gas liquids production
Total liquid fuels production excluding biofuels in Non-OPEC Total Non-OPEC crude oil production including lease condensates Non-OPEC natural gas liquids production increased by 8,000 b/d
countries increased by 580,000 b/d from June to July 2010. decreased by 165,000 b/d to a level of 42.23 million b/d, from from April to May 2010 to a level of 3.38 million b/d. Average Non-
Resulting in a production level of 51.11 million b/d according to April to May 2010, according to the latest available estimate of the OPEC natural gas liquids production in 2009 was 3.34 million b/d,
the International Energy Agency. Liquids production for June EIA. Crude oil production for April 2010 was revised downwards in versus 3.65 and 3.79 million b/d in respectively 2008 and 2007.
2010 was revised upwards in the IEA Oil Market Report of August the EIA International Petroleum Monthly of August from 42.48 to
from 50.38 to 50.52 million b/d. Average liquid fuels production in 42.40 million b/d. Average crude oil production in 2009 was 41.61
2009 was 49.67 million b/d, versus 49.32 and 49.34 million b/d in million b/d, versus 41.32 and 41.80 million b/d in respectively
respectively 2008 and 2007. 2008 and 2007.
Chart 14: Non-OPEC Liquids Production Jan. 2004 - July 2010 Chart 15: Non-OPEC Crude Oil Production Jan. 2004 - May 2010 Chart 16: Non-OPEC NGL Production January 2004 - May 2010
52 43.0 4.5
42.5
51
4.0
42.0
50
Million barrels per day
41.5
3.5
49
41.0
48
3.0
40.5
47
40.0
2.5
46 Liquids (IEA) Crude oil (EIA) Natural Gas Liquids (EIA)
39.5
Liquids (EIA)
45 39.0 2.0
2004 2005 2006 2007 2008 2009 2010 2004 2005 2006 2007 2008 2009 2010 2004 2005 2006 2007 2008 2009 2010
Source: International Energy Agency & Energy Information Administration Source: Energy Information Administration Source: Energy Information Administration
Page 6
7. OPEC Oil Consumption ASPO Netherlands
OPEC oil consumption Iran oil consumption Saudi Arabia oil consumption
Oil consumption in all OPEC oil producers combined increased by Oil consumption in Iran decreased by 5,000 b/d from April to May Oil consumption in Saudi Arabia increased by 159,000 b/d from
6,000 b/d from April to May 2010. Resulting in a consumption level 2010 to a level of 1.50 million b/d. Average Iranian oil consumption April to May 2010 to a level of 2.04 million b/d. Average Saudi
of 6.28 million b/d. Average OPEC oil consumption in 2009 was in 2009 was 1.52 million b/d, versus 1.64 and 1.52 million b/d in Arabian oil consumption in 2009 was 1.82 million b/d, versus 1.65
5.94 million b/d, versus 5.76 and 5.30 million b/d in respectively respectively 2008 and 2007. and 1.52 million b/d in respectively 2008 and 2007.
2008 and 2007.
Chart 17: OPEC Oil Consumption January 2004 - May 2010 Chart 18: Iran Oil Consumption January 2004 - May 2010 Chart 19: Saudi Arabia Oil Consumption Jan. 2004 - May 2010
7 2.4 2.6
2.2 2.4
6
2.0 2.2
Million barrels per day
5 2.0
1.8
1.8
4 1.6
1.6
1.4
3
1.4
1.2
2 1.2
1.0
1.0
1 0.8
0.8
0.6
0 0.6
2004 2005 2006 2007 2008 2009 2010 0.4 0.4
Iran oil consumption (JODI) Saudi Arabia oil consumption (JODI)
Iraq Venezuela
UAE Saudi Arabia 0.2 0.2
Qatar Nigeria
Libya Kuwait
Iran Ecuador 0.0 0.0
Angola Algeria
12m rolling average 2004 2005 2006 2007 2008 2009 2010 2004 2005 2006 2007 2008 2009 2010
Source: Joint Oil Data Initiative Source: Joint Oil Data Initiative Source: Joint Oil Data Initiative
Page 7
8. ASPO Netherlands OECD Oil Consumption
OECD oil consumption North America oil consumption European Union oil consumption
Oil consumption in OECD countries decreased by 500,000 b/d Oil consumption in North America increased by 1.0 million b/d Oil consumption in the European Union decreased by 785,000 b/d
from April to May 2010. Resulting in a consumption level of 43.43 from April to May 2010. Resulting in a consumption level of from April to May 2010. Resulting in a consumption level of 12.48
million b/d. Average OECD oil consumption in 2009 was 43.92 23.84 million b/d. Average oil consumption in North America in million b/d according to JODI statistics. Average consumption in
million b/d, versus 46.10 and 47.68 million b/d in respectively 2009 was 22.51 million b/d, versus 23.50 and 24.72 million b/d in the European Union in 2009 was 13.6 million b/d, versus 14.25
2008 and 2007. respectively 2008 and 2007. and 14.32 million b/d in respectively 2008 and 2007.
Chart 20: OECD Oil Consumption January 2004 - May 2010 Chart 21: North America Oil Consumption Jan. 2004 - May 2010 Chart 22: EU-27 Oil Consumption January 2004 - May 2010
52.0 26.6 15.6
51.0
26.0 15.2
50.0
25.4
49.0 14.8
48.0 24.8
14.4
Million barrels per day
47.0 24.2
14.0
46.0
23.6
45.0 13.6
23.0
44.0
13.2
43.0 22.4
42.0 12.8
21.8
41.0 12.4
21.2
40.0 OECD oil consumption (JODI) North America oil consumption (JODI) EU-27 oil consumption (JODI)
20.6 12.0
39.0
38.0 20.0 11.6
2004 2005 2006 2007 2008 2009 2010 2004 2005 2006 2007 2008 2009 2010 2004 2005 2006 2007 2008 2009 2010
Source: Joint Oil Data Initiative Source: Joint Oil Data Initiative Source: Joint Oil Data Initiative
Page 8
9. OECD Oil Consumption ASPO Netherlands
United States oil consumption Mexico oil consumption Canada oil consumption
Oil consumption in the US increased by 744,000 b/d from April to Oil consumption in Mexico increased by 65,000 b/d from April to Oil consumption in Canada increased by 197,000 b/d from April
May 2010. Resulting in a consumption level of 19.66 million b/d. May 2010. Resulting in a consumption level of 1.92 million b/d. to May 2010. Resulting in a consumption level of 2.26 million b/d.
Average consumption of oil in the US in 2009 was 18.68 million Average oil consumption in Mexico in 2009 was 1.87 million b/d, Average consumption in Canada in 2009 was 1.96 million b/d,
b/d, versus 19.50 and 20.70 million b/d in respectively 2008 and versus 1.95 and 1.94 million b/d in respectively 2008 and 2007. versus 2.06 and 2.08 million b/d in respectively 2008 and 2007.
2007.
Chart 23: US Oil Consumption January 2004 - May 2010 Chart 24: Mexico Oil Consumption Jan. 2004 - May 2010 Chart 25: Canada Oil Consumption January 2004 - May 2010
22 2.3 2.3
21 2.2 2.2
2.1
20 2.1
Million barrels per day
2.0
19 2.0
1.9
18 1.9
1.8
17 1.8
1.7
16 1.7 Canada oil consumption (JODI)
US oil consumption (JODI) 1.6 Mexico oil consumption (JODI)
15 1.5 1.6
2004 2005 2006 2007 2008 2009 2010 2004 2005 2006 2007 2008 2009 2010 2004 2005 2006 2007 2008 2009 2010
Source: Joint Oil Data Initiative Source: Joint Oil Data Initiative Source: Joint Oil Data Initiative
Page 9
10. ASPO Netherlands OECD Oil Consumption
France oil consumption Germany oil consumption Italy oil consumption
Oil consumption in France decreased by 162,000 b/d from April Oil consumption in Germany increased by 126,000 b/d from April Oil consumption in Italy decreased by 61,000 b/d from April to
to May 2010. Resulting in a consumption level of 1.66 million b/d. to May 2010. Resulting in a consumption level of 2.38 million b/d. May 2010. Resulting in a consumption level of 1.40 million b/d.
Average consumption of oil in France in 2009 was 1.84 million b/d, Average oil consumption in Germany in 2009 was 2.42 million b/d, Average consumption in Italy in 2009 was 1.53 million b/d, versus
versus 1.94 and 1.94 million b/d in respectively 2008 and 2007. versus 2.56 and 2.47 million b/d in respectively 2008 and 2007. 1.60 and 1.67 million b/d in respectively 2008 and 2007.
Chart 26: France Oil Consumption January 2004 - May 2010 Chart 27: Germany Oil Consumption Jan. 2004 - May 2010 Chart 28: Italy Oil Consumption January 2004 - May 2010
2.3 3.0 2.2
2.9 2.1
2.2
2.8 2.0
2.1 2.7 1.9
Million barrels per day
2.6 1.8
2.0
2.5 1.7
1.9 2.4 1.6
2.3 1.5
1.8
2.2 1.4
1.7 2.1 1.3
2.0 1.2
1.6 France oil consumption (JODI) Germany oil consumption (JODI) Italy oil consumption (JODI)
1.9 1.1
1.5 1.8 1.0
2004 2005 2006 2007 2008 2009 2010 2004 2005 2006 2007 2008 2009 2010 2004 2005 2006 2007 2008 2009 2010
Source: Joint Oil Data Initiative Source: Joint Oil Data Initiative Source: Joint Oil Data Initiative
Page 10
11. OECD Oil Consumption ASPO Netherlands
Spain oil consumption United Kingdom oil consumption Poland oil consumption
Oil consumption in Spain decreased by 64,000 b/d from April to Oil consumption in the United Kingdom decreased by 122,000 Oil consumption in Poland increased by 31,000 from April to May
May 2010. Resulting in a consumption level of 1.36 million b/d. b/d from April to May 2010. Resulting in a consumption level of 2010. Resulting in a consumption level of 531,000 b/d. Average
Average oil consumption in Spain in 2009 was 1.46 million b/d, 1.41 million b/d. Average oil consumption in the United Kingdom consumption in Poland in 2009 was 530,000 b/d, versus 527,000
versus 1.54 and 1.59 million b/d in respectively 2008 and 2007. in 2009 was 1.57 million b/d, versus 1.61 and 1.67 million b/d in and 507,000 b/d in respectively 2008 and 2007.
respectively 2008 and 2007.
Chart 29: Spain Oil Consumption January 2004 - May 2010 Chart 30: UK Oil Consumption Jan. 2004 - May 2010 Chart 31: Poland Oil Consumption January 2004 - May 2010
1.8 2.2 0.8
2.1
0.7
1.7 2.0
1.9 0.6
Million barrels per day
1.6 1.8
0.5
1.7
1.5 1.6 0.4
1.5
0.3
1.4 1.4
1.3 0.2
1.3 1.2
Spain oil consumption (JODI) UK oil consumption (JODI) 0.1 Poland oil consumption (JODI)
1.1
1.2 1.0 0.0
2004 2005 2006 2007 2008 2009 2010 2004 2005 2006 2007 2008 2009 2010 2004 2005 2006 2007 2008 2009 2010
Source: Joint Oil Data Initiative Source: Joint Oil Data Initiative Source: Joint Oil Data Initiative
Page 11
12. ASPO Netherlands OECD Oil Consumption
Netherlands oil consumption Japan oil consumption South Korea oil consumption
Oil consumption in the Netherlands decreased by 386,000 b/d Oil consumption in Japan decreased by 489,000 b/d from April Oil consumption in South Korea decreased by 115,000 b/d from
from April to May 2010 to a consumption level of 727,000 million to May 2010. Resulting in a consumption level of 3.92 million b/d. April to May 2010. Resulting in a consumption level of 2.15 million
b/d. Average oil consumption in the Netherlands in 2009 was Average oil consumption in Japan in 2009 was 4.43 million b/d, b/d. Average consumption in South Korea in 2009 was 2.25
905,000 b/d, versus 945,000 and 920,0000 b/d in respectively versus 4.92 and 5.13 million b/d in respectively 2008 and 2007. million b/d, versus 2.21 and 2.29 million b/d in respectively 2008
2008 and 2007. and 2007.
Chart 32: Netherlands Oil Consumption Jan. 2004 - May 2010 Chart 33: Japan Oil Consumption Jan. 2004 - May 2010 Chart 34: South Korea Oil Consumption Jan. 2004 - May 2010
1.2 7.0 3.0
6.5 2.8
1.1
6.0 2.6
Million barrels per day
1.0
5.5 2.4
0.9 5.0 2.2
4.5 2.0
0.8
4.0 1.8
0.7
Netherlands oil consumption (JODI) 3.5 Japan oil consumption (JODI) 1.6 South Korea oil consumption (JODI)
0.6 3.0 1.4
2004 2005 2006 2007 2008 2009 2010 2004 2005 2006 2007 2008 2009 2010 2004 2005 2006 2007 2008 2009 2010
Source: Joint Oil Data Initiative Source: Joint Oil Data Initiative Source: Joint Oil Data Initiative
Page 12
13. Asia Oil Consumption ASPO Netherlands
China oil consumption India oil consumption Taiwan oil consumption
Oil consumption in China decreased by 24,000 b/d from April to Oil consumption in India decreased by 40,000 b/d from April to Oil consumption in Taiwan decreased by 27,000 b/d from April to
May 2010. Resulting in a consumption level of 9.12 million b/d May 2010. Resulting in a consumption level of 3.03 million b/d. May 2010. Resulting in a consumption level of 1.03 million b/d.
according to JODI statistics. Average oil consumption in China Average oil consumption in India in 2009 was 2.85 million b/d, Average consumption in Taiwan in 2009 was 976,000 b/d, versus
in 2009 was 8.05 million b/d, versus 6.92 and 7.29 million b/d in versus 2.60 and 2.43 million b/d in respectively 2008 and 2007. 978,000 and 958,000 b/d in respectively 2008 and 2007.
respectively 2008 and 2007.
Chart 35: China Oil Consumption January 2004 - May 2010 Chart 36: India Oil Consumption Jan. 2004 - May 2010 Chart 37: Taiwan Oil Consumption January 2004 - May 2010
10.0 3.4 1.4
9.5 3.2 1.3
9.0 3.0
1.2
8.5
2.8
1.1
Million barrels per day
8.0
2.6
7.5 1.0
2.4
7.0 0.9
2.2
6.5 0.8
2.0
6.0
0.7
1.8
5.5
0.6
5.0 1.6
China oil consumption (JODI) India oil consumption (JODI) Taiwan oil consumption (JODI)
4.5 1.4 0.5
4.0 1.2 0.4
2004 2005 2006 2007 2008 2009 2010 2004 2005 2006 2007 2008 2009 2010 2004 2005 2006 2007 2008 2009 2010
Source: Joint Oil Data Initiative Source: Joint Oil Data Initiative Source: Joint Oil Data Initiative
Page 13
14. ASPO Netherlands OECD Crude Oil Stocks
OECD crude oil stocks OECD product stocks Europe crude oil stocks
Industrial inventories of crude oil in the OECD in June 2010 Industrial product stocks in the OECD in June 2010 increased to Industrial inventories of crude oil in OECD Europe in June 2010
decreased to 1016 million from 1028 million barrels in May 1440 million from 1435 million barrels in May according to the decreased to 339 from 357 million barrels in May according to
according to the latest IEA statistics. Current OECD crude oil latest IEA Statistics. Current OECD product stocks are 30 million the latest IEA statistics. Current OECD Europe crude oil stocks are
stocks are 46 million barrels higher than the five year average of barrels higher than the five year average of 1410 million barrels. 3 million barrels higher than the five year average of 336 million
970 million barrels. In the July Oil Market Report of the IEA a total In the July Oil Market Report of the IEA a total stock level of 1417 barrels. In the July Oil Market Report of the IEA a total stock level of
stock level of 1041 million barrels was tabulated for May which million barrels was tabulated for May which has been revised 360 million barrels was tabulated for May which has been revised
has been revised downward to 1028 million barrels in the August upward to 1435 million barrels in the August edition. downward to 357 million barrels in the August edition.
edition.
Chart 38: OECD Crude Oil Stocks January 2004 - June 2010 Chart 39: OECD Product Stocks January 2004 - June 2010 Chart 40: Europe Crude Oil Stocks January 2004 - June 2010
1200 1600 425
400
1100 1500
375
1000 1400 350
Million barrels
325
900 1300
300
800 1200 275
250
700 1100
OECD crude oil stocks (IEA) OECD product stocks (IEA) Europe crude oil stocks (IEA)
225
600 1000 200
2003 2004 2005 2006 2007 2008 2009 2010 2003 2004 2005 2006 2007 2008 2009 2010 2003 2004 2005 2006 2007 2008 2009 2010
Source: International Energy Agency Source: International Energy Agency Source: International Energy Agency
Page 14
15. OECD Crude Oil Stocks ASPO Netherlands
Europe product stocks Pacific crude oil stocks Pacific product stocks
Industrial product stocks in OECD Europe in June 2010 increased Industrial inventories of crude oil in OECD Pacific in June 2010 Industrial product stocks in OECD Pacific in June 2010 increased
to 564 million from 568 million barrels in May according to the increased to a level of 168 from 166 million barrels in May to a level of 168 from 167 million barrels in May according to the
latest IEA statistics. Current OECD Europe product stocks are 9 according to the latest IEA statistics. Current OECD Pacific crude latest IEA Statistics. Current OECD Pacific product stocks are 11
million barrels higher than the five year average of 555 million oil stocks are equal to the five year average of 168 million barrels. million barrels lower than the five year average of 179 million
barrels. In the July Oil Market Report of the IEA a total stock level In the July Oil Market Report of the IEA a total stock level of 175 barrels. In the July Oil Market Report of the IEA a total stock level
of 573 million barrels was tabulated for May which has been million barrels was tabulated for June which has been revised of 167 million barrels was tabulated for May which remained
revised downward to 568 million barrels in the August edition. downward to 166 million barrels in the August edition. unchanged in the August edition.
Chart 41: Europe Product Stocks January 2004 - June 2010 Chart 42: Pacific Crude Oil Stocks January 2004 - June 2010 Chart 43: Pacific Product Stocks January 2004 - June 2010
650 250 250
625
225
225
600
200
575
200
175
550
Million barrels
525 150 175
500
125
150
475
100
450
125
Europe product stocks (IEA) Pacific crude oil stocks (IEA) Pacific product stocks (IEA)
75
425
400 50 100
2003 2004 2005 2006 2007 2008 2009 2010 2003 2004 2005 2006 2007 2008 2009 2010 2003 2004 2005 2006 2007 2008 2009 2010
Source: International Energy Agency Source: International Energy Agency Source: International Energy Agency
Page 15
16. ASPO Netherlands OECD Crude Oil Stocks
North America crude oil stocks North America product stocks US gasoline stocks
Industrial inventories of crude oil in OECD North America in June Industrial product stocks in North America in June 2010 increased Gasoline stocks in the United States in July 2010 increased to 222
2010 increased to 508 from 505 million barrels in May according to 708 million from 700 million barrels in May according to the million from 218 million barrels in June according to the latest EIA
to the latest IEA statistics. Current OECD North America crude oil latest IEA Statistics. Current North American product stocks are Statistics. Current Gasoline stocks are 12 million barrels higher
stocks are 42 million barrels higher than the five year average of 32 million barrels higher than the five year average of 676 million than the five year average of 210 million barrels.
466 million barrels. In the July Oil Market Report of the IEA a total barrels. In the July Oil Market Report of the IEA a total stock level of
stock level of 506 million barrels was tabulated for May which 677 million barrels was tabulated for May which has been revised
has been revised downward to 505 million barrels in the August upward to 700 million barrels in the August edition.
edition.
Chart 44: North America Crude Oil Stocks Jan. 2004 - June 2010 Chart 45: North America Product Stocks Jan. 2004 - June 2010 Chart 46: United States Gasoline Stocks Jan. 2004 - July 2010
600 800 300
575
750 275
550
525
250
500 700
475 225
Million barrels
450 650
425 200
400 600
175
375
350 550
150
325
300 500 North America product stocks (IEA) US gasoline stocks (EIA)
North America crude oil stocks (IEA) 125
275
250 450 100
2003 2004 2005 2006 2007 2008 2009 2010 2003 2004 2005 2006 2007 2008 2009 2010 2003 2004 2005 2006 2007 2008 2009 2010
Source: International Energy Agency Source: International Energy Agency Source: Energy Information Administration
Page 16
17. Oil Imports & Exports ASPO Netherlands
Mexico oil exports United Kingdom oil exports Norway oil exports
Crude oil exports from Mexico decreased by 10,000 b/d from 2nd Crude oil exports from the United Kingdom decreased by 246,000 Oil exports from Norway increased by 130,000 b/d from 2nd qrt.
qrt. 2009 to 3rd qrt. 2009 to a level of 1.32 million b/d. Average b/d from 2nd qrt. 2009 to 3rd qrt. 2009 to a level of 768,000 b/d. 2009 to 3rd qrt. 2009 to a level of 1.73 million b/d. Average oil
oil export from Mexico in 2009 up to the 3rd qrt. was 1.35 million Average oil export from the United Kingdom in 2009 up to the export from Norway in 2009 up to the 3rd qrt. was 1.74 million
b/d, versus 1.55, 1.85, and 2.04 million b/d in respectively 2008, 3rd qrt. was 886,000 b/d, versus 957,000 b/d, 1.02, and1.0 million b/d, versus 1.67, 1.97, and 2.17 million b/d in respectively 2008,
2007 and 2006. b/d in respectively 2008, 2007 and 2006. Since 2004 the United 2007 and 2006.
Kingdom became a net importer of oil. Net imports were 387,000
b/d in 3rd qrt. 2009.
Chart 47: Mexico oil exports 1st qrt. 2002 - 3rd qrt. 2009 Chart 48: UK oil exports 1st qrt. 2002 - 3rd qrt. 2009 Chart 49: Norway oil exports 1st qrt. 2002 - 3rd qrt. 2009
4.0 3.0 3.6
2.8 3.4
3.5 2.6 3.2
2.4 3.0
3.0 2.2
2.8
Million barrels per day
2.0
2.6
2.5
1.8
2.4
1.6
2.0 2.2
1.4
2.0
1.2
1.5
1.8
1.0
1.6
1.0 0.8
0.6 1.4
Liquids exports (IEA) Liquids exports (IEA) Liquids exports (IEA)
0.4 1.2
0.5 Liquids Production (IEA)
Liquids Production (IEA) Liquids Production (IEA)
0.2 Liquids imports (IEA) 1.0
0.0 0.0 0.8
2002 2003 2004 2005 2006 2007 2008 2009 2002 2003 2004 2005 2006 2007 2008 2009 2002 2003 2004 2005 2006 2007 2008 2009
Source: International Energy Agency Source: International Energy Agency Source: International Energy Agency
Page 17
18. ASPO Netherlands Oil Imports & Exports
Denmark oil exports Australia oil exports Japan oil imports
Oil exports from Denmark increased by 29,000 b/d from 2nd qrt. Oil exports from Australia increased by 14,000 b/d from 2nd qrt. Oil imports in Japan remained stable at 3.43 million b/d from 2nd
to 3rd qrt. 2009 to a level of 212,000 b/d. Average oil export from to 3rd qrt. 2009 to a level of 255,000 b/d. Average oil export from qrt. to 3rd qrt. 2009. Average oil import in Japan in 2009 up to 3rd
Denmark in 2009 up to 3rd qrt. was 187,000 b/d, versus,184,000, Australia in 2009 up to 3rd qrt. was 252,000 b/d, versus 270,000, qrt. was 3.58 million b/d, versus 4.12, 4.09 and 4.15 million b/d in
191,000 and 233,000 b/d in respectively 2008, 2007, and 2006. 252,000 b/d and 217,000 b/d in respectively 2008, 2007, and respectively 2008, 2007, and 2006.
2006.
Chart 50: Denmark oil exports 1st qrt. 2002 - 3rd qrt. 2009 Chart 51: Australia oil exports 1st qrt. 2002 - 3rd qrt. 2009 Chart 52: Japan Oil Imports 1st qrt. 2002 - 3rd qrt. 2009
0.60 1.0 5.0
Liquids exports (IEA) Liquids exports (IEA)
0.55 0.9
Liquids Production (IEA) Liquids Production (IEA) 4.8
0.50 Liquids imports (IEA)
0.8 Liquids imports (IEA)
4.6
0.45
0.7
Million barrels per day
0.40 4.4
0.35 0.6
4.2
0.30 0.5
4.0
0.25 0.4
0.20 3.8
0.3
0.15
3.6
0.2
0.10
Liquids (IEA)
0.1 3.4
0.05
0.00 0.0 3.2
2002 2003 2004 2005 2006 2007 2008 2009 2002 2003 2004 2005 2006 2007 2008 2009 2002 2003 2004 2005 2006 2007 2008 2009
Source: International Energy Agency Source: International Energy Agency Source: International Energy Agency
Page 18
19. Oil Imports & Exports ASPO Netherlands
OECD oil imports United States oil imports OECD Europe oil imports
Oil imports in the group of OECD countries increased by 395,000 Oil imports in the United States increased by 78,000 b/d from 2nd Oil imports from OECD Europe decreased by 14,000 b/d from 2nd
million b/d from 2nd qrt. to 3rd qrt. 2009 to a level of 29.84 million qrt. to 3rd qrt. 2009 to a level of 10.64 million b/d. Average oil qrt. to 3rd qrt. 2009 to a level of 12.02 million b/d. Average oil
b/d. Average oil import in OECD countries in 2009 up to 3rd qrt. import in the United States in 2009 up to 3rd qrt. was 10.68 million import in OECD Europe in 2009 up to 3rd qrt. was 12.01 million
was 29.91 million b/d, versus 32.19, 32.47 and 32.7 million b/d in b/d, versus 11.43, 11.55 and 11.77 million b/d in respectively 2008, b/d, versus 12.98, 13.05 and 13.18 million b/d in respectively
respectively 2008, 2007, and 2006. 2007, and 2006. 2008, 2007, and 2006.
Chart 53: OECD Oil Imports 1st qrt. 2002 - 3rd qrt. 2009 Chart 54: USA Oil Imports 1st qrt. 2002 - 3rd qrt. 2009 Chart 55: OECD Europe Oil Imports 1st qrt. 2002 - 3rd qrt. 2009
34.0 13.0 14.0
33.5
12.5
13.5
33.0
12.0
32.5
Million barrels per day
13.0
11.5
32.0
31.5 11.0 12.5
31.0
10.5
12.0
30.5
10.0
30.0
Liquids (IEA) 11.5
Liquids (IEA) Liquids (IEA)
9.5
29.5
29.0 9.0 11.0
2002 2003 2004 2005 2006 2007 2008 2009 2002 2003 2004 2005 2006 2007 2008 2009 2002 2003 2004 2005 2006 2007 2008 2009
Source: International Energy Agency Source: International Energy Agency Source: International Energy Agency
Page 19