Downloaded 118 times


![government bonds.” But lending by banks picks up, especially
ExHIBIT 2-7 to creditworthy institutional clients and REITs—“where they feel
Sales of Large Commercial Properties confident about getting a return”—on longer-term, recourse
loans with higher reserves. Bankers also structure syndica-
$120
tions for reducing risk, while construction lending concentrates
Latin America on multifamily. “Spec projects need not apply,” and borrowers
$100 must fork over “at least 20 percent cash equity” to qualify. Some
borrowers point to “schizoid” bank approaches where well-cap-
Canada
italized opportunity funds can score “ample leverage” on up to
$80 75 percent loan-to-value ratios from mortgage officers eager to
United States pitch business, while the workout group across the hall refuses
Billions of Dollars
to talk to the same client about an existing problem deal on their
$60
books.” Weaker regional and local banks may have less wiggle
room on workouts and sales, “hurting prospects for quicker
$40
resolution of problems” in some second- and third-tier markets.
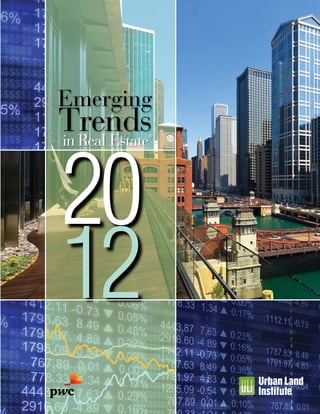
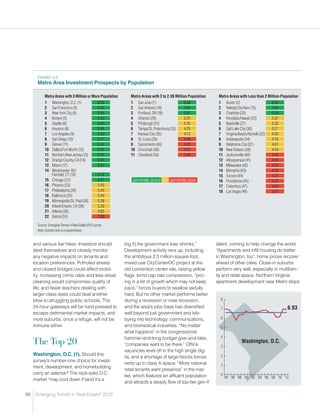
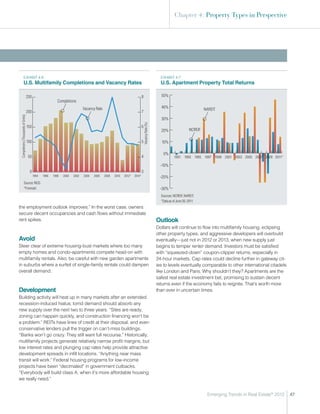
ExHIBIT 2-8
$20 Bank Real Estate Loan Delinquency Rates
20%
$0 Construction and Development Loans
07 07 07 07 08 08 08 08 09 09 09 09 10 10 10 10 11 11 Noncurrent Rate
Q1 Q2 Q3 Q4 Q1 Q2 Q3 Q4 Q1 Q2 Q3 Q4 Q1 Q2 Q3 Q4 Q1 Q2
Source: Real Capital Analytics. 15%
Note: For properties $10 million or greater; closed sales, commercial real estate only
(office, retail, industrial). Multifamily Mortgages
Noncurrent Rate
10%
out of trouble. “The advisers make money by constantly deploy-
ing dollars. If they don’t invest or must return commitments,
Commercial Mortgages
they’re out of business.” Noncurrent Rate
5%
Simply put, when capital looks like it’s out of control, it’s
definitely time to start worrying.
0%
Banks 1991 1993 1995 1997 1999 2001 2003 2005 2007 2009 2011*
Notes: Delinquent loans are defined here as those that are noncurrent—either 90 days or more
Still in “no rush to sell distressed assets and take losses,” past due or in nonaccrual status. As of Q2 2011.
banks deliberately “square away problem loans one by one.” Source: FDIC.
It begs the question about the strength of “recovered balance
sheets” and whether regulators “fear letting the market clear too
quickly.” This leisurely wind-down process could “take at least Insurers
three more years.” In 2012, anticipate more recapitalizations
After years pushed to the commercial mortgage market periph-
and sales, and distressed debt will remain difficult to refinance.
ery, life insurance companies stand out as “lending all-stars,
“It’s the same game plan,” says a bank executive. “Our aim is
“showing how discipline can pay off in preserving capital”
to hit a lot of singles and not do something stupid.” In dealing
and limiting downsides. “Back at full capacity without as many
with defaults and handling foreclosures, banks are “not in the
residual problems,” they have “a ton of cash” to dole out to
business of holding and owning.” “They don’t want to take back
“best-breed borrowers who own class-A properties, and land
hotels, may be able to get good pricing on apartments, and kick
excellent opportunities to “make decent loans” near market bot-
the rest down the road. Foreclosures also take time, delaying
tom. They can underwrite at “values well below past peaks with
deals coming to market.”
reasonable loan-to-values and good debt-service coverage,
Money center banks appear to be “awash in cash. “They
while solid NOIs [net operating incomes] from core properties
have little reason to lend when they can make profitable spreads
give cushion.” Uncharacteristically, the life companies also
off borrowing from the Fed for next to nothing to purchase
18 Emerging Trends in Real Estate® 2012](https://image.slidesharecdn.com/pwcemergingtrends2012-111119145351-phpapp01/85/PWC-Emerging-Trends-in-Real-Estate-2012-22-320.jpg)


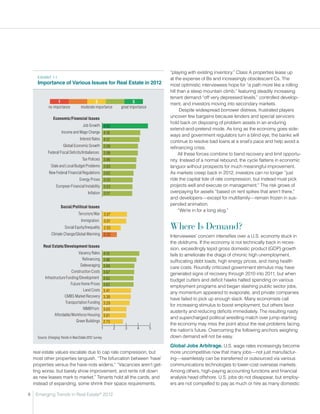
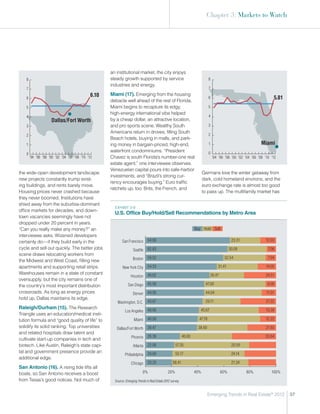
![over your destiny.” Following the overall investment crowd, these
ExHIBIT 2-14 players prefer multifamily over other sectors and have particular
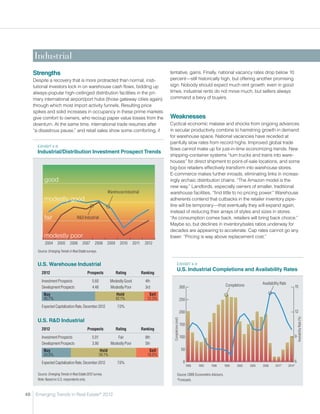
CMBS Mortgage Maturities concerns about office: “It’s harder to exit.” For now, running
scared seems sensible after watching positions evaporate in the
$150 market collapse.
$120 Wall Street Opportunity Funds
Loans Maturing (Billions of Dollars)
Husbanding loads of dry powder, frustrated opportunity funds
$90 and private equity managers so far come up empty ferreting
out compelling, high-octane transactions, and 2012 promises
more of the same. “It’s mostly a squirrel and rabbit game, not
$60 going after big scores.” Core buyers have driven down yields to
unappetizing levels in the best markets, while lenders and bor-
rowers get another free pass from resolving their problems and
$30
disgorging assets. “The available deals involve really bad stuff.”
Performance expectations dive: sales teams strain credibility
$0 in promising 15 percent annualized returns to client prospects,
2011 2012 2013 2014 2015 2016 2017 2018 2019 2020 2021 who wonder about using uncomfortable amounts of leverage
Source: Trepp, LLC in low-growth markets. “Everybody says they can do off-market
Note: For the public conduit universe, including multifamily-directed, non-multifamily-directed, and transactions, but not many are happening.”
fully defeased loans, as of September 2011.
Ironically, a large array of potential target properties remains
out of reach in last-generation closed-end opportunity funds,
is a low-margin business and the conduits with high cost of
tangled in knots and suffering losses. Limited partners refuse to
capital [investment banks, specialist finance companies] can’t
inject more capital to keep overleveraged assets afloat, but delay
make their bogeys on a consistent basis.” “Only teams that can
taking write-offs. General partners continue to manage the funds
drive volumes will be profitable.” Smaller, undercapitalized firms,
without a chance for promotes, and property conditions dete-
meanwhile, lack the warehousing capability and resources to
riorate without maintenance infusions. Complicated deals and
survive. The consensus view expects CMBS lending to increase
conflicted parties delay workouts and resolutions, dragging down
to over $50 billion annually in the next few years. “If we get over
managers and bottlenecking transaction activity. Investment
$100 billion, then it’s time to watch out.” For 2012, these lend-
bankers may take some funds public to raise capital and resolve
ers could “have trouble finding decent product and need to be
debt issues, “the way they did with developers in the 1990s.”
careful. There is no penalty for not making a loan. No one is
In the meantime, the manager lineup morphs. Legacy prob-
staffing up; investment banks hold back and feed fewer mouths
lems sink many investment teams, and new or reconstituted
after adjusting expectations. If the market gets out of control
firms try to pick up business but struggle without track records.
again, it won’t be in 2012 or 2013.”
Established asset managers with gold-plated brands attract the
“really big bucks” from institutional and high-net-worth investors,
Mezzanine Debt and Preferred who crave some semblance of security. “The big guys can more
Equity believably sell their access to capital and deals: the capital
helps attract deals, which helps attract more capital.” More
The “mispricing of interest rates” provides significant spreads investment banks may ankle the business. Executive suites
for mezzanine and preferred equity investors, who make deals don’t see the point after recent losses, the poor outlook to score
with “motivated” borrowers in need of refinancing capital and large performance fees, and potential new onerous reserve
their senior lenders. Under the circumstances, they succeed in requirements.
pushing hard bargains for projected “equity-like returns” at 15
percent and up. Burned by recent experience, these lenders
orient more to preferred equity positions “to participate in what REITs
happens to properties and have more control over exiting.” Over the past 15 years, public REITs have strategically accu-
Some insist on sales options. “We couldn’t get out in 2006 and mulated holdings of premier real estate assets across all
2007, and got killed. The lesson learned is take more control property sectors, employing top-drawer management teams
22 Emerging Trends in Real Estate® 2012](https://image.slidesharecdn.com/pwcemergingtrends2012-111119145351-phpapp01/85/PWC-Emerging-Trends-in-Real-Estate-2012-26-320.jpg)


![c h a p t e r 3
Markets toWatch
“Capital will search for yields beyond the overbought gateways and the few
jobs-growth markets, taking on considerably more risk.”
D
espite “tenuous” economic outlooks, only one of the on to the fifth position; and Seattle, also a software and internet
51 U.S. cities surveyed for Emerging Trends failed to hotbed, stays at number six. Each of these cities is experiencing
improve its investment score over last year’s report. potentially unsustainable cap rate compression.
More than 60 percent now rate as fair or better prospects,
Jobs Centers. Significantly, energy region markets, enjoying
compared with only 40 percent in 2011. “Most markets have
better-than-average jobs growth, further solidify favored posi-
stopped deteriorating, but most haven’t really improved,” one
tions—Austin (number two) with an additional boost from local
interviewee says. A surge of funding into the few favored cities
high-tech businesses and Houston (number eight) lead Texas oil
showing better supply/demand fundamentals creates “capital
patch cities. Not to be counted out because of their state’s fiscal
markets pricing distortion.” History “will repeat itself: investments
morass, San Jose (number seven) and the two largest southern
will trickle down to higher-risk secondary and tertiary markets as
California markets, Los Angeles (number nine) and San Diego
capital reaches the crazy point of driving down cap rates in the
(number ten), round out the survey’s top ten.
best places.” Employing a “pure timing play,” the trick will be “to
Denver and Dallas follow: the relatively robust energy and
find the best assets in these [smaller] cities and get good cur-
technology sectors help these Sunbelt markets, too. Miami
rent yields. You can’t just keep putting money down on 48th and
notably records the biggest ratings gain among major markets,
Park Avenue.” But many interviewees warn about “dabbling too
improving from a mediocre 4.49 in 2011 to a modestly good
much” in secondary markets. “Buyer beware” about the “array
5.81 for 2012; this gateway to Latin America is breaking out of
of possible ten cap deals” when “high vacancies may not come
the housing funk that continues to plague other Florida markets.
down and rent growth will be very challenging.” Especially in the
Respondents also signal a warmup for Phoenix, which is starting
current slow growth environment, opportunities in the second
to overcome significant housing and overdevelopment woes.
and third tier “will be thin at best.”
Chicago, a less-vibrant 24-hour market and Midwest gateway,
Usual Suspects. Highlighting investor angst, Washington, continues to outrank the region’s other struggling cities, while
D.C., the number-one city for the third consecutive year, suf- still regionally dominant but congenitally overbuilt Atlanta loses
fered a slight downtick from 7.01 to 6.93 on the Emerging Trends luster in the Southeast. Smaller markets Raleigh-Durham,
1 (abysmal) to 9 (excellent) ratings scale. Interviewees wonder Charlotte, and Nashville score better ratings.
if the market has become too dear in light of all the political talk
“Cool Towns.” Employers wanting to lure the best generation-
about federal cutbacks. Not surprisingly, the rest of the rankings
Y brainpower are paying careful attention to where this bulging
also look very familiar, dominated by the always highly rated
group of young adults wants to settle. “That’s where companies
24-hour coastal gateways, which become steadily more strate-
want to be.” “High-quality-of-life places do better”: echo boom-
gic as international financial, commercial, and political centers.
ers want plenty of stimulation from entertainment and nightlife
Just behind Washington, San Francisco leapfrogs New York
attractions convenient to work and residences. Many wouldn’t
City to number three, buoyed by high-tech hiring; Boston holds
Emerging Trends in Real Estate® 2012 27](https://image.slidesharecdn.com/pwcemergingtrends2012-111119145351-phpapp01/85/PWC-Emerging-Trends-in-Real-Estate-2012-31-320.jpg)


![LoDo (Lower Downtown) entertainment suburban station stops. “Denver feels
8 district is being built out, surrounded good. We have the draw of good-paying
by sustainable office development and clean-tech, energy industry jobs with a
7
boutique apartment projects: 4,000 units reasonable cost of living and improv-
6.17
6 begin to come off the drawing boards, ing transportation.” Although the office
promising “significant changes ahead.” market moves sideways, housing side-
5
First, new restaurants and a sports stepped the boom/bust debacle. Better
4 stadium attracted nightlife; now develop- days definitely seem to be ahead.
ers cater to echo boomer residents with
3 Dallas (12). Having “mostly dodged a
social amenities like landscaped roof
bullet,” Dallas benefits from the “Texas is
2 decks, gyms, and community rooms.
good for business/low taxes” storyline.
“We’re gradually becoming a 24-hour
1 San Diego Companies continue to move data
city,” an interviewee says. Union Station
processing, sales, and administrative
0 redevelops into a full-blown light-rail,
'94 '96 '98 '00 '02 '04 '06 '08 '10 '12 back-office operations to the Metroplex
bus, and train transportation complex,
to take advantage of “low-cost labor, the
serving rising numbers of suburban
great airport [D/FW], and central U.S.
a major corporate presence, and limited commuters who now have alternatives to
location.” Recent discoveries of huge
mass transit options mean businesses driving on congested highways. Transit-
natural gas fields also buttress prospects.
cluster to avoid traffic congestion near oriented development pops up along new
But investors always hesitate because of
prime bedroom communities, mostly
north of downtown. Apartment investors
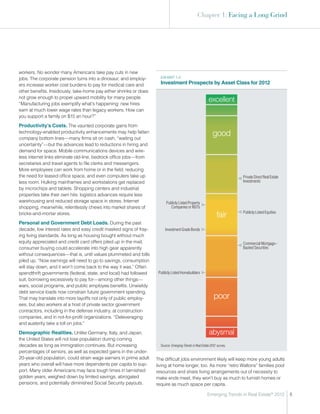
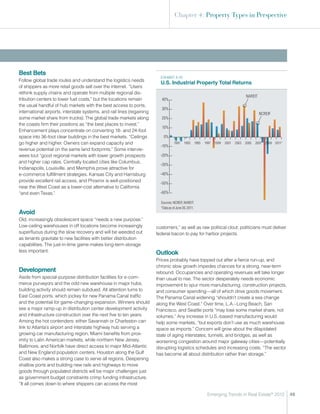
ExHIBIT 3-8
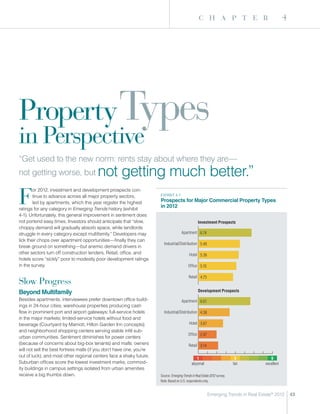
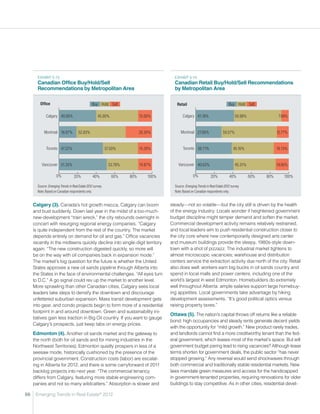
always do well, hotel outlooks continue
U.S. Industrial/Distribution Buy/Hold/Sell Recommendations
to improve, and housing prices revive
by Metro Area
before those in most national markets.
San Diego’s formidable ace in the hole
remains near-perfect year-round weather, Buy Hold Sell
which helps attract talent pools to local
Seattle 66.99 28.16 4.85
biotech companies, as well as a steady
stream of upscale retirees. The large U.S. Los Angeles 63.93 27.87 8.20
Navy base doesn’t hurt either, undergird- 61.18 32.94 5.88
Miami
ing the local economy.
San Francisco 59.32 33.90 6.78
Denver (11). Downtown steadily remakes
Houston 51.55 36.08 12.37
itself as an enticing, highly desirable
21st-century city center. The acclaimed Dallas/Fort Worth 44.76 38.10 17.14
San Diego 43.30 46.39 10.31
8 Washington, D.C. 42.02 45.38 12.61
7 New York City 39.79 53.76 6.45
6 6.16 Phoenix 38.68 35.85 25.47
5 Denver 37.50 45.83 16.67
4 Chicago 37.14 45.71 17.14
3
Denver Boston 29.91 51.40 18.69
Philadelphia 29.11 59.49 11.39
2
Atlanta 28.33 54.17 17.50
1
0% 20% 40% 60% 80% 100%
0
'94 '96 '98 '00 '02 '04 '06 '08 '10 '12
Source: Emerging Trends in Real Estate 2012 survey.
36 Emerging Trends in Real Estate® 2012](https://image.slidesharecdn.com/pwcemergingtrends2012-111119145351-phpapp01/85/PWC-Emerging-Trends-in-Real-Estate-2012-40-320.jpg)


![Hotels
Strengths meeting the needs of travelers’ no-frills mindset. Reasonably
Occupancies recover to more normalized levels near ten-year leveraged properties rebound off good cash flows: owners
averages for most lodging segments. “Demand is definitely can invest in overdue upgrades to gain greater advantage over
back.” Increased corporate travel—“the return of the weekday highly leveraged competition. Some local governments in tourist
business warrior has had the most impact”—combined with a areas offer tax breaks and incentives to owners and developers
weak dollar drawing offshore tourists, helps boost revenues in to upgrade and build new properties, hoping to jump-start more
major gateway markets. New York City, Boston, San Francisco, convention business, create jobs, and expand the tax base—
Chicago, and Miami all do well. Overall, leisure travel holds fairly anything to reinforce otherwise flagging economies.
steady, but tourists stay price-conscious. Midscale segments
without food and beverage show the best bottom-line results,
Weaknesses
Returning demand fails to translate into pricing power: “Room
ExHIBIT 4-11
rates are a big industry issue.” Industry yields suffer from greater
Hotel Investment Prospect Trends
reliance on discounting programs and third-party, internet dis-
tribution channels—Expedia, Priceline, etc. These new related
commission structures gnaw at bottom lines. “The old call center
booking model has become a dinosaur since people become
good
comfortable booking online.” More penny-pinching corporations
Limited-Service Hotels also push to negotiate favorable bulk purchase agreements
modestly good on room nights with business center hotels. Food and bever-
Full-Service Hotels age profits, meanwhile, have been slashed. “Companies meet
fair again, but don’t spend as much on ancillaries,” and they have
no compulsion to coddle employees or provide entertainment
budgets: “That’s not coming back anytime soon.” Wedding and
modestly poor party business also remains constrained—most folks lose their
appetite for fancy bashes—while spa and hotel stores also take
poor a hit. Given extremely high fixed costs to maintain these opera-
2004 2005 2006 2007 2008 2009 2010 2011 2012 tions, “any declines can crush bottom lines.” Weekend business
Source: Emerging Trends in Real Estate surveys. remains extremely feeble—“you can roll a bowling ball down the
halls”—especially in secondary and suburban markets where
developers engaged in pre-crash overbuilding. A disconnect
U.S. Hotels: Limited Service
in pricing expectations keeps transactions at a trickle despite
2012 Prospects Rating Ranking significant distress among owners who overborrowed at or near
Investment Prospects 5.41 Fair 5th market highs. Banks and special servicers keep the extend-
Development Prospects 3.94 Modestly Poor 4th and-pretend game going: they do not have the expertise to
Buy Hold Sell operate lodging properties and hold out as long as possible
32.3% 46.2% 21.6% to avoid writedowns. Struggling borrowers on floating-rate
Expected Capitalization Rate, December 2012 7.9% mortgages get a reprieve from the Federal Reserve; they remain
extremely vulnerable if interest rates ever advance.
U.S. Hotels: Full Service
2012 Prospects Rating Ranking
Best Bets
Investment Prospects 5.32 Fair 6th Concentrate on major flags in the familiar 24-hour cities.
Development Prospects 3.46 Poor 8th Investors should follow guest traffic and enhanced perfor-
Buy Hold Sell mance “to the better seaboard markets, across all price points.”
29.7% 46.9% 23.4%
Refinancing opportunities abound—especially mezzanine
Expected Capitalization Rate, December 2012 7.7% debt and bank equity. Banks will let go of these management-
intensive assets as more workouts occur: “They certainly don’t
Source: Emerging Trends in Real Estate 2012 survey.
want them in REO [real estate owned] portfolios.” In the current
Note: Based on U.S. respondents only.
market, profits are generated by rooms, so focus on midscale
50 Emerging Trends in Real Estate® 2012](https://image.slidesharecdn.com/pwcemergingtrends2012-111119145351-phpapp01/85/PWC-Emerging-Trends-in-Real-Estate-2012-54-320.jpg)


![Chapter 4: Property Types in Perspective
driving traffic and sales. The mass distribution centers would
provide greater convenience for shoppers who order online. ExHIBIT 4-20
“They can pick items up for more instant gratification or return U.S. Retail Property Total Returns
them easily without the hassle of waiting in lines.” Many tired
50%
malls selling commodity merchandise should be adapted to
NAREIT
serve as multifaceted town centers with education, community, 40%
or medical facilities, taking advantage of their often pivotal com-
30%
munity locations.
For 2012, the fortress centers and well-situated grocery- 20%
anchored retail—“like buying a bond”—will do well. “Neighborhood NCREIF
10%
center buyers must be extremely selective about locations,
targeting assets with the top local supermarket chains and high- 0%
est sales-per-square-foot numbers.” Major opportunities exist in 1991 1993 1995 1997 1999 2001 2003 2005 2007 2009 2011*
-10%
burgeoning underserved or unserved Hispanic markets, espe-
cially in the Southwest and on the West Coast. “Population and -20%
income in these communities grow ahead of national trends. The
-30%
opportunity exists to stake out centers in neighborhoods, which
can evolve with their demographics.” -40%
-50%
Avoid
Sources: NCREIF, NAREIT.
REITs strategically winnow portfolios, “selling cats and dogs.” *Data as of June 30, 2011.
Buyers should think twice before making deals. “If the big mall
companies couldn’t make them work, why should anybody else
Development
have a chance?” Be very careful about upgrading strategies for
The United States simply does not need additional shopping
older malls—“they probably require a different use”—and worry
center square footage, especially in old formats. Space per
even more about power centers with lineups of too many com-
capita will undergo a major squeeze-down for the foresee-
modity retailers, which may be vulnerable.
able future, but plenty of opportunity exists for redevelopment
and redesign. Construction lending will be bifurcated: smaller
players will have trouble scrounging financing from local and
regional banks, whereas REITs and institutional owners can
ExHIBIT 4-19 access credit lines from money-center institutions. Malls can
U.S. Retail Completions and Vacancy Rates reinvent themselves quickly, so expect local operators with
reuse ideas to work with local governments on converting class
35 C and D malls and attempt to turn around tax-base drains.
15%
Completions “Some properties won’t make it.” “Luddites can build more
30 traditional centers outside North America” in underserved,
developing regions. Brazil is calling.
25 Vacancy Rate
12%
Outlook
Completions (msf)
20
Vacancy Rate
“Very profound structural challenges” (online retailing competi-
15 tion) will continue to push “transformative, not cataclysmic”
9% change in the shopping center world. “Outside of A/B+ malls
10
[controlled by a REIT oligopoly] and select cash-cow neigh-
5
borhood strip centers,” the “environment looks very rugged.”
Although the recession claimed surprisingly few casualties,
0 6% players “require clear-eyed realism” to recognize and capitalize
1992 1994 1996 1998 2000 2002 2004 2006 2008 2010 2012* 2014* on changes, or they could lose ground quickly.
Source: REIS.
*Forecast.
Emerging Trends in Real Estate® 2012 55](https://image.slidesharecdn.com/pwcemergingtrends2012-111119145351-phpapp01/85/PWC-Emerging-Trends-in-Real-Estate-2012-59-320.jpg)


![Chapter 5: Emerging Trends in Canada
the chance for boom/bust cycles that now routinely devastate residential properties. Chinese capitalists with newfound wealth
U.S. real estate investors. Influenced by an immigrant ethos for actively park cash in Vancouver and Toronto apartment units,
building wealth off savings, Canada applies a heavy hand of leading to a wave of new construction. The transformation of
regulation to its banking and investment sector. Borrowers need skylines in other Canadian cities, including Montreal, Calgary,
substantial equity or must take out loan insurance to get home Ottawa, and St. John’s, also begins with new high-rise, glass-
mortgages; exotic CMBS and other security structures never and-steel box residential profiles as some local governments
found footing; and most business is financed by well-capitalized put growth boundaries into effect to discourage further sub-
national institutions. “Any potential contagion would be con- urban sprawl. Investors readily turn units into rentals to cover
tained within our borders.” Now, a big problem for the country’s expenses, tapping intense demand from young professionals
sturdy banks and large public pension funds is where to invest and empty nesters looking for urban action and greater lifestyle
capital in the face of limited domestic opportunities. Some of convenience. Retailers want to expand downtown footprints, too,
their biggest investment snafus come outside the borders in and work with developers on “Eurostyle” mixed-use projects
less-regulated markets, including notably the United States. incorporating apartments on upper stories and stores along
Canada’s solidity attracts a continuing influx of immigrants who streetscapes and lower levels. Companies also rethink subur-
undergird growth in burgeoning 24-hour cities and help sustain ban office strategies, following gen Y talent back into the cores.
“an edge for the economy.” They view Canada as a “safe place Local governments, meanwhile, take advantage of in-town
to come,” where “ethnic groups not only feel comfortable at building activity. In Vancouver, Toronto (inside the 905 belt), and
universities, but also stay after graduation.” increasingly in Calgary, they saddle developers and home-
builders with “onerous” development fees to raise revenues in
Unbound Urbanization. Noninstitutional offshore money can
lieu of higher property taxes. Not surprisingly, infill land costs
find a home in 24-hour-city condominium towers and upscale
skyrocket: low-rise and even mid-rise projects become more
uneconomical on small sites, so 50- and 60-story condo towers
ExHIBIT 5-3 rise up in Greater Toronto. At some point, back-to-the-city trends
Real Estate Capital Market Balance Forecast
+5+24+22+35+14
may stall out due to escalating living costs: “It’s becoming very
for 2012
expensive.” Antisprawl laws also increase values on existing
Equity Capital for Investing single-family homes within growth boundaries: they become
more precious commodities, especially for families outgrowing
all those cramped apartments.
4.76% 23.81% 22.62% 34.52% 14.29%
Development. Commercial construction remains pretty tepid.
Substantially Moderately In balance Moderately Substantially Don’t expect much office development in many markets; manu-
undersupplied undersupplied oversupplied oversupplied facturing weakness holds back most warehouse construction;
+2+35+36+25+2
and retail projects focus on infill developments tied to condo-
Debt Capital for Acquisitions miniums. Concerns increase about all the high-rise residential
projects springing up in major cities, particularly Toronto and
Montreal. “It’s pretty scary when planners push density at
developers, who start building 60-story condo towers and get
2.38% 34.52% 35.71% 25.00% 2.38% 20 to 25 percent margins. They’ll just keep building until it’s just
Substantially Moderately In balance Moderately Substantially a matter of time [before] too many get built.” Banks will become
undersupplied undersupplied oversupplied oversupplied
+2+27+50+16+5
more nervous about lending standards for these projects. “You
see a lot of apartments not sold on top floors of upscale build-
Debt Capital for Refinancing ings, which suggests a lack of depth in the market.” Buyers in
Vancouver and Toronto skew toward Asian investors and specu-
lators, who rent most of the units. “This activity is unsustainable.”
Pure rental apartment developers cannot price out product
2.41% 26.51% 50.60% 15.66% 4.82% against the condo competition, so they join in on the action. But
Substantially Moderately In balance Moderately Substantially many interviewees contend the condo wave can continue, sup-
undersupplied undersupplied oversupplied oversupplied
ported by urbanization move-back-in trends and large numbers
of immigrant renters. Minuscule residential vacancy rates sup-
Source: Emerging Trends in Real Estate 2012 survey.
Note: Based on Canadian respondents only.
port their views.
Some developer sector specialists work together in tight infill
Emerging Trends in Real Estate® 2012 61](https://image.slidesharecdn.com/pwcemergingtrends2012-111119145351-phpapp01/85/PWC-Emerging-Trends-in-Real-Estate-2012-65-320.jpg)

![Chapter 5: Emerging Trends in Canada
and require greater equity contributions from borrowers (exhibit
5-7). “The U.S. effect [debt crisis] influences policy and makes ExHIBIT 5-8
them even more disciplined. In Canada, bankers will always find Emerging Trends Barometer 2012
something to pick on, no matter what point in the cycle.” But who
can argue with the approach. “Not a single mortgage over $10
million has defaulted.”
Fed up with disappointing stocks and low-yielding bonds, good Hold
investors sit on “lots of funds,” “looking for long-term cash-flow- Buy
ing assets like real estate,” but “have trouble placing the monies
they have.” Pension funds and other institutions “feel pressures
modestly good
to put dollars out” and condition themselves to accept lower
domestic returns or go overseas to “chase higher yields.” REITs fair Sell
using “cheap” bank lines of credit have been more aggressive
than institutional investors, pushing up pricing to potentially dis- modestly poor
comfiting levels. Some interviewees have raised a concern that
some of the REITs may not have been as rigorous in their under-
writing, and projected cash flows may not pan out. Their lower poor
cost of capital and easy access to credit allows them to take the 2008 2009 2010 2011 2012
lead on new development as well. To foreign investors, Canada
looks like a reliable bet compared with most other regions, as Source: Emerging Trends in Real Estate 2012 survey.
Note: Based on Canadian respondents only.
well as a highly ethical and transparent country “where it is easy
to do business.” But entrenched REITs and pension funds that
hold on to assets “easily squeeze” offshore institutions out of 2012, an outlook reinforced by the Emerging Trends buy/hold/
markets. The majority of foreign activity concentrates in Asian sell barometer (exhibit 5-8). Buying sentiment declines from
flight capital targeting condominiums in the gateway cities. 2011’s apparent cyclical pinnacle while selling interest spikes
sharply: owners realize they should strike before capital turns
Transactions. Ample capital scouring markets dominated by
tail. “The smart money takes chips off the table, selling into the
long-term holders signals diminishing prospects for buyers in
peak, but holds off reinvesting and counts gains.” This portends
a continuing sluggish transactions market where relatively few
deals trade at high (if not outrageous) prices, with most play-
ExHIBIT 5-7
ers backing off and contentedly holding on to what they have.
Maturing Loans: Preferred Strategy for Lenders
by Mid-2012 “Institutions will continue to complain they have nothing to buy,
but won’t sell because it’s too hard to replace.”
Extend without Cap Rates and Values. The low-trading, core-oriented real
mortgage modification Foreclose and dispose estate market compresses capitalization rates back toward 2007
3.53% 7.06%
lows. Some interviewees predict “a permanent shift downward
closer to European levels” based on enduring supply/demand
Extend with Sell to a third party
20.00%
equilibrium and ownership dominated by institutions. “The days
mortgage modification
69.41% of 8 percent to 10 percent yields are gone.” But a majority of
interviewees counter that the prospect for higher interest rates
eventually will push cap rates up absent growth in rents, which
historically stay relatively flat. They suggest a leveling to slight
increase in rates for 2012, led by suburban office and power
centers (exhibit 5-9). Under any circumstances, investors should
prepare for lower returns over time, including a modest correc-
tion in commercial values for properties in secondary markets.
Institutional-quality property probably registers modest value
gains in 2012.
Source: Emerging Trends in Real Estate 2012 survey.
Note: Based on Canadian respondents only.
Emerging Trends in Real Estate® 2012 63](https://image.slidesharecdn.com/pwcemergingtrends2012-111119145351-phpapp01/85/PWC-Emerging-Trends-in-Real-Estate-2012-67-320.jpg)


![values. Over the past five years, cap rates have dropped from
low double digits down to the mid-singles. “Price per pound
Mexico No Go
for office and apartment condos actually exceeds New York Foreign money simply turns tail on Mexico after talking up
and Washington, D.C.; the cat is out of the bag.” With the Rio significant potential for years. “The country looks out of con-
Summer Olympic Games approaching in 2016, investors trol,” says an active investor in Latin America. “I wouldn’t go
don’t expect a correction, but markets need to take a breather: anywhere near there until they figure out their drug problems.”
“Returns will flatten out.” Supply constraints in both cities will The U.S. economic funk doesn’t help either, stanching demand
help support residential and office prices, but the chance for Mexican border factory locations and tourist hotels. The
clearly passes for outsized year-over-year gains, and acquisition pullback comes as the Mexican economy kicks back into “low
opportunities remain scarce. gear” and domestic consumer buying advances from a growing
Significant development opportunity exists in the under- middle class.
served, “blowing-and-going” retail sector, with only 400 While the government euphemistically characterizes drug-
shopping centers in a country of 200 million people generating related violence in northern border cities as “security issues,”
nearly 10 percent annualized sales growth. “Rio and São Paulo once-sanguine real estate players now steer entirely clear. “It’s
are spoken for—local developers and their partners control the downright grotesque and extremely dangerous.” Juárez and
most attractive retail sites—but 18 secondary and tertiary cities Reynosa have been epicenters of violence; “no one goes there.”
with million-plus populations offer major investment plays. “Malls Monterrey is “less impacted,” and Tijuana remains unsettled.
and strips don’t exist there yet,” and workforce housing is also Property pricing along the borders declines, “but not as
undersupplied in these markets. much as you’d think since many U.S. companies continue to
Do you know foreign real estate investors who have come operate factories and facilities on long-term leases.” Although
out ahead in China, India or Russia? “Brazil is the only one of the most development and new investment goes into limbo, rising
BRIC [Brazil, Russia, India, and China] countries so far to really manufacturing costs in China could eventually bring back more
deliver on its promise.” factories to Mexico. “U.S. companies will stay active, especially
in medical products, auto parts, and electronics. Tijuana is the
TV set production capital of the world.” Mexican factory sites
ExHIBIT 6-2
also retain a significant edge over Asian countries for manu-
Brazil: Foreign Direct Real Estate Investment facturing heavy industrial machinery headed for U.S. markets,
which cost more to ship from overseas.
Border turmoil issues recede in “the relatively stable environ-
ment around Mexico City,” one of the world’s biggest urban
$4,000
centers, which prospers from “significant internal demand
drivers.” The border may be “messed up,” but the national
$3,500
capital and gateway “remains viable” and “values have held
up; it gets a bum rap.” Institutional investors in general back off
$3,000
even here. “They feel they have too much in Mexico under the
Millions of U.S. Dollars
$2,500 circumstances.” New capital development certificates (CKDs),
which encourage pension funds to invest in real estate projects
$2,000 and new infrastructure, “may pick up the investment slack.”
Several major investment managers from the States move in
$1,500 to manage some of these funds. “The idea is to allow plan
sponsors to diversify and get better rates of return than from
$1,000 low-yielding government bonds.” CKDs essentially invest in the
country, improving real estate stock, roads, transit, and water/
$500 sewer systems while putting more people to work.” Developers
certainly applaud the initiative as they struggle to emerge from a
$0 postcrash limbo.
2002 2003 2004 2005 2006 2007 2008 2009 2010 2011*
Even in the best of times, outsider investors hit obstacles
breaking into Mexican markets. “Locals own to hold, keeping
Source: Central Bank of Brazil (compiled by Altus Group Latin America, Inc.) properties in families for generations.” This behavior shows no
*Projection by Altus Group Latin America, Inc. prospect for changing.
76 Emerging Trends in Real Estate® 2012](https://image.slidesharecdn.com/pwcemergingtrends2012-111119145351-phpapp01/85/PWC-Emerging-Trends-in-Real-Estate-2012-80-320.jpg)


The U.S. real estate recovery will continue at a slow pace in 2012 as high unemployment delays demand for office and retail space, while deleveraging reduces consumer spending. Investment will focus on major cities and the apartment sector, but abundant capital may not offset weak underlying fundamentals across many markets. The long-term trend of less spending and space usage due to economic challenges will hamper the real estate industry.


![Pathways commission final_report_complete[1]](https://cdn.slidesharecdn.com/ss_thumbnails/pathwayscommissionfinalreportcomplete1-120805122311-phpapp01-thumbnail.jpg?width=640&height=640&fit=bounds)


