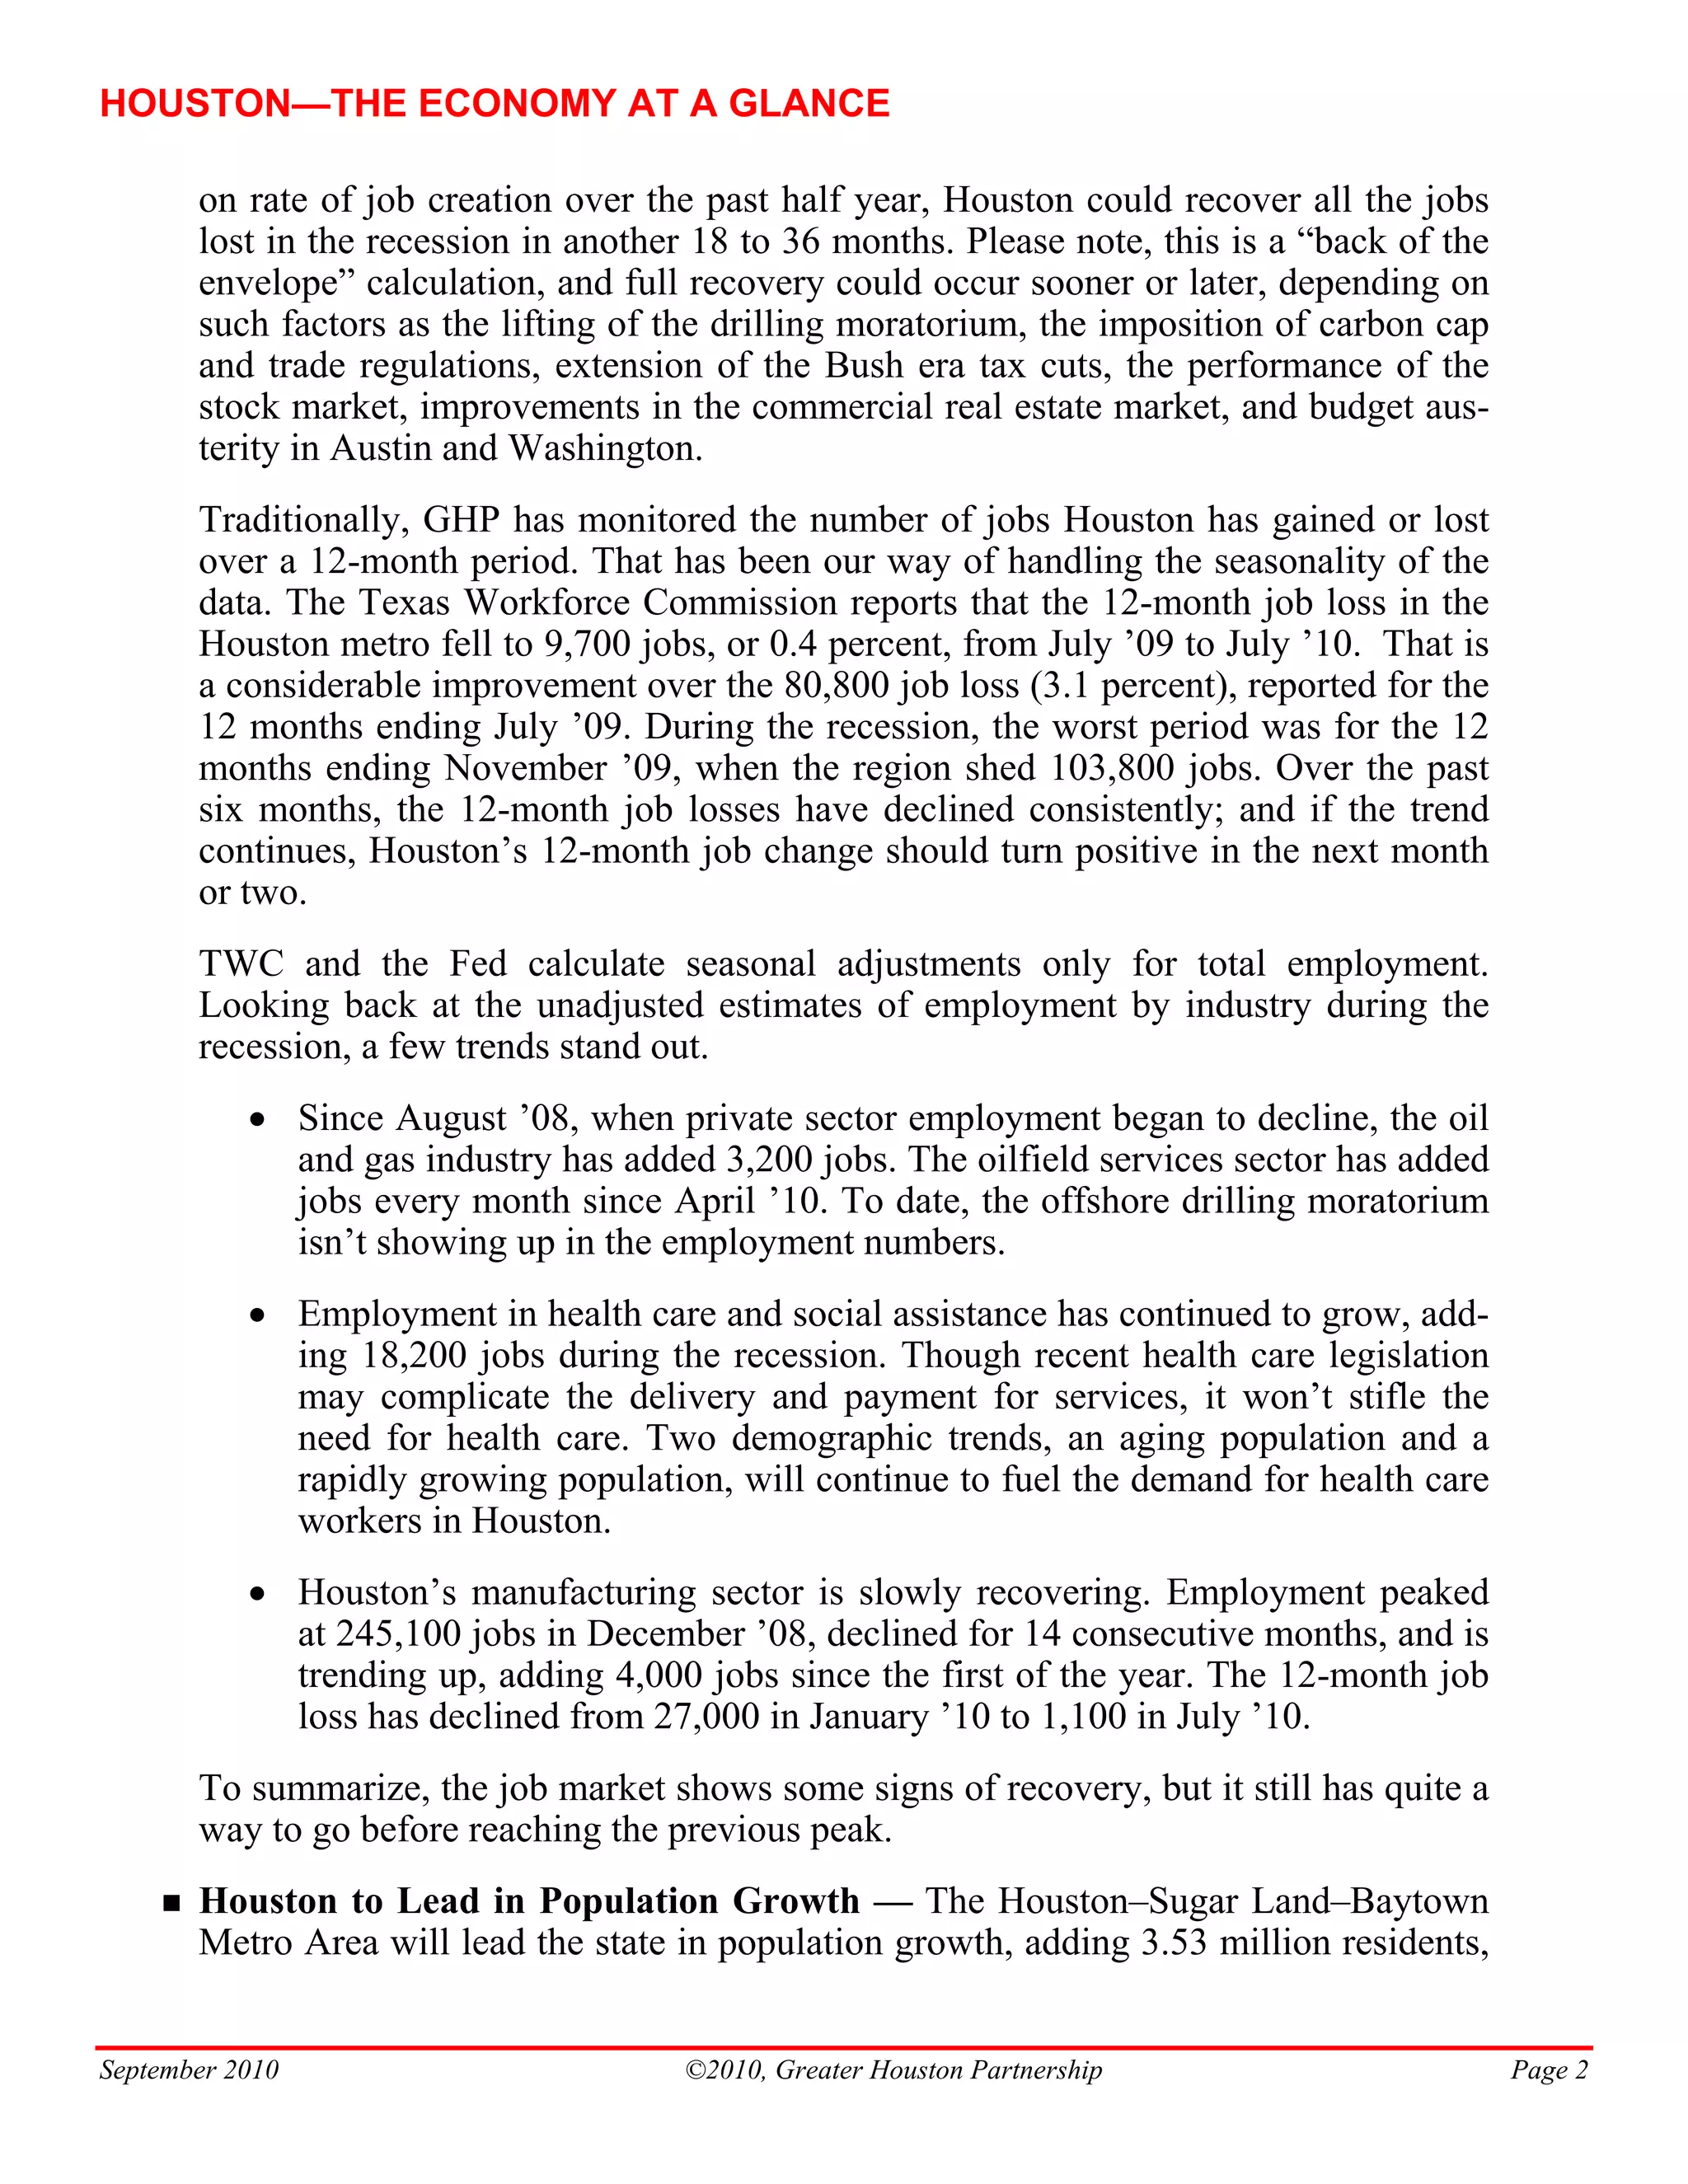
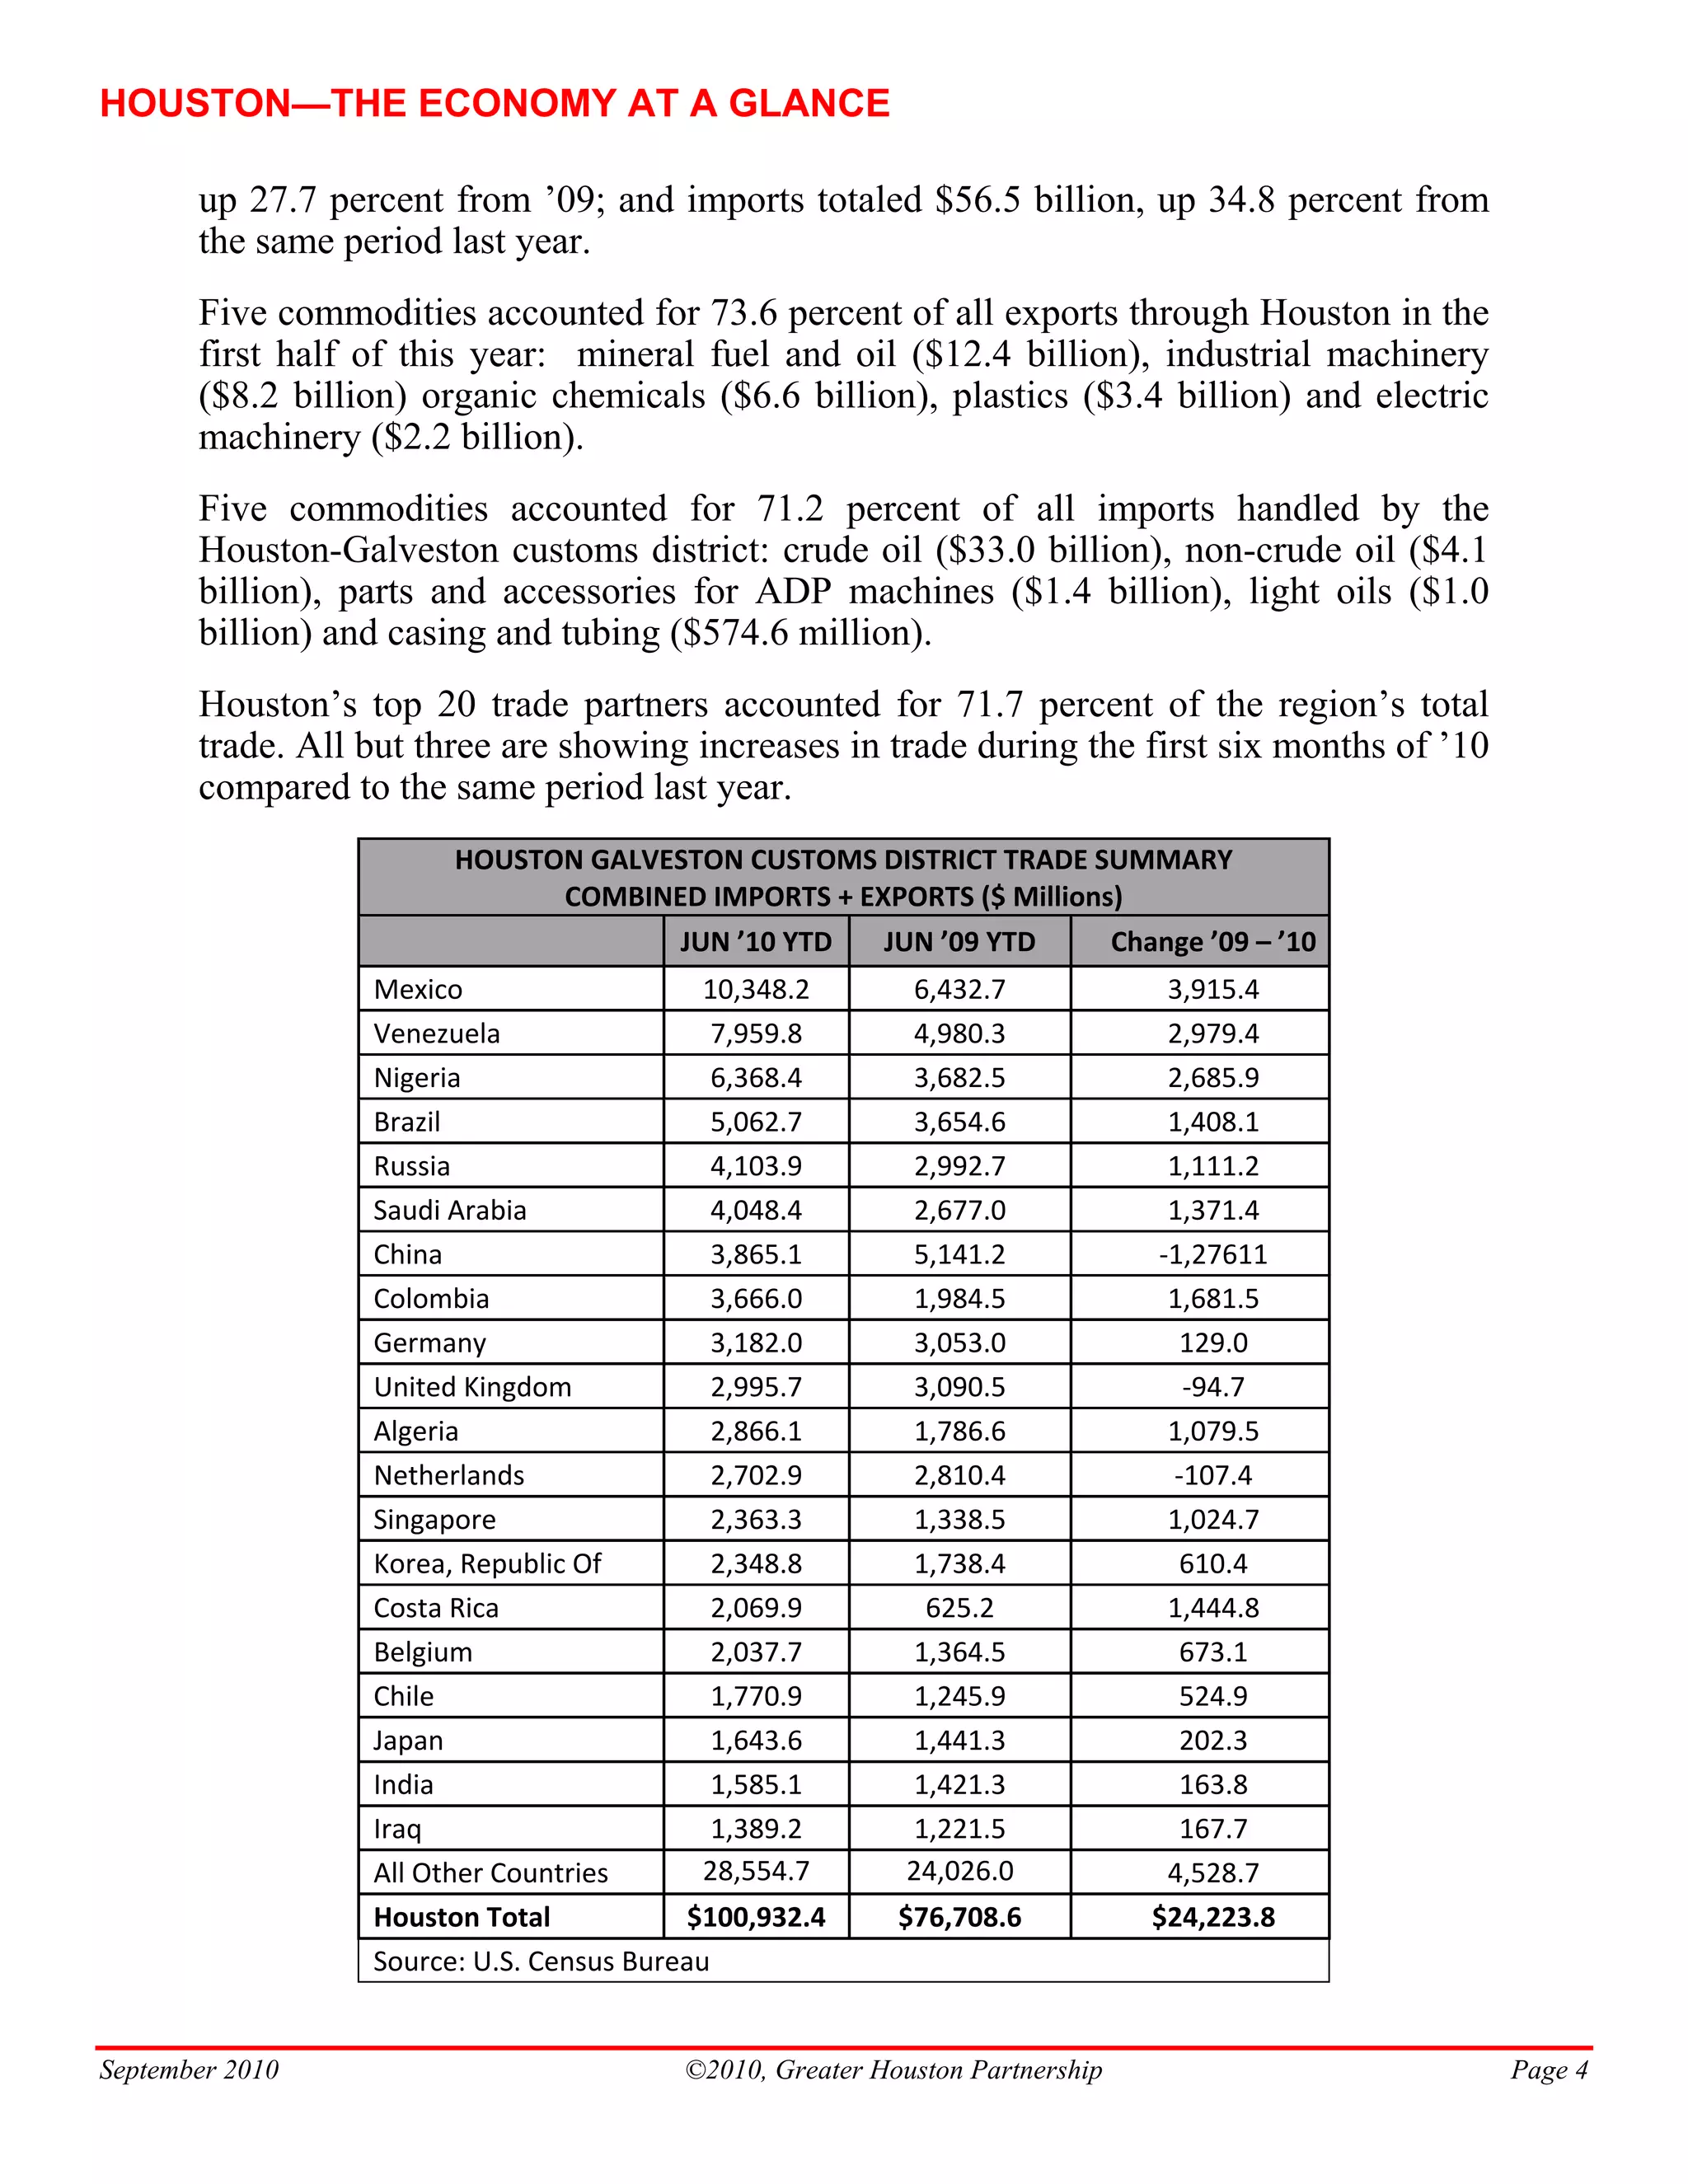
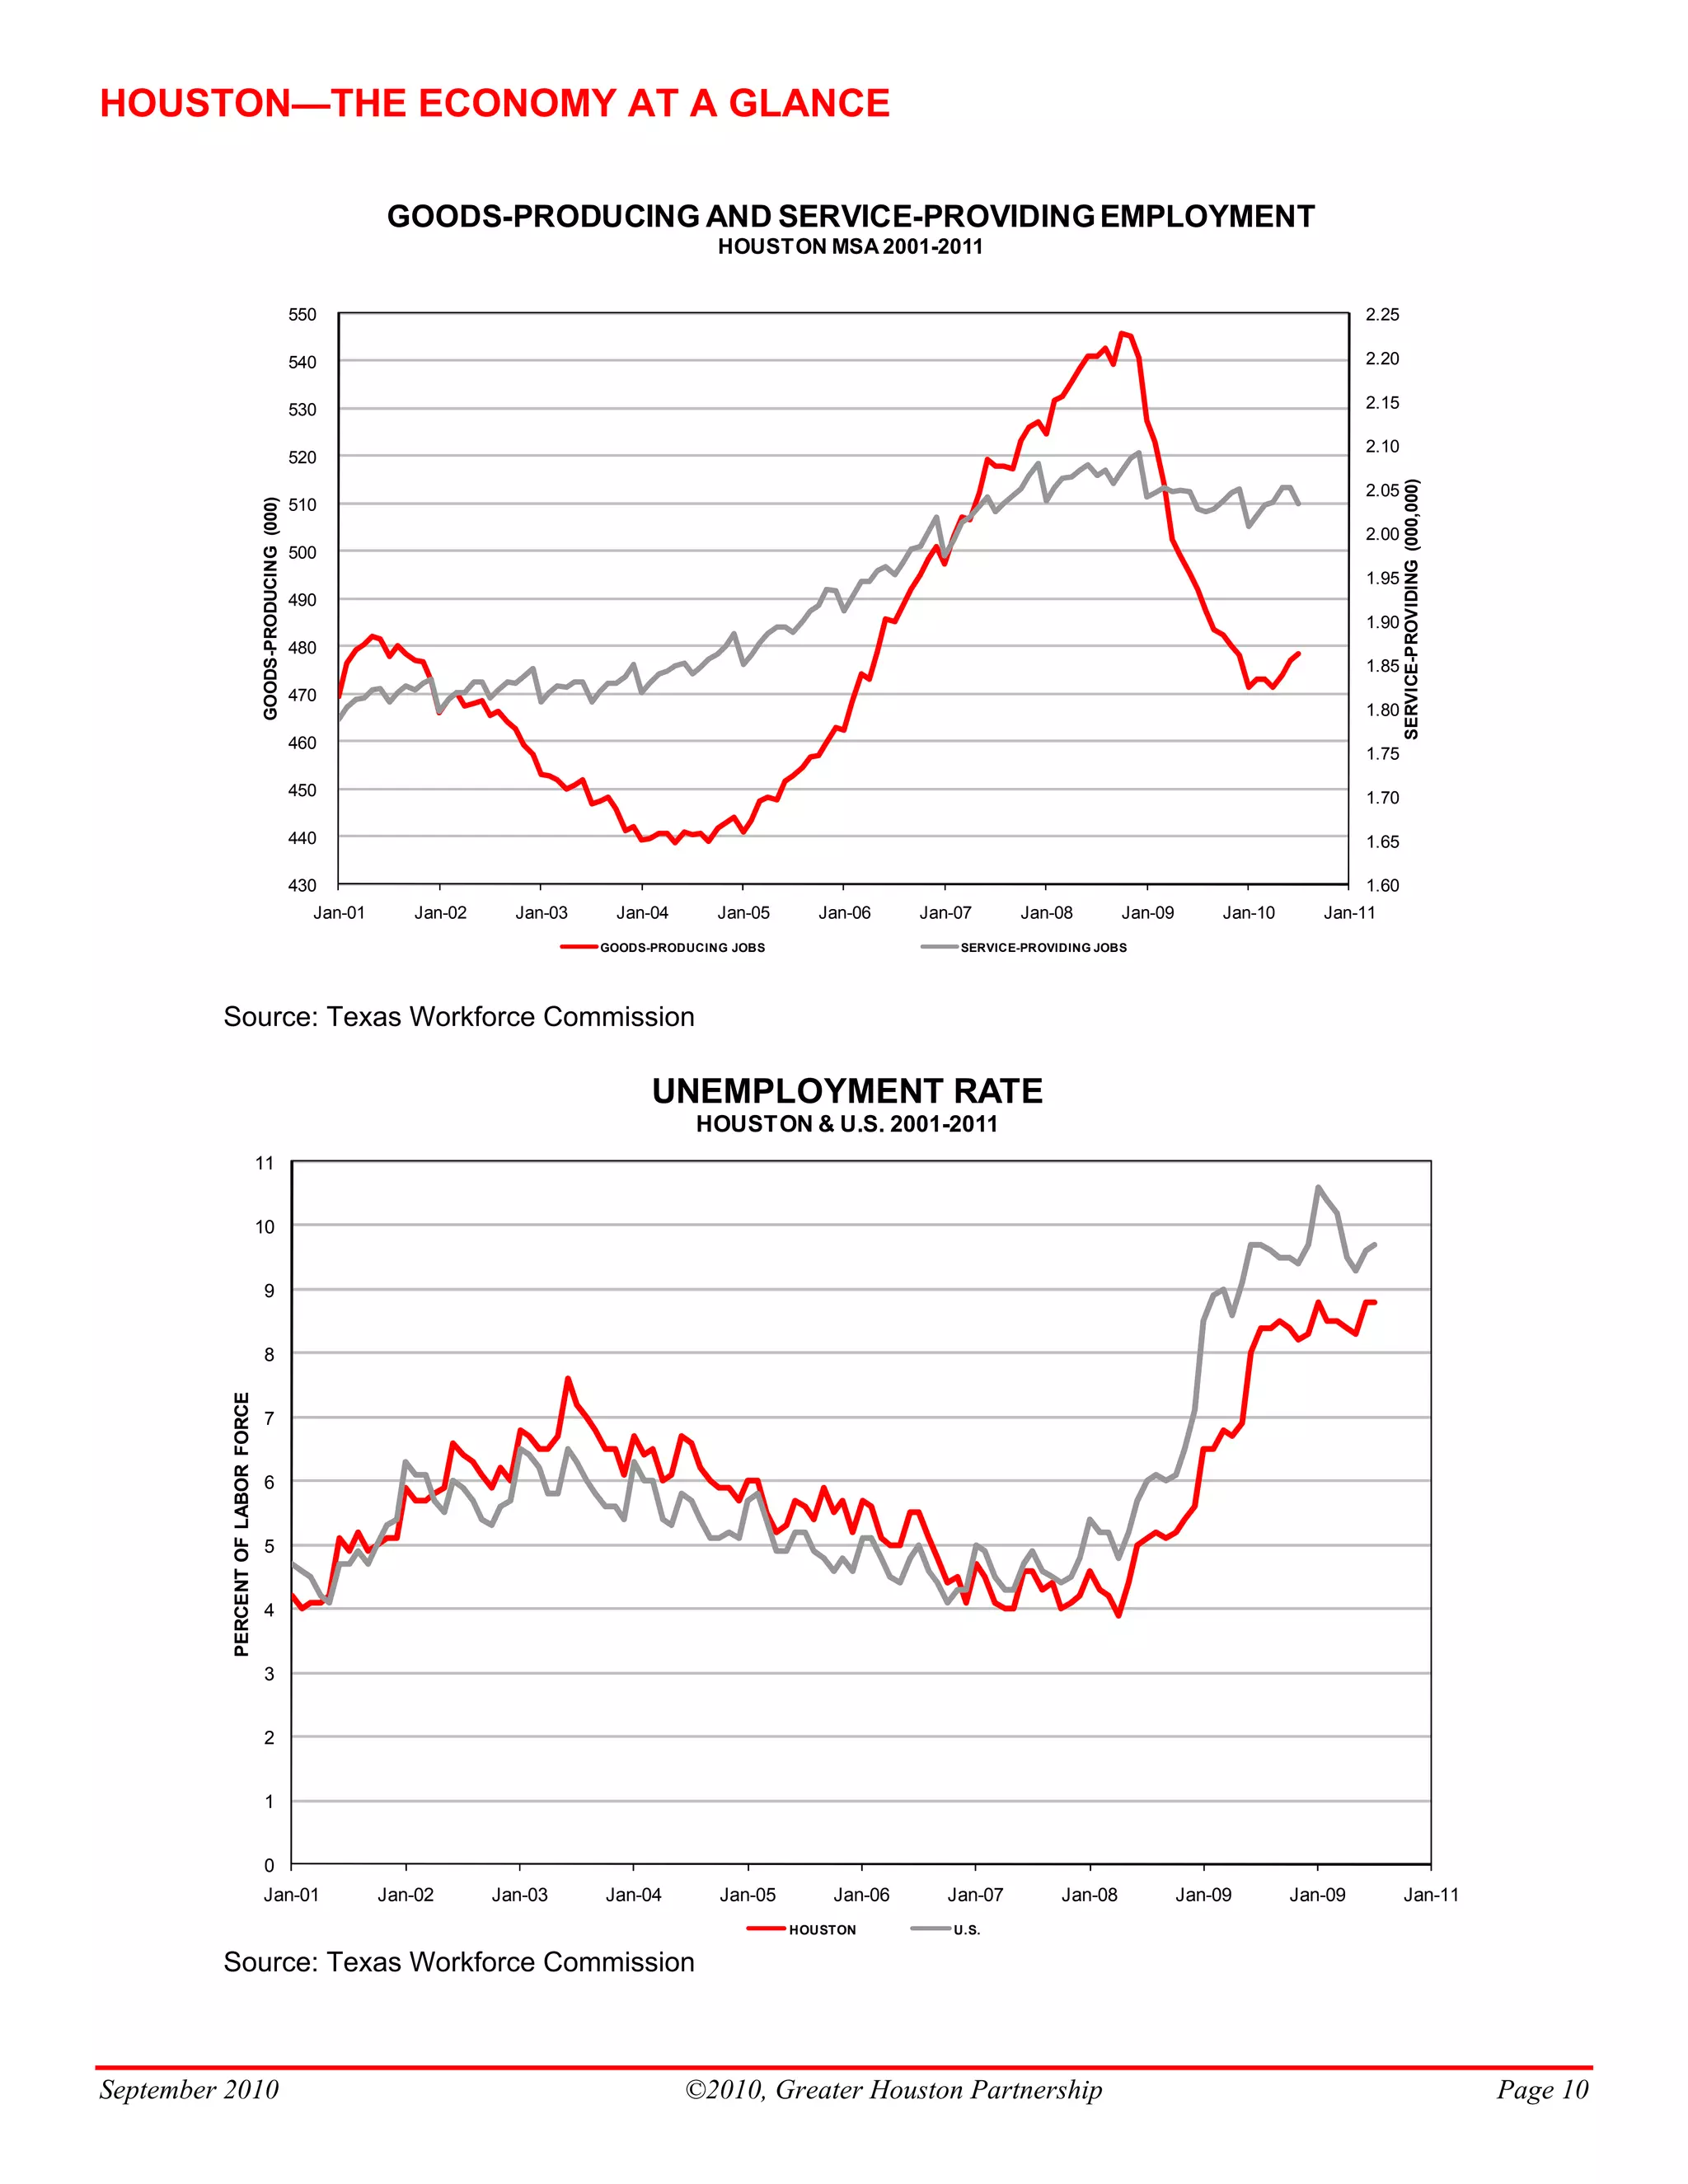
SlideShare a Scribd company logo
1 of 11
Download to read offline
A publication of the Greater Houston Partnership                      Volume 19, Number 9 • September 2010

       Employment Continues to Recover — Employment is perhaps the most watched
       of all economic indicators. Everyone knows what it means to have a job, and in the
       past year and a half, many have come to know what it means to lose one. It’s less
       clear what is meant by indicators like interest rate spreads; nondefense capital
       goods; or the M2 money supply. But it is obvious what it means when your neigh-
       bor, your brother or you are out of work.
       Clearly, the employment data has its problems. It fluctuates because of seasonal
       factors. Retailers, ramping up for the holiday shopping season, add sales staff in
       November; and as sales wind down, they let workers go in January. School pay-
       rolls rise in the fall as educators return to campus, but drop in June with the sum-
       mer vacations.
       The Texas Workforce Commission (TWC) and the Houston branch of the Federal
       Reserve Bank of Dallas attempt to factor out these seasonal fluctuations. By doing
       so, they hope to determine a true picture of what’s happening in the labor markets.
       Here are their “seasonally adjusted” employment numbers for the recent recession
       in Houston-Sugar Land-Baytown Metro Area:
                                                            EMPLOYMENT DATA 
                                      UNADJUSTED           ADJUSTED BY TWC   ADJUSTED BY THE FED 
       Peak Employment Month          December ’08              August ’08           August ’08  
       Peak Employment                    2,632,300              2,619,200            2,622,100 
       Trough Month                     January ’10            January ’10          January ’10  
       Trough Employment                  2,479,500              2,503,300            2,512,000 
       Jobs Lost in Recession               152,800                115,900              110,100 
       July ’10 Employment                2,511,100              2,520,400            2,541,100 
       Jobs Added Since Trough               31,600                 17,100               29,100 
       Percent Recouped                       20.7%                  14.8%                26.4% 
        Average Monthly Job Gains             5,267                  2,850                4,850 


       Looking at either adjusted or unadjusted data, it appears that the region stopped
       losing jobs in January of this year, and has been adding jobs, albeit slowly, since
       then. Six months into the recovery, Houston has replaced one-seventh to one-
       fourth of the jobs it lost, depending upon which adjusted numbers you use. Based

September 2010                             ©2010, Greater Houston Partnership                        Page 1
HOUSTON—THE ECONOMY AT A GLANCE

       on rate of job creation over the past half year, Houston could recover all the jobs
       lost in the recession in another 18 to 36 months. Please note, this is a “back of the
       envelope” calculation, and full recovery could occur sooner or later, depending on
       such factors as the lifting of the drilling moratorium, the imposition of carbon cap
       and trade regulations, extension of the Bush era tax cuts, the performance of the
       stock market, improvements in the commercial real estate market, and budget aus-
       terity in Austin and Washington.
       Traditionally, GHP has monitored the number of jobs Houston has gained or lost
       over a 12-month period. That has been our way of handling the seasonality of the
       data. The Texas Workforce Commission reports that the 12-month job loss in the
       Houston metro fell to 9,700 jobs, or 0.4 percent, from July ’09 to July ’10. That is
       a considerable improvement over the 80,800 job loss (3.1 percent), reported for the
       12 months ending July ’09. During the recession, the worst period was for the 12
       months ending November ’09, when the region shed 103,800 jobs. Over the past
       six months, the 12-month job losses have declined consistently; and if the trend
       continues, Houston’s 12-month job change should turn positive in the next month
       or two.
       TWC and the Fed calculate seasonal adjustments only for total employment.
       Looking back at the unadjusted estimates of employment by industry during the
       recession, a few trends stand out.
           • Since August ’08, when private sector employment began to decline, the oil
             and gas industry has added 3,200 jobs. The oilfield services sector has added
             jobs every month since April ’10. To date, the offshore drilling moratorium
             isn’t showing up in the employment numbers.
           • Employment in health care and social assistance has continued to grow, add-
             ing 18,200 jobs during the recession. Though recent health care legislation
             may complicate the delivery and payment for services, it won’t stifle the
             need for health care. Two demographic trends, an aging population and a
             rapidly growing population, will continue to fuel the demand for health care
             workers in Houston.
           • Houston’s manufacturing sector is slowly recovering. Employment peaked
             at 245,100 jobs in December ’08, declined for 14 consecutive months, and is
             trending up, adding 4,000 jobs since the first of the year. The 12-month job
             loss has declined from 27,000 in January ’10 to 1,100 in July ’10.
       To summarize, the job market shows some signs of recovery, but it still has quite a
       way to go before reaching the previous peak.
       Houston to Lead in Population Growth — The Houston–Sugar Land–Baytown
       Metro Area will lead the state in population growth, adding 3.53 million residents,


September 2010                         ©2010, Greater Houston Partnership                      Page 2
HOUSTON—THE ECONOMY AT A GLANCE

       between ’09 and ’35, according to a forecast recently released by The Perryman
       Group. That reflects a 1.84 percent annual growth rate. Dallas-Plano ranks second
       in projected population growth, adding 2.61 million residents during the same
       period, a 1.84 percent compound annual growth rate, and Austin ranks third, add-
       ing 500,072 residents, a 2.65 percent compound annual growth rate.
       Perryman also forecasts that Houston will add an additional 1.325 million jobs and
       account for almost one-fourth of Texas job growth during that time frame. That
       reflects a 1.57 percent annual growth rate.
       Real gross product, the final value of all goods and services produced in Houston
       adjusted for inflation, will grow from $284.5 billion in ’09 to $747.3 billion in
       2035. That reflects a 3.78 percent compound annual growth rate. The forecast is in
       2000 constant dollars.
       “The long-term forecast for the state is positive and a return to steady, healthy
       growth is anticipated,” the report states.
       International Passenger Travel Increases — The Houston Airport System
       served 4.74 million passengers in July ’10, bringing its 12-month total to 49.0 mil-
       lion passengers. This is 6.7 percent less than the record 52.3 million passengers
       served during the 12 months ending July ’08.
       Although most passengers are traveling domestically, the majority of growth oc-
       curred in international travel. The first seven months of the year saw a 4.4 percent
       increase in international passengers, while domestic travel only rose 0.1 percent.
       The greatest rise in passenger volume occurred in travel to Canada (22.4 percent),
       Europe (12.4 percent) and the Middle East (11.6 percent increase). Dubai-based
       Emirates recently announced plans to add a second daily nonstop flight from
       Houston Intercontinental to the U.A.E. to handle growing demand for service to
       the Middle East.
       “So far this year, each and every month has produced an increase in the number of
       international passengers,” said Director, Air Service Development, Genaro Peña.
       “The additional passengers and new nonstop flights have combined to create very
       positive momentum for HAS in 2010.”
       Air freight volumes also continue to grow. HAS handled 76.7 million pounds of air
       freight in July ’10, up 16.7 percent from July ’09. Year-to-date, HAS handled
       507.8 million pounds of air freight, up 17.6 percent compared to the same seven
       months last year.
       International Trade Posts Gains —  Through the first six months of ’10, the
       Houston-Galveston Customs District handled $100.9 billion in trade, up 31.6
       percent from $76.7 billion the first six months of ’09. Exports totaled $44.4 billion,


September 2010                         ©2010, Greater Houston Partnership                       Page 3
HOUSTON—THE ECONOMY AT A GLANCE

       up 27.7 percent from ’09; and imports totaled $56.5 billion, up 34.8 percent from
       the same period last year.
       Five commodities accounted for 73.6 percent of all exports through Houston in the
       first half of this year: mineral fuel and oil ($12.4 billion), industrial machinery
       ($8.2 billion) organic chemicals ($6.6 billion), plastics ($3.4 billion) and electric
       machinery ($2.2 billion).
       Five commodities accounted for 71.2 percent of all imports handled by the
       Houston-Galveston customs district: crude oil ($33.0 billion), non-crude oil ($4.1
       billion), parts and accessories for ADP machines ($1.4 billion), light oils ($1.0
       billion) and casing and tubing ($574.6 million).
       Houston’s top 20 trade partners accounted for 71.7 percent of the region’s total
       trade. All but three are showing increases in trade during the first six months of ’10
       compared to the same period last year.
                        HOUSTON GALVESTON CUSTOMS DISTRICT TRADE SUMMARY 
                              COMBINED IMPORTS + EXPORTS ($ Millions) 
                                     JUN ’10 YTD  JUN ’09 YTD       Change ’09 – ’10  
                  Mexico                    10,348.2       6,432.7             3,915.4 
                  Venezuela                  7,959.8       4,980.3             2,979.4 
                  Nigeria                    6,368.4       3,682.5             2,685.9 
                  Brazil                     5,062.7       3,654.6             1,408.1 
                  Russia                     4,103.9       2,992.7             1,111.2 
                  Saudi Arabia               4,048.4       2,677.0             1,371.4 
                  China                      3,865.1       5,141.2            ‐1,27611 
                  Colombia                   3,666.0       1,984.5             1,681.5 
                  Germany                    3,182.0       3,053.0              129.0 
                  United Kingdom             2,995.7       3,090.5              ‐94.7 
                  Algeria                    2,866.1       1,786.6             1,079.5 
                  Netherlands                2,702.9       2,810.4             ‐107.4 
                  Singapore                  2,363.3       1,338.5             1,024.7 
                  Korea, Republic Of         2,348.8       1,738.4              610.4 
                  Costa Rica                 2,069.9        625.2              1,444.8 
                  Belgium                    2,037.7       1,364.5              673.1 
                  Chile                      1,770.9       1,245.9              524.9 
                  Japan                      1,643.6       1,441.3              202.3 
                  India                      1,585.1       1,421.3              163.8 
                  Iraq                       1,389.2       1,221.5              167.7 
                  All Other Countries       28,554.7       24,026.0            4,528.7 
                  Houston Total           $100,932.4      $76,708.6           $24,223.8 
                  Source: U.S. Census Bureau 


September 2010                           ©2010, Greater Houston Partnership                     Page 4
HOUSTON—THE ECONOMY AT A GLANCE

       New Home Sales Fall — Net sales of new single-family homes fell to 888
       transactions in July ’10, a 35 percent decline compared to July ’09, according to
       Metrostudy’s July Monthly Sales and Traffic Report. Though July sales were
       down compared to a year ago, they were actually up 11 percent compared to June
       ’10.
       Over the first five months of ’10, new home sales grew as consumers accelerated
       their purchase decisions to take advantage of the new homebuyer tax credit. Once
       the new homebuyer’s tax credit expired, new home purchases dropped
       significantly.
       In the wake of weak demand, builders continue to carefully manage their
       inventories. The number of spec units under construction saw no growth compared
       to July ’09 and remained at 1,825. Finished spec inventory rose to 1,371, a 19.4
       percent increase from July ’09.
       Metrostudy estimates that single-family starts in the Houston area will total 18,000
       in ’10 and 20,000-21,000 in ’11.
       Houston’s Cost of Living Remains Below National Average — In Q2/10, the
       cost of living in Houston was 19 percent below the average for 27 metropolitan
       areas over 2 million population and 10 percent below the average for all 314
       reporting places, according to the ACCRA Cost of Living Index. The index, pro-
       duced by the Council for Community and Economic Research, measures
       differences in the relative cost of consumer goods and services appropriate for a
       professional or managerial household in the top income quintile.
       Houston’s low cost of living is mostly because of its bargain housing prices. In
       Q2/10, housing costs in Houston were 39 percent below the major metro average
       and 22 percent below the average of all reporting places. According to the ACCRA
       survey, the same new house that cost $211,432 in Houston in July cost $322,968 in
       Miami, $471,000 in Boston and $609,952 in Washington, D.C.
       The cost of grocery items in Houston was the lowest among the major metro areas,
       16 percent below the major metro average and 12 percent below the national aver-
       age. Houston did not differ significantly from the nationwide average on the other
       components: utilities, transportation, health care, and miscellaneous goods and
       services.
                                ____________________________________
                 The Greater Houston Partnership is the primary advocate of Houston’s business community
                                and is dedicated to building regional economic prosperity.

                    Visit the Greater Houston Partnership on the World Wide Web at www.houston.org.
                                          Contact us by phone at 713-844-3600.


September 2010                                 ©2010, Greater Houston Partnership                          Page 5
HOUSTON—THE ECONOMY AT A GLANCE
Houston Economic Indicators                                                                                                 YEAR-TO-DATE
  A Service of the Greater Houston Partnership                                      MONTHLY DATA                          TOTAL OR AVERAGE*
                                                                                      Most            Year       %            Most               Year          %
                                                                     Month          Recent          Earlier Change          Recent             Earlier    Change
ENERGY
  U.S. Active Rotary Rigs                                           July '10          1,573           931     69.0           1,453 *            1,088 *     33.5
  Spot Crude Oil Price ($/bbl, West Texas Intermediate)             July '10          76.32          65.29    16.9           77.65 *            54.20 *     43.3
  Spot Natural Gas ($/MMBtu, Henry Hub)                             July '10           4.82           3.72    29.6            4.66 *             3.92 *     18.9

UTILITIES AND PRODUCTION
   Houston Purchasing Managers Index                                July '10           52.4          43.8     19.6            55.7 *             43.1 *     29.2
   Nonresidential Electric Current Sales (Mwh, CNP Service Area)    July '10      4,663,282     4,682,892     -0.4      28,543,283         28,100,130        1.6

CONSTRUCTION
  Total Building Contracts ($, Houston MSA)                         July '10    693,601,000   909,986,000     -23.8   5,162,277,000     5,329,382,000         -3.1
  Nonresidential                                                     July '10   236,703,000   351,361,000     -32.6   1,947,737,000     2,420,516,000       -19.5
  Residential                                                        July '10   456,898,000   558,625,000     -18.2   3,214,540,000     2,908,866,000        10.5
  Building Permits ($, City of Houston)                             July '10    264,381,291   391,776,848     -32.5   1,915,292,501     2,441,359,244       -21.5
  Nonresidential                                                     July '10   200,339,600   291,032,204     -31.2   1,276,957,838     1,891,272,020       -32.5
  New Nonresidential                                                July '10     80,418,076   206,294,123    -61.0     429,393,202        779,950,337      -44.9
  Nonresidential Additions/Alterations/Conversions                  July '10    119,921,524    84,738,081      41.5    847,564,636      1,111,321,683      -23.7
  Residential                                                        July '10    64,041,691   100,744,644     -36.4     638,334,663       550,087,224        16.0
  New Residential                                                   July '10     48,077,428    72,165,892    -33.4     488,185,903        402,091,142        21.4
  Residential Additions/Alterations/Conversions                     July '10     15,964,263    28,578,752    -44.1     150,148,760        147,996,082         1.5
  Multiple Listing Service (MLS) Activity
  Closings                                                          July '10          5,056          6,686   -24.4          37,158            35,796         3.8
  Median Sales Price - SF Detached                                  July '10        160,880        162,000    -0.7         153,516 *         149,307 *       2.8
  Active Listings                                                   July '10         55,247         46,598    18.6          50,019 *          45,404 *      10.2

EMPLOYMENT (Houston-Sugar Land-Baytown MSA)
  Nonfarm Payroll Employment                                        July '10      2,511,100     2,528,100     -0.7       2,511,800 *        2,579,000 *      -2.6
  Goods Producing (Natural Resources/Mining/Const/Mfg)              July '10        478,500       477,100      0.3         477,500 *          522,200 *      -8.6
  Service Providing                                                 July '10      2,032,600     2,051,000     -0.9       2,034,300 *        2,056,800 *      -1.1
  Unemployment Rate (%) - Not Seasonally Adjusted
  Houston-Sugar Land-Baytown MSA                                    July '10            8.8            8.3                      8.5 *             6.4 *
  Texas                                                             July '10            8.5            8.3                      8.2 *             6.5 *
  U.S.                                                              July '10            9.7            9.7                      9.8 *             7.9 *
  Unemployment Insurance Claims (Gulf Coast WDA)
  Initial Claims                                                    July '10         23,437         27,221   -13.9          22,590 *          27,016 *      -16.4
  Continuing Claims                                                 July '10        103,648        148,447   -30.2         108,766 *         129,603 *      -16.1

TRANSPORTATION
  Port of Houston Authority Shipments (Short Tons)                  July '10      3,448,962     2,886,101     19.5      19,123,164         18,249,204        4.8
  Air Passengers (Houston Airport System)                           July '10      4,738,759     4,723,973      0.3      28,881,175         28,386,331        1.7
  Domestic Passengers                                               July '10      3,848,421     3,906,014     -1.5      23,847,415         23,753,489        0.4
  International Passengers                                          July '10        890,338       817,959      8.8       5,033,760          4,632,842        8.7
  Landings and Takeoffs                                             July '10         74,044        79,986     -7.4         496,032            518,460       -4.3
  Air Freight (000 lb)                                              July '10         76,734        65,753     16.7         507,805            431,698       17.6
  Enplaned                                                          July '10         40,412        35,105     15.1         266,859            231,527       15.3
  Deplaned                                                          July '10         36,322        30,648     18.5         240,946            200,171       20.4

CONSUMERS
  New Car and Truck Sales (Units, Houston MSA)               July '10                17,810         17,226     3.4         139,819           120,741        15.8
  Cars                                                       July '10                 7,826          7,750     1.0          63,639            54,663        16.4
  Trucks, SUVs and Commercials                               July '10                 9,984          9,476     5.4          76,180            66,078        15.3
  Total Retail Sales ($000,000, Houston MSA, NAICS Basis)      3Q09                  18,738         20,136    -6.9          53,679            59,150        -9.3
  Consumer Price Index for All Urban Consumers ('82-'84=100)
  Houston-Galveston-Brazoria CMSA                            July '10               194.734        192.325     1.3         192.468 *         190.017 *        1.3
  United States                                              July '10               218.011        215.351     1.2         217.603 *         213.455 *        1.9
  Hotel Performance (Harris County)
  Occupancy (%)                                                1Q10                    56.8           62.8                    56.8 *             62.8 *
  Average Room Rate ($)                                        1Q10                   93.91         102.21    -8.1           93.91 *           102.21 *      -8.1
  Revenue Per Available Room ($)                               1Q10                   53.31          64.18   -16.9           53.31 *            64.18 *     -16.9

POSTINGS AND FORECLOSURES
  Postings (Harris County)                                          Aug '10           3,372          3,337     1.0          30,346             25,662       18.3
  Foreclosures (Harris County)                                      Aug '10           1,059            824    28.5           8,898              7,134       24.7


September 2010                                                     ©2010, Greater Houston Partnership                                                     Page 6
HOUSTON—THE ECONOMY AT A GLANCE

Sources
 Rig Count                          Baker Hughes Incorporated               Port Shipments           Port of Houston Authority
 Spot WTI, Spot Natural Gas         U.S. Energy Information Agency          Aviation                 Aviation Department, City of
 Houston Purchasing Managers        National Association of                                           Houston
  Index                              Purchasing Management –                Car and Truck Sales      TexAuto Facts Report, InfoNation,
                                     Houston, Inc.                                                    Inc., Sugar Land TX
 Electricity                        CenterPoint Energy                      Retail Sales             Texas Comptroller’s Office
 Building Construction Contracts    McGraw-Hill Construction                Consumer Price Index     U.S. Bureau of Labor Statistics
 City of Houston Building Permits   Building Permit Department, City        Hotels                   PKF Consulting/Hospitality Asset
                                     of Houston                                                       Advisors International
 MLS Data                           Houston Association of Realtors®        Postings, Foreclosures   Foreclosure Information & Listing
 Employment, Unemployment           Texas Workforce Commission                                        Service


                                                             STAY UP TO DATE!

If you would like to receive this electronic publication on the first working day of each month, please e-
mail your request for Economy at a Glance to rpate@houston.org. Include your name, title and phone
number and your company’s name and address. Archived copies are available to Partnership Members
in the Members Only section at www.houston.org. For information about joining the Greater Houston
Partnership and gaining access to this powerful resource, call Member Services at 713-844-3683.

The foregoing table is updated whenever any data change — typically, 11 or so times per month. If
you would like to receive those updates by e-mail, usually accompanied by commentary, please e-mail
your request for Key Economic Indicators to rpate@houston.org with the same identifying information.

You may request Glance and Indicators in the same e-mail.


September 2010                                              ©2010, Greater Houston Partnership                                    Page 7
HOUSTON—THE ECONOMY AT A GLANCE
   HOUSTON MSA NONFARM PAYROLL EMPLOYMENT (000)
                                                                                                 Change from          % Change from
                                                          July ' 10   Jun ' 10   July '09     Jun '10     July '09   Jun '10   July '09

   Total Nonfarm Payroll Jobs                             2,511.1     2,528.1    2,520.8       -17.0         -9.7      -0.7         -0.4
   Total Private                                          2,150.2     2,150.6    2,167.4        -0.4        -17.2       0.0         -0.8
   Goods Producing                                          478.5       477.1      492.0         1.4        -13.5       0.3         -2.7
   Service Providing                                      2,032.6     2,051.0    2,028.8       -18.4          3.8      -0.9          0.2
    Private Service Providing                             1,671.7     1,673.5    1,675.4        -1.8         -3.7      -0.1         -0.2

    Mining and Logging                                       90.0        89.2       87.7          0.8         2.3       0.9             2.6
      Oil & Gas Extraction                                   51.1        50.9       49.2          0.2         1.9       0.4             3.9
      Support Activities for Mining                          37.7        37.2       37.5          0.5         0.2       1.3             0.5

    Construction                                            167.5       167.8      182.2         -0.3       -14.7      -0.2         -8.1

    Manufacturing                                           221.0       220.1      222.1          0.9         -1.1      0.4         -0.5
     Durable Goods Manufacturing                            141.3       140.7      141.2          0.6          0.1      0.4          0.1
     Nondurable Goods Manufacturing                          79.7        79.4       80.9          0.3         -1.2      0.4         -1.5

    Wholesale Trade                                         127.9       128.0      130.5         -0.1         -2.6     -0.1         -2.0

    Retail Trade                                            260.6       260.5      261.6          0.1         -1.0      0.0         -0.4

    Transportation, Warehousing and Utilities               120.3       119.9      122.6          0.4         -2.3      0.3         -1.9
     Utilities                                               16.6        16.6       16.7          0.0         -0.1      0.0         -0.6
     Air Transportation                                      23.9        23.9       24.6          0.0         -0.7      0.0         -2.8
     Truck Transportation                                    18.6        18.6       18.7          0.0         -0.1      0.0         -0.5
     Pipeline Transportation                                  9.0         8.9        8.8          0.1          0.2      1.1          2.3
     Balance, incl Warehousing, Water & Rail Transport       52.2        51.9       53.8          0.3         -1.6      0.6         -3.0

    Information                                              32.6        32.8       34.5         -0.2         -1.9     -0.6         -5.5
      Telecommunications                                     17.3        17.5       17.9         -0.2         -0.6     -1.1         -3.4

    Finance & Insurance                                      86.4        86.4       88.5          0.0         -2.1      0.0         -2.4

    Real Estate & Rental and Leasing                         51.1        51.3       51.1         -0.2         0.0      -0.4             0.0

    Professional & Business Services                        352.2      352.0      356.7            0.2        -4.5       0.1         -1.3
     Professional, Scientific & Technical Services          169.9      169.5      173.8            0.4        -3.9       0.2         -2.2
      Legal Services                                         23.2       23.2       23.5           0.0        -0.3       0.0         -1.3
      Accounting, Tax Preparation, Bookkeeping               15.6       15.6       16.7           0.0        -1.1       0.0         -6.6
      Architectural, Engineering & Related Services          60.8       60.2       60.8           0.6         0.0       1.0          0.0
      Computer Systems Design & Related Services             23.4       23.6       24.1          -0.2        -0.7      -0.8         -2.9
     Admin & Support/Waste Mgt & Remediation                161.9      162.3      163.7           -0.4        -1.8      -0.2         -1.1
      Administrative & Support Services                     154.3      154.6      155.3          -0.3        -1.0      -0.2         -0.6
       Employment Services                                   51.2       51.3       52.8          -0.1        -1.6      -0.2         -3.0

    Educational Services                                     41.4        42.4       40.7         -1.0         0.7      -2.4             1.7

    Health Care & Social Assistance                         264.9       264.2      256.0          0.7         8.9       0.3             3.5

    Arts, Entertainment & Recreation                         31.0        31.3       31.0         -0.3         0.0      -1.0             0.0

    Accommodation & Food Services                           210.0       210.9      208.8         -0.9         1.2      -0.4             0.6

    Other Services                                           93.3        93.8       93.4         -0.5         -0.1     -0.5         -0.1

    Government                                              360.9      377.5      353.4         -16.6         7.5       -4.4            2.1
     Federal Government                                      32.0       35.5       29.2          -3.5         2.8       -9.9            9.6
     State Government                                        69.2       69.3       68.6          -0.1         0.6       -0.1            0.9
      State Government Educational Services                  36.1       36.1       35.1           0.0         1.0       0.0             2.8
     Local Government                                       259.7      272.7      255.6         -13.0         4.1       -4.8            1.6
      Local Government Educational Services                 171.6      184.6      169.3        -13.0          2.3      -7.0             1.4

   SOURCE: Texas Workforce Commission


September 2010                                           ©2010, Greater Houston Partnership                                    Page 8
HOUSTON—THE ECONOMY AT A GLANCE


                                                                                                Population and Employment

                                                                              Houston-Sugar Land-Baytown MSA 2005-2035


                                                               10
                                                                9
                                                                8
                                                                7
                                                                6
                                                     000,000


                                                                5
                                                                4
                                                                3
                                                                2
                                                                1
                                                                0
                                                                       '05            '10               '15               '20             '25           '30              '35

                                                                             Population              Pop Forecast          Employment           Empl Forecast


         Source: The Perryman Group, Spring/Summer 2010


                                                                                        HOUSTON MSA EMPLOYMENT
                                                                                                                  2001-2011

                                                  2.65                                                                                                                              160

                                                  2.60                                                                                                                              140

                                                  2.55                                                                                                                              120
           NONFARM PAYROLL EMPLOYMENT (000,000)


                                                  2.50                                                                                                                              100

                                                  2.45                                                                                                                              80
                                                                                                                                                                                           12-MONTH CHANGE (000)
                                                  2.40                                                                                                                              60

                                                  2.35                                                                                                                              40

                                                  2.30                                                                                                                              20

                                                  2.25                                                                                                                              0

                                                  2.20                                                                                                                              -20

                                                  2.15                                                                                                                              -40

                                                  2.10                                                                                                                              -60

                                                  2.05                                                                                                                              -80

                                                  2.00                                                                                                                              -100

                                                  1.95                                                                                                                              -120
                                                     Jan-01         Jan-02   Jan-03         Jan-04      Jan-05       Jan-06     Jan-07     Jan-08     Jan-09    Jan-10         Jan-11

                                                                                                              12-MONTH CHANGE      JOBS


         Source: Texas Workforce Commission


September 2010                                                                                       ©2010, Greater Houston Partnership                                                                            Page 9
HOUSTON—THE ECONOMY AT A GLANCE

                                                                      GOODS-PRODUCING AND SERVICE-PROVIDING EMPLOYMENT
                                                                                                           HOUSTON MSA 2001-2011


                                                           550                                                                                                                             2.25

                                                           540                                                                                                                             2.20

                                                           530                                                                                                                             2.15

                                                                                                                                                                                           2.10
                                                           520


                                                                                                                                                                                                  SERVICE-PROVIDING (000,000)
                                                                                                                                                                                           2.05
                                   GOODS-PRODUCING (000)


                                                           510
                                                                                                                                                                                           2.00
                                                           500
                                                                                                                                                                                           1.95
                                                           490
                                                                                                                                                                                           1.90
                                                           480
                                                                                                                                                                                           1.85
                                                           470
                                                                                                                                                                                           1.80
                                                           460
                                                                                                                                                                                           1.75

                                                           450                                                                                                                             1.70

                                                           440                                                                                                                             1.65

                                                           430                                                                                                                             1.60
                                                             Jan-01      Jan-02     Jan-03    Jan-04       Jan-05      Jan-06    Jan-07      Jan-08        Jan-09        Jan-10      Jan-11
                                                                                             GOODS-PRODUCING JOBS                    SERVICE-PROVIDING JOBS


         Source: Texas Workforce Commission

                                                                                                   UNEMPLOYMENT RATE
                                                                                                        HOUSTON & U.S. 2001-2011
                                   11


                                   10


                                   9


                                   8
          PERCENT OF LABOR FORCE


                                   7


                                   6


                                   5


                                   4


                                   3


                                   2


                                   1


                                   0
                                   Jan-01                             Jan-02      Jan-03     Jan-04        Jan-05       Jan-06      Jan-07        Jan-08            Jan-09        Jan-09          Jan-11
                                                                                                                    HOUSTON         U.S.

         Source: Texas Workforce Commission


September 2010                                                                                         ©2010, Greater Houston Partnership                                                                                       Page 10
HOUSTON—THE ECONOMY AT A GLANCE

                                                                                 SPOT MARKET ENERGY PRICES
                                                                                                         2001 - 2011

                                              140                                                                                                                                   28


                                              120                                                                                                                                   24


                                                                                                                                                                                         HENRY HUB NATURAL GAS ($/MMBTU)
            WEST TEXAS INTERMEDIATE ($/BBL)


                                              100                                                                                                                                   20


                                               80                                                                                                                                   16


                                               60                                                                                                                                   12


                                               40                                                                                                                                   8


                                               20                                                                                                                                   4


                                                0                                                                                                                                   0
                                               Jan-01      Jan-02     Jan-03        Jan-04      Jan-05       Jan-06         Jan-07      Jan-08        Jan-09       Jan-10       Jan-11

                                                                             WTI MONTHLY         WTI 12-MO AVG            GAS MONTHLY            GAS 12-MO AVG


         Source: U.S. Energy Information Administration

                                                                                INFLATION: 12-MONTH CHANGE
                                                                                                         2001-2011
          6%


          5%


          4%


          3%


          2%


          1%


          0%


          -1%


          -2%


          -3%
            Jan-01                                      Jan-02      Jan-03        Jan-04       Jan-05            Jan-06      Jan-07       Jan-08          Jan-09       Jan-10        Jan-11
                                                                                             HOUSTON CPI-U                U.S. CPI-U

         Source: U.S. Bureau of Labor Statistics


September 2010                                                                               ©2010, Greater Houston Partnership                                                                                            Page 11

More Related Content

What's hot

Quarterly Economic Trends for Ohio Oil and Gas Industries - Jan 2013
Quarterly Economic Trends for Ohio Oil and Gas Industries - Jan 2013Quarterly Economic Trends for Ohio Oil and Gas Industries - Jan 2013
Quarterly Economic Trends for Ohio Oil and Gas Industries - Jan 2013Marcellus Drilling News
 
2017 Commercial Lending Trends Survey
2017 Commercial Lending Trends Survey2017 Commercial Lending Trends Survey
2017 Commercial Lending Trends Surveycutmytaxes
 
china at the world stage
china at the world stagechina at the world stage
china at the world stageTarik Smajlovic
 
Quarterly Economic Update | Q1 2014
Quarterly Economic Update | Q1 2014Quarterly Economic Update | Q1 2014
Quarterly Economic Update | Q1 2014One Columbus
 
Commercial Real Estate Outlook - November 2010
Commercial Real Estate Outlook - November 2010Commercial Real Estate Outlook - November 2010
Commercial Real Estate Outlook - November 2010NAR Research
 
Economy and equity markets: are they disconnected?
Economy and equity markets: are they disconnected?Economy and equity markets: are they disconnected?
Economy and equity markets: are they disconnected?Markets Beyond
 
Paine Wetzel/TCN 2016 Q4 State of the Market: Central Edition
Paine Wetzel/TCN 2016 Q4 State of the Market: Central EditionPaine Wetzel/TCN 2016 Q4 State of the Market: Central Edition
Paine Wetzel/TCN 2016 Q4 State of the Market: Central EditionMarc Hale
 
Assignment economics (ECON 1550)
Assignment economics (ECON 1550)Assignment economics (ECON 1550)
Assignment economics (ECON 1550)Ain Nur Syazwani
 
Quarterly Economic Update | Q2 2014
Quarterly Economic Update | Q2 2014Quarterly Economic Update | Q2 2014
Quarterly Economic Update | Q2 2014One Columbus
 
Griffon quarterly report - Iran's Macro Economics dashboard - March 2017
Griffon quarterly report - Iran's Macro Economics dashboard - March 2017Griffon quarterly report - Iran's Macro Economics dashboard - March 2017
Griffon quarterly report - Iran's Macro Economics dashboard - March 2017Griffon Capital
 
Weekly media update 04 11_2019
Weekly media update 04 11_2019Weekly media update 04 11_2019
Weekly media update 04 11_2019BalmerLawrie
 
PwC Global Economy Watch (oct. 2013)
PwC Global Economy Watch (oct. 2013)PwC Global Economy Watch (oct. 2013)
PwC Global Economy Watch (oct. 2013)PwC France
 
2015 2Q North American Office Market Report
2015 2Q North American Office Market Report2015 2Q North American Office Market Report
2015 2Q North American Office Market ReportCoy Davidson
 
Credit Policy Of Rbi
Credit Policy Of RbiCredit Policy Of Rbi
Credit Policy Of RbiNirmal Pandya
 

What's hot (19)

Quarterly Economic Trends for Ohio Oil and Gas Industries - Jan 2013
Quarterly Economic Trends for Ohio Oil and Gas Industries - Jan 2013Quarterly Economic Trends for Ohio Oil and Gas Industries - Jan 2013
Quarterly Economic Trends for Ohio Oil and Gas Industries - Jan 2013
 
2017 Commercial Lending Trends Survey
2017 Commercial Lending Trends Survey2017 Commercial Lending Trends Survey
2017 Commercial Lending Trends Survey
 
Economy Matters December 2016
Economy Matters December 2016Economy Matters December 2016
Economy Matters December 2016
 
Phil_Knowledge_2Q2016
Phil_Knowledge_2Q2016Phil_Knowledge_2Q2016
Phil_Knowledge_2Q2016
 
china at the world stage
china at the world stagechina at the world stage
china at the world stage
 
Quarterly Economic Update | Q1 2014
Quarterly Economic Update | Q1 2014Quarterly Economic Update | Q1 2014
Quarterly Economic Update | Q1 2014
 
14 is lm model of ad
14 is lm model of ad14 is lm model of ad
14 is lm model of ad
 
Commercial Real Estate Outlook - November 2010
Commercial Real Estate Outlook - November 2010Commercial Real Estate Outlook - November 2010
Commercial Real Estate Outlook - November 2010
 
Economy and equity markets: are they disconnected?
Economy and equity markets: are they disconnected?Economy and equity markets: are they disconnected?
Economy and equity markets: are they disconnected?
 
Q2 2017 Houston Industrial Research & Forecast Report
Q2 2017 Houston Industrial Research & Forecast ReportQ2 2017 Houston Industrial Research & Forecast Report
Q2 2017 Houston Industrial Research & Forecast Report
 
Paine Wetzel/TCN 2016 Q4 State of the Market: Central Edition
Paine Wetzel/TCN 2016 Q4 State of the Market: Central EditionPaine Wetzel/TCN 2016 Q4 State of the Market: Central Edition
Paine Wetzel/TCN 2016 Q4 State of the Market: Central Edition
 
Ibd20131111
Ibd20131111Ibd20131111
Ibd20131111
 
Assignment economics (ECON 1550)
Assignment economics (ECON 1550)Assignment economics (ECON 1550)
Assignment economics (ECON 1550)
 
Quarterly Economic Update | Q2 2014
Quarterly Economic Update | Q2 2014Quarterly Economic Update | Q2 2014
Quarterly Economic Update | Q2 2014
 
Griffon quarterly report - Iran's Macro Economics dashboard - March 2017
Griffon quarterly report - Iran's Macro Economics dashboard - March 2017Griffon quarterly report - Iran's Macro Economics dashboard - March 2017
Griffon quarterly report - Iran's Macro Economics dashboard - March 2017
 
Weekly media update 04 11_2019
Weekly media update 04 11_2019Weekly media update 04 11_2019
Weekly media update 04 11_2019
 
PwC Global Economy Watch (oct. 2013)
PwC Global Economy Watch (oct. 2013)PwC Global Economy Watch (oct. 2013)
PwC Global Economy Watch (oct. 2013)
 
2015 2Q North American Office Market Report
2015 2Q North American Office Market Report2015 2Q North American Office Market Report
2015 2Q North American Office Market Report
 
Credit Policy Of Rbi
Credit Policy Of RbiCredit Policy Of Rbi
Credit Policy Of Rbi
 

Viewers also liked

Palvelusetelin käyttöönotto kunnissa
Palvelusetelin käyttöönotto kunnissaPalvelusetelin käyttöönotto kunnissa
Palvelusetelin käyttöönotto kunnissaPalveluseteli-hanke
 
Πρόσθεση και αφαίρεση διψήφιων αριθμών(Ι)
Πρόσθεση και αφαίρεση διψήφιων αριθμών(Ι)Πρόσθεση και αφαίρεση διψήφιων αριθμών(Ι)
Πρόσθεση και αφαίρεση διψήφιων αριθμών(Ι)Μαδεμλής Αθανάσιος
 
Palveluntuottajalle asetettavien hyväksymiskriteerien ja sääntökirjan merkitys
Palveluntuottajalle asetettavien hyväksymiskriteerien ja sääntökirjan merkitysPalveluntuottajalle asetettavien hyväksymiskriteerien ja sääntökirjan merkitys
Palveluntuottajalle asetettavien hyväksymiskriteerien ja sääntökirjan merkitysPalveluseteli-hanke
 
Sääntökirjakoulutuksen tarkoitus ja sisältö
Sääntökirjakoulutuksen tarkoitus ja sisältöSääntökirjakoulutuksen tarkoitus ja sisältö
Sääntökirjakoulutuksen tarkoitus ja sisältöPalveluseteli-hanke
 
Kommentteja sääntökirjojen sisältöön
Kommentteja sääntökirjojen sisältöönKommentteja sääntökirjojen sisältöön
Kommentteja sääntökirjojen sisältöönPalveluseteli-hanke
 
Daniel 2
Daniel 2Daniel 2
Daniel 2Maikel
 

Viewers also liked (6)

Palvelusetelin käyttöönotto kunnissa
Palvelusetelin käyttöönotto kunnissaPalvelusetelin käyttöönotto kunnissa
Palvelusetelin käyttöönotto kunnissa
 
Πρόσθεση και αφαίρεση διψήφιων αριθμών(Ι)
Πρόσθεση και αφαίρεση διψήφιων αριθμών(Ι)Πρόσθεση και αφαίρεση διψήφιων αριθμών(Ι)
Πρόσθεση και αφαίρεση διψήφιων αριθμών(Ι)
 
Palveluntuottajalle asetettavien hyväksymiskriteerien ja sääntökirjan merkitys
Palveluntuottajalle asetettavien hyväksymiskriteerien ja sääntökirjan merkitysPalveluntuottajalle asetettavien hyväksymiskriteerien ja sääntökirjan merkitys
Palveluntuottajalle asetettavien hyväksymiskriteerien ja sääntökirjan merkitys
 
Sääntökirjakoulutuksen tarkoitus ja sisältö
Sääntökirjakoulutuksen tarkoitus ja sisältöSääntökirjakoulutuksen tarkoitus ja sisältö
Sääntökirjakoulutuksen tarkoitus ja sisältö
 
Kommentteja sääntökirjojen sisältöön
Kommentteja sääntökirjojen sisältöönKommentteja sääntökirjojen sisältöön
Kommentteja sääntökirjojen sisältöön
 
Daniel 2
Daniel 2Daniel 2
Daniel 2
 

Similar to GHP Houston: The Economy at a Glance

Houston Economy at a Glance
Houston Economy at a GlanceHouston Economy at a Glance
Houston Economy at a GlanceDan Hutchins
 
Houston Economy at a Glance - Augst 2011
Houston Economy at a Glance - Augst 2011Houston Economy at a Glance - Augst 2011
Houston Economy at a Glance - Augst 2011Bob Lowery
 
Reci Q1 2016 Houston MOB Report
Reci Q1 2016 Houston MOB ReportReci Q1 2016 Houston MOB Report
Reci Q1 2016 Houston MOB ReportThomas Amato
 
RECI Q1 2016 Houston MOB Report
RECI Q1 2016 Houston MOB ReportRECI Q1 2016 Houston MOB Report
RECI Q1 2016 Houston MOB ReportThomas Amato
 
Paine Wetzel/TCN 2016 Q4 State of the Market: Central Edition
Paine Wetzel/TCN 2016 Q4 State of the Market: Central EditionPaine Wetzel/TCN 2016 Q4 State of the Market: Central Edition
Paine Wetzel/TCN 2016 Q4 State of the Market: Central EditionMarc Hale
 
2013 Houston Economic Outlook
2013 Houston Economic Outlook2013 Houston Economic Outlook
2013 Houston Economic OutlookCoy Davidson
 
Houston’s Energy Angst - Yardi Matrix Multifamily Winter 2016 Report
Houston’s Energy Angst - Yardi Matrix Multifamily Winter 2016 ReportHouston’s Energy Angst - Yardi Matrix Multifamily Winter 2016 Report
Houston’s Energy Angst - Yardi Matrix Multifamily Winter 2016 ReportAdelina Osan
 
Arbor EconomicOverview 2020 Q1
Arbor EconomicOverview 2020 Q1Arbor EconomicOverview 2020 Q1
Arbor EconomicOverview 2020 Q1Ivan Kaufman
 
Municipal Finance-FINAL
Municipal Finance-FINALMunicipal Finance-FINAL
Municipal Finance-FINALJulia S. Gee
 
2016 Houston Economic Outlook
2016 Houston Economic Outlook2016 Houston Economic Outlook
2016 Houston Economic OutlookCoy Davidson
 
RemX Workforce Perspectives Newsletter - Sept 2017
RemX Workforce Perspectives Newsletter - Sept 2017RemX Workforce Perspectives Newsletter - Sept 2017
RemX Workforce Perspectives Newsletter - Sept 2017Saskia Styles
 
US Economic Overview | Q3 2019
US Economic Overview | Q3 2019US Economic Overview | Q3 2019
US Economic Overview | Q3 2019Ivan Kaufman
 
Houston Glance Dec08
Houston Glance Dec08Houston Glance Dec08
Houston Glance Dec08guestcc4584b5
 
Arbor US Economic Overview 2018 q2
Arbor US Economic Overview 2018 q2Arbor US Economic Overview 2018 q2
Arbor US Economic Overview 2018 q2Ivan Kaufman
 
US Talent Market Monthly April 2014
US Talent Market Monthly April 2014US Talent Market Monthly April 2014
US Talent Market Monthly April 2014Kelly Services
 
US talent market monthly october 2013
US talent market monthly october 2013US talent market monthly october 2013
US talent market monthly october 2013Kelly Services
 
Houston Economy at a Glance November 2013
Houston Economy at a Glance November 2013Houston Economy at a Glance November 2013
Houston Economy at a Glance November 2013Coy Davidson
 

Similar to GHP Houston: The Economy at a Glance (20)

Houston Economy at a Glance
Houston Economy at a GlanceHouston Economy at a Glance
Houston Economy at a Glance
 
Houston Economy at a Glance - Augst 2011
Houston Economy at a Glance - Augst 2011Houston Economy at a Glance - Augst 2011
Houston Economy at a Glance - Augst 2011
 
Reci Q1 2016 Houston MOB Report
Reci Q1 2016 Houston MOB ReportReci Q1 2016 Houston MOB Report
Reci Q1 2016 Houston MOB Report
 
RECI Q1 2016 Houston MOB Report
RECI Q1 2016 Houston MOB ReportRECI Q1 2016 Houston MOB Report
RECI Q1 2016 Houston MOB Report
 
Paine Wetzel/TCN 2016 Q4 State of the Market: Central Edition
Paine Wetzel/TCN 2016 Q4 State of the Market: Central EditionPaine Wetzel/TCN 2016 Q4 State of the Market: Central Edition
Paine Wetzel/TCN 2016 Q4 State of the Market: Central Edition
 
2013 Houston Economic Outlook
2013 Houston Economic Outlook2013 Houston Economic Outlook
2013 Houston Economic Outlook
 
2013 Houston Economic Outlook
2013 Houston Economic Outlook2013 Houston Economic Outlook
2013 Houston Economic Outlook
 
Houston’s Energy Angst - Yardi Matrix Multifamily Winter 2016 Report
Houston’s Energy Angst - Yardi Matrix Multifamily Winter 2016 ReportHouston’s Energy Angst - Yardi Matrix Multifamily Winter 2016 Report
Houston’s Energy Angst - Yardi Matrix Multifamily Winter 2016 Report
 
Arbor EconomicOverview 2020 Q1
Arbor EconomicOverview 2020 Q1Arbor EconomicOverview 2020 Q1
Arbor EconomicOverview 2020 Q1
 
Municipal Finance-FINAL
Municipal Finance-FINALMunicipal Finance-FINAL
Municipal Finance-FINAL
 
2016 Houston Economic Outlook
2016 Houston Economic Outlook2016 Houston Economic Outlook
2016 Houston Economic Outlook
 
hou160531
hou160531hou160531
hou160531
 
RemX Workforce Perspectives Newsletter - Sept 2017
RemX Workforce Perspectives Newsletter - Sept 2017RemX Workforce Perspectives Newsletter - Sept 2017
RemX Workforce Perspectives Newsletter - Sept 2017
 
US Economic Overview | Q3 2019
US Economic Overview | Q3 2019US Economic Overview | Q3 2019
US Economic Overview | Q3 2019
 
Houston Glance Dec08
Houston Glance Dec08Houston Glance Dec08
Houston Glance Dec08
 
Arbor US Economic Overview 2018 q2
Arbor US Economic Overview 2018 q2Arbor US Economic Overview 2018 q2
Arbor US Economic Overview 2018 q2
 
US Talent Market Monthly April 2014
US Talent Market Monthly April 2014US Talent Market Monthly April 2014
US Talent Market Monthly April 2014
 
US talent market monthly october 2013
US talent market monthly october 2013US talent market monthly october 2013
US talent market monthly october 2013
 
Unemployment Rate (September 2014)
Unemployment Rate (September 2014)Unemployment Rate (September 2014)
Unemployment Rate (September 2014)
 
Houston Economy at a Glance November 2013
Houston Economy at a Glance November 2013Houston Economy at a Glance November 2013
Houston Economy at a Glance November 2013
 

More from Bob Lowery

PWC Emerging Trends in Real Estate 2012
PWC Emerging Trends in Real Estate 2012PWC Emerging Trends in Real Estate 2012
PWC Emerging Trends in Real Estate 2012Bob Lowery
 
HealthCare Appraisers - 2011 Report
HealthCare Appraisers - 2011 ReportHealthCare Appraisers - 2011 Report
HealthCare Appraisers - 2011 ReportBob Lowery
 
Houston Association of Realtors - Housing Update
Houston Association of Realtors - Housing UpdateHouston Association of Realtors - Housing Update
Houston Association of Realtors - Housing UpdateBob Lowery
 
The Outlook for Health Care - Gary Schilling
The Outlook for Health Care - Gary SchillingThe Outlook for Health Care - Gary Schilling
The Outlook for Health Care - Gary SchillingBob Lowery
 
PWC/ULI - 2011 Emerging Trends in Real Estate
PWC/ULI - 2011 Emerging Trends in Real Estate PWC/ULI - 2011 Emerging Trends in Real Estate
PWC/ULI - 2011 Emerging Trends in Real Estate Bob Lowery
 
Costar Advisory Report: Houston Office - 3Q 2010
Costar Advisory Report:  Houston Office - 3Q 2010Costar Advisory Report:  Houston Office - 3Q 2010
Costar Advisory Report: Houston Office - 3Q 2010Bob Lowery
 
GHP: The Economy at a Glance - October 2010
GHP: The Economy at a Glance - October 2010GHP: The Economy at a Glance - October 2010
GHP: The Economy at a Glance - October 2010Bob Lowery
 
Oilwatch Monthly - August 2010
Oilwatch Monthly - August 2010Oilwatch Monthly - August 2010
Oilwatch Monthly - August 2010Bob Lowery
 
Coldwell Banker Commercial - Office
Coldwell Banker Commercial - OfficeColdwell Banker Commercial - Office
Coldwell Banker Commercial - OfficeBob Lowery
 
NFIB: Small Business
NFIB: Small BusinessNFIB: Small Business
NFIB: Small BusinessBob Lowery
 
Policom: (Cities) Economic Strength Rankings
Policom: (Cities) Economic Strength RankingsPolicom: (Cities) Economic Strength Rankings
Policom: (Cities) Economic Strength RankingsBob Lowery
 
Houston Office Market Report: Mid-Year 2010
Houston Office Market Report: Mid-Year 2010Houston Office Market Report: Mid-Year 2010
Houston Office Market Report: Mid-Year 2010Bob Lowery
 
Pimco Commercial Real Estate - June 2010
Pimco Commercial Real Estate - June 2010Pimco Commercial Real Estate - June 2010
Pimco Commercial Real Estate - June 2010Bob Lowery
 
Office Tenant Retention Tips
Office Tenant Retention TipsOffice Tenant Retention Tips
Office Tenant Retention TipsBob Lowery
 
Texas Landlords and Tenants Guide - 2010
Texas Landlords and Tenants Guide - 2010Texas Landlords and Tenants Guide - 2010
Texas Landlords and Tenants Guide - 2010Bob Lowery
 
SSRN Paper: Expected Returns and the Expected Growth in Rents of Commercial R...
SSRN Paper: Expected Returns and the Expected Growth in Rents of Commercial R...SSRN Paper: Expected Returns and the Expected Growth in Rents of Commercial R...
SSRN Paper: Expected Returns and the Expected Growth in Rents of Commercial R...Bob Lowery
 
Grant Thornton: TxDOT Managament and Organizational Review
Grant Thornton: TxDOT Managament and Organizational ReviewGrant Thornton: TxDOT Managament and Organizational Review
Grant Thornton: TxDOT Managament and Organizational ReviewBob Lowery
 
Ssrn commercial real estate leasing litigation
Ssrn commercial real estate leasing litigationSsrn commercial real estate leasing litigation
Ssrn commercial real estate leasing litigationBob Lowery
 
Construction White Paper
Construction White PaperConstruction White Paper
Construction White PaperBob Lowery
 
Oilwatch Monthly - April 2010
Oilwatch Monthly - April 2010Oilwatch Monthly - April 2010
Oilwatch Monthly - April 2010Bob Lowery
 

More from Bob Lowery (20)

PWC Emerging Trends in Real Estate 2012
PWC Emerging Trends in Real Estate 2012PWC Emerging Trends in Real Estate 2012
PWC Emerging Trends in Real Estate 2012
 
HealthCare Appraisers - 2011 Report
HealthCare Appraisers - 2011 ReportHealthCare Appraisers - 2011 Report
HealthCare Appraisers - 2011 Report
 
Houston Association of Realtors - Housing Update
Houston Association of Realtors - Housing UpdateHouston Association of Realtors - Housing Update
Houston Association of Realtors - Housing Update
 
The Outlook for Health Care - Gary Schilling
The Outlook for Health Care - Gary SchillingThe Outlook for Health Care - Gary Schilling
The Outlook for Health Care - Gary Schilling
 
PWC/ULI - 2011 Emerging Trends in Real Estate
PWC/ULI - 2011 Emerging Trends in Real Estate PWC/ULI - 2011 Emerging Trends in Real Estate
PWC/ULI - 2011 Emerging Trends in Real Estate
 
Costar Advisory Report: Houston Office - 3Q 2010
Costar Advisory Report:  Houston Office - 3Q 2010Costar Advisory Report:  Houston Office - 3Q 2010
Costar Advisory Report: Houston Office - 3Q 2010
 
GHP: The Economy at a Glance - October 2010
GHP: The Economy at a Glance - October 2010GHP: The Economy at a Glance - October 2010
GHP: The Economy at a Glance - October 2010
 
Oilwatch Monthly - August 2010
Oilwatch Monthly - August 2010Oilwatch Monthly - August 2010
Oilwatch Monthly - August 2010
 
Coldwell Banker Commercial - Office
Coldwell Banker Commercial - OfficeColdwell Banker Commercial - Office
Coldwell Banker Commercial - Office
 
NFIB: Small Business
NFIB: Small BusinessNFIB: Small Business
NFIB: Small Business
 
Policom: (Cities) Economic Strength Rankings
Policom: (Cities) Economic Strength RankingsPolicom: (Cities) Economic Strength Rankings
Policom: (Cities) Economic Strength Rankings
 
Houston Office Market Report: Mid-Year 2010
Houston Office Market Report: Mid-Year 2010Houston Office Market Report: Mid-Year 2010
Houston Office Market Report: Mid-Year 2010
 
Pimco Commercial Real Estate - June 2010
Pimco Commercial Real Estate - June 2010Pimco Commercial Real Estate - June 2010
Pimco Commercial Real Estate - June 2010
 
Office Tenant Retention Tips
Office Tenant Retention TipsOffice Tenant Retention Tips
Office Tenant Retention Tips
 
Texas Landlords and Tenants Guide - 2010
Texas Landlords and Tenants Guide - 2010Texas Landlords and Tenants Guide - 2010
Texas Landlords and Tenants Guide - 2010
 
SSRN Paper: Expected Returns and the Expected Growth in Rents of Commercial R...
SSRN Paper: Expected Returns and the Expected Growth in Rents of Commercial R...SSRN Paper: Expected Returns and the Expected Growth in Rents of Commercial R...
SSRN Paper: Expected Returns and the Expected Growth in Rents of Commercial R...
 
Grant Thornton: TxDOT Managament and Organizational Review
Grant Thornton: TxDOT Managament and Organizational ReviewGrant Thornton: TxDOT Managament and Organizational Review
Grant Thornton: TxDOT Managament and Organizational Review
 
Ssrn commercial real estate leasing litigation
Ssrn commercial real estate leasing litigationSsrn commercial real estate leasing litigation
Ssrn commercial real estate leasing litigation
 
Construction White Paper
Construction White PaperConstruction White Paper
Construction White Paper
 
Oilwatch Monthly - April 2010
Oilwatch Monthly - April 2010Oilwatch Monthly - April 2010
Oilwatch Monthly - April 2010
 

Recently uploaded

Kenya’s Coconut Value Chain by Gatsby Africa
Kenya’s Coconut Value Chain by Gatsby AfricaKenya’s Coconut Value Chain by Gatsby Africa
Kenya’s Coconut Value Chain by Gatsby Africaictsugar
 
Call Girls In Radisson Blu Hotel New Delhi Paschim Vihar ❤️8860477959 Escorts...
Call Girls In Radisson Blu Hotel New Delhi Paschim Vihar ❤️8860477959 Escorts...Call Girls In Radisson Blu Hotel New Delhi Paschim Vihar ❤️8860477959 Escorts...
Call Girls In Radisson Blu Hotel New Delhi Paschim Vihar ❤️8860477959 Escorts...lizamodels9
 
8447779800, Low rate Call girls in Shivaji Enclave Delhi NCR
8447779800, Low rate Call girls in Shivaji Enclave Delhi NCR8447779800, Low rate Call girls in Shivaji Enclave Delhi NCR
8447779800, Low rate Call girls in Shivaji Enclave Delhi NCRashishs7044
 
Call Girls In Connaught Place Delhi ❤️88604**77959_Russian 100% Genuine Escor...
Call Girls In Connaught Place Delhi ❤️88604**77959_Russian 100% Genuine Escor...Call Girls In Connaught Place Delhi ❤️88604**77959_Russian 100% Genuine Escor...
Call Girls In Connaught Place Delhi ❤️88604**77959_Russian 100% Genuine Escor...lizamodels9
 
Call Girls In Sikandarpur Gurgaon ❤️8860477959_Russian 100% Genuine Escorts I...
Call Girls In Sikandarpur Gurgaon ❤️8860477959_Russian 100% Genuine Escorts I...Call Girls In Sikandarpur Gurgaon ❤️8860477959_Russian 100% Genuine Escorts I...
Call Girls In Sikandarpur Gurgaon ❤️8860477959_Russian 100% Genuine Escorts I...lizamodels9
 
Marketing Management Business Plan_My Sweet Creations
Marketing Management Business Plan_My Sweet CreationsMarketing Management Business Plan_My Sweet Creations
Marketing Management Business Plan_My Sweet Creationsnakalysalcedo61
 
Intro to BCG's Carbon Emissions Benchmark_vF.pdf
Intro to BCG's Carbon Emissions Benchmark_vF.pdfIntro to BCG's Carbon Emissions Benchmark_vF.pdf
Intro to BCG's Carbon Emissions Benchmark_vF.pdfpollardmorgan
 
8447779800, Low rate Call girls in Uttam Nagar Delhi NCR
8447779800, Low rate Call girls in Uttam Nagar Delhi NCR8447779800, Low rate Call girls in Uttam Nagar Delhi NCR
8447779800, Low rate Call girls in Uttam Nagar Delhi NCRashishs7044
 
FULL ENJOY Call girls in Paharganj Delhi | 8377087607
FULL ENJOY Call girls in Paharganj Delhi | 8377087607FULL ENJOY Call girls in Paharganj Delhi | 8377087607
FULL ENJOY Call girls in Paharganj Delhi | 8377087607dollysharma2066
 
NewBase 19 April 2024 Energy News issue - 1717 by Khaled Al Awadi.pdf
NewBase  19 April  2024  Energy News issue - 1717 by Khaled Al Awadi.pdfNewBase  19 April  2024  Energy News issue - 1717 by Khaled Al Awadi.pdf
NewBase 19 April 2024 Energy News issue - 1717 by Khaled Al Awadi.pdfKhaled Al Awadi
 
/:Call Girls In Indirapuram Ghaziabad ➥9990211544 Independent Best Escorts In...
/:Call Girls In Indirapuram Ghaziabad ➥9990211544 Independent Best Escorts In.../:Call Girls In Indirapuram Ghaziabad ➥9990211544 Independent Best Escorts In...
/:Call Girls In Indirapuram Ghaziabad ➥9990211544 Independent Best Escorts In...lizamodels9
 
Kenya Coconut Production Presentation by Dr. Lalith Perera
Kenya Coconut Production Presentation by Dr. Lalith PereraKenya Coconut Production Presentation by Dr. Lalith Perera
Kenya Coconut Production Presentation by Dr. Lalith Pereraictsugar
 
Independent Call Girls Andheri Nightlaila 9967584737
Independent Call Girls Andheri Nightlaila 9967584737Independent Call Girls Andheri Nightlaila 9967584737
Independent Call Girls Andheri Nightlaila 9967584737Riya Pathan
 
(Best) ENJOY Call Girls in Faridabad Ex | 8377087607
(Best) ENJOY Call Girls in Faridabad Ex | 8377087607(Best) ENJOY Call Girls in Faridabad Ex | 8377087607
(Best) ENJOY Call Girls in Faridabad Ex | 8377087607dollysharma2066
 
Lean: From Theory to Practice — One City’s (and Library’s) Lean Story… Abridged
Lean: From Theory to Practice — One City’s (and Library’s) Lean Story… AbridgedLean: From Theory to Practice — One City’s (and Library’s) Lean Story… Abridged
Lean: From Theory to Practice — One City’s (and Library’s) Lean Story… AbridgedKaiNexus
 
8447779800, Low rate Call girls in Tughlakabad Delhi NCR
8447779800, Low rate Call girls in Tughlakabad Delhi NCR8447779800, Low rate Call girls in Tughlakabad Delhi NCR
8447779800, Low rate Call girls in Tughlakabad Delhi NCRashishs7044
 
8447779800, Low rate Call girls in New Ashok Nagar Delhi NCR
8447779800, Low rate Call girls in New Ashok Nagar Delhi NCR8447779800, Low rate Call girls in New Ashok Nagar Delhi NCR
8447779800, Low rate Call girls in New Ashok Nagar Delhi NCRashishs7044
 
The CMO Survey - Highlights and Insights Report - Spring 2024
The CMO Survey - Highlights and Insights Report - Spring 2024The CMO Survey - Highlights and Insights Report - Spring 2024
The CMO Survey - Highlights and Insights Report - Spring 2024christinemoorman
 

Recently uploaded (20)

Kenya’s Coconut Value Chain by Gatsby Africa
Kenya’s Coconut Value Chain by Gatsby AfricaKenya’s Coconut Value Chain by Gatsby Africa
Kenya’s Coconut Value Chain by Gatsby Africa
 
Call Girls In Radisson Blu Hotel New Delhi Paschim Vihar ❤️8860477959 Escorts...
Call Girls In Radisson Blu Hotel New Delhi Paschim Vihar ❤️8860477959 Escorts...Call Girls In Radisson Blu Hotel New Delhi Paschim Vihar ❤️8860477959 Escorts...
Call Girls In Radisson Blu Hotel New Delhi Paschim Vihar ❤️8860477959 Escorts...
 
8447779800, Low rate Call girls in Shivaji Enclave Delhi NCR
8447779800, Low rate Call girls in Shivaji Enclave Delhi NCR8447779800, Low rate Call girls in Shivaji Enclave Delhi NCR
8447779800, Low rate Call girls in Shivaji Enclave Delhi NCR
 
Call Girls In Connaught Place Delhi ❤️88604**77959_Russian 100% Genuine Escor...
Call Girls In Connaught Place Delhi ❤️88604**77959_Russian 100% Genuine Escor...Call Girls In Connaught Place Delhi ❤️88604**77959_Russian 100% Genuine Escor...
Call Girls In Connaught Place Delhi ❤️88604**77959_Russian 100% Genuine Escor...
 
Call Girls In Sikandarpur Gurgaon ❤️8860477959_Russian 100% Genuine Escorts I...
Call Girls In Sikandarpur Gurgaon ❤️8860477959_Russian 100% Genuine Escorts I...Call Girls In Sikandarpur Gurgaon ❤️8860477959_Russian 100% Genuine Escorts I...
Call Girls In Sikandarpur Gurgaon ❤️8860477959_Russian 100% Genuine Escorts I...
 
Marketing Management Business Plan_My Sweet Creations
Marketing Management Business Plan_My Sweet CreationsMarketing Management Business Plan_My Sweet Creations
Marketing Management Business Plan_My Sweet Creations
 
Intro to BCG's Carbon Emissions Benchmark_vF.pdf
Intro to BCG's Carbon Emissions Benchmark_vF.pdfIntro to BCG's Carbon Emissions Benchmark_vF.pdf
Intro to BCG's Carbon Emissions Benchmark_vF.pdf
 
8447779800, Low rate Call girls in Uttam Nagar Delhi NCR
8447779800, Low rate Call girls in Uttam Nagar Delhi NCR8447779800, Low rate Call girls in Uttam Nagar Delhi NCR
8447779800, Low rate Call girls in Uttam Nagar Delhi NCR
 
Japan IT Week 2024 Brochure by 47Billion (English)
Japan IT Week 2024 Brochure by 47Billion (English)Japan IT Week 2024 Brochure by 47Billion (English)
Japan IT Week 2024 Brochure by 47Billion (English)
 
FULL ENJOY Call girls in Paharganj Delhi | 8377087607
FULL ENJOY Call girls in Paharganj Delhi | 8377087607FULL ENJOY Call girls in Paharganj Delhi | 8377087607
FULL ENJOY Call girls in Paharganj Delhi | 8377087607
 
NewBase 19 April 2024 Energy News issue - 1717 by Khaled Al Awadi.pdf
NewBase  19 April  2024  Energy News issue - 1717 by Khaled Al Awadi.pdfNewBase  19 April  2024  Energy News issue - 1717 by Khaled Al Awadi.pdf
NewBase 19 April 2024 Energy News issue - 1717 by Khaled Al Awadi.pdf
 
/:Call Girls In Indirapuram Ghaziabad ➥9990211544 Independent Best Escorts In...
/:Call Girls In Indirapuram Ghaziabad ➥9990211544 Independent Best Escorts In.../:Call Girls In Indirapuram Ghaziabad ➥9990211544 Independent Best Escorts In...
/:Call Girls In Indirapuram Ghaziabad ➥9990211544 Independent Best Escorts In...
 
Kenya Coconut Production Presentation by Dr. Lalith Perera
Kenya Coconut Production Presentation by Dr. Lalith PereraKenya Coconut Production Presentation by Dr. Lalith Perera
Kenya Coconut Production Presentation by Dr. Lalith Perera
 
Independent Call Girls Andheri Nightlaila 9967584737
Independent Call Girls Andheri Nightlaila 9967584737Independent Call Girls Andheri Nightlaila 9967584737
Independent Call Girls Andheri Nightlaila 9967584737
 
Corporate Profile 47Billion Information Technology
Corporate Profile 47Billion Information TechnologyCorporate Profile 47Billion Information Technology
Corporate Profile 47Billion Information Technology
 
(Best) ENJOY Call Girls in Faridabad Ex | 8377087607
(Best) ENJOY Call Girls in Faridabad Ex | 8377087607(Best) ENJOY Call Girls in Faridabad Ex | 8377087607
(Best) ENJOY Call Girls in Faridabad Ex | 8377087607
 
Lean: From Theory to Practice — One City’s (and Library’s) Lean Story… Abridged
Lean: From Theory to Practice — One City’s (and Library’s) Lean Story… AbridgedLean: From Theory to Practice — One City’s (and Library’s) Lean Story… Abridged
Lean: From Theory to Practice — One City’s (and Library’s) Lean Story… Abridged
 
8447779800, Low rate Call girls in Tughlakabad Delhi NCR
8447779800, Low rate Call girls in Tughlakabad Delhi NCR8447779800, Low rate Call girls in Tughlakabad Delhi NCR
8447779800, Low rate Call girls in Tughlakabad Delhi NCR
 
8447779800, Low rate Call girls in New Ashok Nagar Delhi NCR
8447779800, Low rate Call girls in New Ashok Nagar Delhi NCR8447779800, Low rate Call girls in New Ashok Nagar Delhi NCR
8447779800, Low rate Call girls in New Ashok Nagar Delhi NCR
 
The CMO Survey - Highlights and Insights Report - Spring 2024
The CMO Survey - Highlights and Insights Report - Spring 2024The CMO Survey - Highlights and Insights Report - Spring 2024
The CMO Survey - Highlights and Insights Report - Spring 2024
 

GHP Houston: The Economy at a Glance

  • 1. A publication of the Greater Houston Partnership Volume 19, Number 9 • September 2010 Employment Continues to Recover — Employment is perhaps the most watched of all economic indicators. Everyone knows what it means to have a job, and in the past year and a half, many have come to know what it means to lose one. It’s less clear what is meant by indicators like interest rate spreads; nondefense capital goods; or the M2 money supply. But it is obvious what it means when your neigh- bor, your brother or you are out of work. Clearly, the employment data has its problems. It fluctuates because of seasonal factors. Retailers, ramping up for the holiday shopping season, add sales staff in November; and as sales wind down, they let workers go in January. School pay- rolls rise in the fall as educators return to campus, but drop in June with the sum- mer vacations. The Texas Workforce Commission (TWC) and the Houston branch of the Federal Reserve Bank of Dallas attempt to factor out these seasonal fluctuations. By doing so, they hope to determine a true picture of what’s happening in the labor markets. Here are their “seasonally adjusted” employment numbers for the recent recession in Houston-Sugar Land-Baytown Metro Area:    EMPLOYMENT DATA  UNADJUSTED  ADJUSTED BY TWC  ADJUSTED BY THE FED  Peak Employment Month  December ’08   August ’08   August ’08   Peak Employment  2,632,300  2,619,200  2,622,100  Trough Month  January ’10   January ’10   January ’10   Trough Employment  2,479,500  2,503,300  2,512,000  Jobs Lost in Recession  152,800  115,900  110,100  July ’10 Employment  2,511,100  2,520,400  2,541,100  Jobs Added Since Trough  31,600  17,100  29,100  Percent Recouped  20.7%  14.8%  26.4%   Average Monthly Job Gains  5,267  2,850  4,850  Looking at either adjusted or unadjusted data, it appears that the region stopped losing jobs in January of this year, and has been adding jobs, albeit slowly, since then. Six months into the recovery, Houston has replaced one-seventh to one- fourth of the jobs it lost, depending upon which adjusted numbers you use. Based September 2010 ©2010, Greater Houston Partnership Page 1
  • 2. HOUSTON—THE ECONOMY AT A GLANCE on rate of job creation over the past half year, Houston could recover all the jobs lost in the recession in another 18 to 36 months. Please note, this is a “back of the envelope” calculation, and full recovery could occur sooner or later, depending on such factors as the lifting of the drilling moratorium, the imposition of carbon cap and trade regulations, extension of the Bush era tax cuts, the performance of the stock market, improvements in the commercial real estate market, and budget aus- terity in Austin and Washington. Traditionally, GHP has monitored the number of jobs Houston has gained or lost over a 12-month period. That has been our way of handling the seasonality of the data. The Texas Workforce Commission reports that the 12-month job loss in the Houston metro fell to 9,700 jobs, or 0.4 percent, from July ’09 to July ’10. That is a considerable improvement over the 80,800 job loss (3.1 percent), reported for the 12 months ending July ’09. During the recession, the worst period was for the 12 months ending November ’09, when the region shed 103,800 jobs. Over the past six months, the 12-month job losses have declined consistently; and if the trend continues, Houston’s 12-month job change should turn positive in the next month or two. TWC and the Fed calculate seasonal adjustments only for total employment. Looking back at the unadjusted estimates of employment by industry during the recession, a few trends stand out. • Since August ’08, when private sector employment began to decline, the oil and gas industry has added 3,200 jobs. The oilfield services sector has added jobs every month since April ’10. To date, the offshore drilling moratorium isn’t showing up in the employment numbers. • Employment in health care and social assistance has continued to grow, add- ing 18,200 jobs during the recession. Though recent health care legislation may complicate the delivery and payment for services, it won’t stifle the need for health care. Two demographic trends, an aging population and a rapidly growing population, will continue to fuel the demand for health care workers in Houston. • Houston’s manufacturing sector is slowly recovering. Employment peaked at 245,100 jobs in December ’08, declined for 14 consecutive months, and is trending up, adding 4,000 jobs since the first of the year. The 12-month job loss has declined from 27,000 in January ’10 to 1,100 in July ’10. To summarize, the job market shows some signs of recovery, but it still has quite a way to go before reaching the previous peak. Houston to Lead in Population Growth — The Houston–Sugar Land–Baytown Metro Area will lead the state in population growth, adding 3.53 million residents, September 2010 ©2010, Greater Houston Partnership Page 2
  • 3. HOUSTON—THE ECONOMY AT A GLANCE between ’09 and ’35, according to a forecast recently released by The Perryman Group. That reflects a 1.84 percent annual growth rate. Dallas-Plano ranks second in projected population growth, adding 2.61 million residents during the same period, a 1.84 percent compound annual growth rate, and Austin ranks third, add- ing 500,072 residents, a 2.65 percent compound annual growth rate. Perryman also forecasts that Houston will add an additional 1.325 million jobs and account for almost one-fourth of Texas job growth during that time frame. That reflects a 1.57 percent annual growth rate. Real gross product, the final value of all goods and services produced in Houston adjusted for inflation, will grow from $284.5 billion in ’09 to $747.3 billion in 2035. That reflects a 3.78 percent compound annual growth rate. The forecast is in 2000 constant dollars. “The long-term forecast for the state is positive and a return to steady, healthy growth is anticipated,” the report states. International Passenger Travel Increases — The Houston Airport System served 4.74 million passengers in July ’10, bringing its 12-month total to 49.0 mil- lion passengers. This is 6.7 percent less than the record 52.3 million passengers served during the 12 months ending July ’08. Although most passengers are traveling domestically, the majority of growth oc- curred in international travel. The first seven months of the year saw a 4.4 percent increase in international passengers, while domestic travel only rose 0.1 percent. The greatest rise in passenger volume occurred in travel to Canada (22.4 percent), Europe (12.4 percent) and the Middle East (11.6 percent increase). Dubai-based Emirates recently announced plans to add a second daily nonstop flight from Houston Intercontinental to the U.A.E. to handle growing demand for service to the Middle East. “So far this year, each and every month has produced an increase in the number of international passengers,” said Director, Air Service Development, Genaro Peña. “The additional passengers and new nonstop flights have combined to create very positive momentum for HAS in 2010.” Air freight volumes also continue to grow. HAS handled 76.7 million pounds of air freight in July ’10, up 16.7 percent from July ’09. Year-to-date, HAS handled 507.8 million pounds of air freight, up 17.6 percent compared to the same seven months last year. International Trade Posts Gains —  Through the first six months of ’10, the Houston-Galveston Customs District handled $100.9 billion in trade, up 31.6 percent from $76.7 billion the first six months of ’09. Exports totaled $44.4 billion, September 2010 ©2010, Greater Houston Partnership Page 3
  • 4. HOUSTON—THE ECONOMY AT A GLANCE up 27.7 percent from ’09; and imports totaled $56.5 billion, up 34.8 percent from the same period last year. Five commodities accounted for 73.6 percent of all exports through Houston in the first half of this year: mineral fuel and oil ($12.4 billion), industrial machinery ($8.2 billion) organic chemicals ($6.6 billion), plastics ($3.4 billion) and electric machinery ($2.2 billion). Five commodities accounted for 71.2 percent of all imports handled by the Houston-Galveston customs district: crude oil ($33.0 billion), non-crude oil ($4.1 billion), parts and accessories for ADP machines ($1.4 billion), light oils ($1.0 billion) and casing and tubing ($574.6 million). Houston’s top 20 trade partners accounted for 71.7 percent of the region’s total trade. All but three are showing increases in trade during the first six months of ’10 compared to the same period last year. HOUSTON GALVESTON CUSTOMS DISTRICT TRADE SUMMARY  COMBINED IMPORTS + EXPORTS ($ Millions)  JUN ’10 YTD  JUN ’09 YTD  Change ’09 – ’10   Mexico  10,348.2  6,432.7  3,915.4  Venezuela  7,959.8  4,980.3  2,979.4  Nigeria  6,368.4  3,682.5  2,685.9  Brazil  5,062.7  3,654.6  1,408.1  Russia  4,103.9  2,992.7  1,111.2  Saudi Arabia  4,048.4  2,677.0  1,371.4  China  3,865.1  5,141.2  ‐1,27611  Colombia  3,666.0  1,984.5  1,681.5  Germany  3,182.0  3,053.0  129.0  United Kingdom  2,995.7  3,090.5  ‐94.7  Algeria  2,866.1  1,786.6  1,079.5  Netherlands  2,702.9  2,810.4  ‐107.4  Singapore  2,363.3  1,338.5  1,024.7  Korea, Republic Of  2,348.8  1,738.4  610.4  Costa Rica  2,069.9  625.2  1,444.8  Belgium  2,037.7  1,364.5  673.1  Chile  1,770.9  1,245.9  524.9  Japan  1,643.6  1,441.3  202.3  India  1,585.1  1,421.3  163.8  Iraq  1,389.2  1,221.5  167.7  All Other Countries  28,554.7  24,026.0  4,528.7  Houston Total  $100,932.4  $76,708.6  $24,223.8  Source: U.S. Census Bureau  September 2010 ©2010, Greater Houston Partnership Page 4
  • 5. HOUSTON—THE ECONOMY AT A GLANCE New Home Sales Fall — Net sales of new single-family homes fell to 888 transactions in July ’10, a 35 percent decline compared to July ’09, according to Metrostudy’s July Monthly Sales and Traffic Report. Though July sales were down compared to a year ago, they were actually up 11 percent compared to June ’10. Over the first five months of ’10, new home sales grew as consumers accelerated their purchase decisions to take advantage of the new homebuyer tax credit. Once the new homebuyer’s tax credit expired, new home purchases dropped significantly. In the wake of weak demand, builders continue to carefully manage their inventories. The number of spec units under construction saw no growth compared to July ’09 and remained at 1,825. Finished spec inventory rose to 1,371, a 19.4 percent increase from July ’09. Metrostudy estimates that single-family starts in the Houston area will total 18,000 in ’10 and 20,000-21,000 in ’11. Houston’s Cost of Living Remains Below National Average — In Q2/10, the cost of living in Houston was 19 percent below the average for 27 metropolitan areas over 2 million population and 10 percent below the average for all 314 reporting places, according to the ACCRA Cost of Living Index. The index, pro- duced by the Council for Community and Economic Research, measures differences in the relative cost of consumer goods and services appropriate for a professional or managerial household in the top income quintile. Houston’s low cost of living is mostly because of its bargain housing prices. In Q2/10, housing costs in Houston were 39 percent below the major metro average and 22 percent below the average of all reporting places. According to the ACCRA survey, the same new house that cost $211,432 in Houston in July cost $322,968 in Miami, $471,000 in Boston and $609,952 in Washington, D.C. The cost of grocery items in Houston was the lowest among the major metro areas, 16 percent below the major metro average and 12 percent below the national aver- age. Houston did not differ significantly from the nationwide average on the other components: utilities, transportation, health care, and miscellaneous goods and services. ____________________________________ The Greater Houston Partnership is the primary advocate of Houston’s business community and is dedicated to building regional economic prosperity. Visit the Greater Houston Partnership on the World Wide Web at www.houston.org. Contact us by phone at 713-844-3600. September 2010 ©2010, Greater Houston Partnership Page 5
  • 6. HOUSTON—THE ECONOMY AT A GLANCE Houston Economic Indicators YEAR-TO-DATE A Service of the Greater Houston Partnership MONTHLY DATA TOTAL OR AVERAGE* Most Year % Most Year % Month Recent Earlier Change Recent Earlier Change ENERGY U.S. Active Rotary Rigs July '10 1,573 931 69.0 1,453 * 1,088 * 33.5 Spot Crude Oil Price ($/bbl, West Texas Intermediate) July '10 76.32 65.29 16.9 77.65 * 54.20 * 43.3 Spot Natural Gas ($/MMBtu, Henry Hub) July '10 4.82 3.72 29.6 4.66 * 3.92 * 18.9 UTILITIES AND PRODUCTION Houston Purchasing Managers Index July '10 52.4 43.8 19.6 55.7 * 43.1 * 29.2 Nonresidential Electric Current Sales (Mwh, CNP Service Area) July '10 4,663,282 4,682,892 -0.4 28,543,283 28,100,130 1.6 CONSTRUCTION Total Building Contracts ($, Houston MSA) July '10 693,601,000 909,986,000 -23.8 5,162,277,000 5,329,382,000 -3.1 Nonresidential July '10 236,703,000 351,361,000 -32.6 1,947,737,000 2,420,516,000 -19.5 Residential July '10 456,898,000 558,625,000 -18.2 3,214,540,000 2,908,866,000 10.5 Building Permits ($, City of Houston) July '10 264,381,291 391,776,848 -32.5 1,915,292,501 2,441,359,244 -21.5 Nonresidential July '10 200,339,600 291,032,204 -31.2 1,276,957,838 1,891,272,020 -32.5 New Nonresidential July '10 80,418,076 206,294,123 -61.0 429,393,202 779,950,337 -44.9 Nonresidential Additions/Alterations/Conversions July '10 119,921,524 84,738,081 41.5 847,564,636 1,111,321,683 -23.7 Residential July '10 64,041,691 100,744,644 -36.4 638,334,663 550,087,224 16.0 New Residential July '10 48,077,428 72,165,892 -33.4 488,185,903 402,091,142 21.4 Residential Additions/Alterations/Conversions July '10 15,964,263 28,578,752 -44.1 150,148,760 147,996,082 1.5 Multiple Listing Service (MLS) Activity Closings July '10 5,056 6,686 -24.4 37,158 35,796 3.8 Median Sales Price - SF Detached July '10 160,880 162,000 -0.7 153,516 * 149,307 * 2.8 Active Listings July '10 55,247 46,598 18.6 50,019 * 45,404 * 10.2 EMPLOYMENT (Houston-Sugar Land-Baytown MSA) Nonfarm Payroll Employment July '10 2,511,100 2,528,100 -0.7 2,511,800 * 2,579,000 * -2.6 Goods Producing (Natural Resources/Mining/Const/Mfg) July '10 478,500 477,100 0.3 477,500 * 522,200 * -8.6 Service Providing July '10 2,032,600 2,051,000 -0.9 2,034,300 * 2,056,800 * -1.1 Unemployment Rate (%) - Not Seasonally Adjusted Houston-Sugar Land-Baytown MSA July '10 8.8 8.3 8.5 * 6.4 * Texas July '10 8.5 8.3 8.2 * 6.5 * U.S. July '10 9.7 9.7 9.8 * 7.9 * Unemployment Insurance Claims (Gulf Coast WDA) Initial Claims July '10 23,437 27,221 -13.9 22,590 * 27,016 * -16.4 Continuing Claims July '10 103,648 148,447 -30.2 108,766 * 129,603 * -16.1 TRANSPORTATION Port of Houston Authority Shipments (Short Tons) July '10 3,448,962 2,886,101 19.5 19,123,164 18,249,204 4.8 Air Passengers (Houston Airport System) July '10 4,738,759 4,723,973 0.3 28,881,175 28,386,331 1.7 Domestic Passengers July '10 3,848,421 3,906,014 -1.5 23,847,415 23,753,489 0.4 International Passengers July '10 890,338 817,959 8.8 5,033,760 4,632,842 8.7 Landings and Takeoffs July '10 74,044 79,986 -7.4 496,032 518,460 -4.3 Air Freight (000 lb) July '10 76,734 65,753 16.7 507,805 431,698 17.6 Enplaned July '10 40,412 35,105 15.1 266,859 231,527 15.3 Deplaned July '10 36,322 30,648 18.5 240,946 200,171 20.4 CONSUMERS New Car and Truck Sales (Units, Houston MSA) July '10 17,810 17,226 3.4 139,819 120,741 15.8 Cars July '10 7,826 7,750 1.0 63,639 54,663 16.4 Trucks, SUVs and Commercials July '10 9,984 9,476 5.4 76,180 66,078 15.3 Total Retail Sales ($000,000, Houston MSA, NAICS Basis) 3Q09 18,738 20,136 -6.9 53,679 59,150 -9.3 Consumer Price Index for All Urban Consumers ('82-'84=100) Houston-Galveston-Brazoria CMSA July '10 194.734 192.325 1.3 192.468 * 190.017 * 1.3 United States July '10 218.011 215.351 1.2 217.603 * 213.455 * 1.9 Hotel Performance (Harris County) Occupancy (%) 1Q10 56.8 62.8 56.8 * 62.8 * Average Room Rate ($) 1Q10 93.91 102.21 -8.1 93.91 * 102.21 * -8.1 Revenue Per Available Room ($) 1Q10 53.31 64.18 -16.9 53.31 * 64.18 * -16.9 POSTINGS AND FORECLOSURES Postings (Harris County) Aug '10 3,372 3,337 1.0 30,346 25,662 18.3 Foreclosures (Harris County) Aug '10 1,059 824 28.5 8,898 7,134 24.7 September 2010 ©2010, Greater Houston Partnership Page 6
  • 7. HOUSTON—THE ECONOMY AT A GLANCE Sources Rig Count Baker Hughes Incorporated Port Shipments Port of Houston Authority Spot WTI, Spot Natural Gas U.S. Energy Information Agency Aviation Aviation Department, City of Houston Purchasing Managers National Association of Houston Index Purchasing Management – Car and Truck Sales TexAuto Facts Report, InfoNation, Houston, Inc. Inc., Sugar Land TX Electricity CenterPoint Energy Retail Sales Texas Comptroller’s Office Building Construction Contracts McGraw-Hill Construction Consumer Price Index U.S. Bureau of Labor Statistics City of Houston Building Permits Building Permit Department, City Hotels PKF Consulting/Hospitality Asset of Houston Advisors International MLS Data Houston Association of Realtors® Postings, Foreclosures Foreclosure Information & Listing Employment, Unemployment Texas Workforce Commission Service STAY UP TO DATE! If you would like to receive this electronic publication on the first working day of each month, please e- mail your request for Economy at a Glance to rpate@houston.org. Include your name, title and phone number and your company’s name and address. Archived copies are available to Partnership Members in the Members Only section at www.houston.org. For information about joining the Greater Houston Partnership and gaining access to this powerful resource, call Member Services at 713-844-3683. The foregoing table is updated whenever any data change — typically, 11 or so times per month. If you would like to receive those updates by e-mail, usually accompanied by commentary, please e-mail your request for Key Economic Indicators to rpate@houston.org with the same identifying information. You may request Glance and Indicators in the same e-mail. September 2010 ©2010, Greater Houston Partnership Page 7
  • 8. HOUSTON—THE ECONOMY AT A GLANCE HOUSTON MSA NONFARM PAYROLL EMPLOYMENT (000) Change from % Change from July ' 10 Jun ' 10 July '09 Jun '10 July '09 Jun '10 July '09 Total Nonfarm Payroll Jobs 2,511.1 2,528.1 2,520.8 -17.0 -9.7 -0.7 -0.4 Total Private 2,150.2 2,150.6 2,167.4 -0.4 -17.2 0.0 -0.8 Goods Producing 478.5 477.1 492.0 1.4 -13.5 0.3 -2.7 Service Providing 2,032.6 2,051.0 2,028.8 -18.4 3.8 -0.9 0.2 Private Service Providing 1,671.7 1,673.5 1,675.4 -1.8 -3.7 -0.1 -0.2 Mining and Logging 90.0 89.2 87.7 0.8 2.3 0.9 2.6 Oil & Gas Extraction 51.1 50.9 49.2 0.2 1.9 0.4 3.9 Support Activities for Mining 37.7 37.2 37.5 0.5 0.2 1.3 0.5 Construction 167.5 167.8 182.2 -0.3 -14.7 -0.2 -8.1 Manufacturing 221.0 220.1 222.1 0.9 -1.1 0.4 -0.5 Durable Goods Manufacturing 141.3 140.7 141.2 0.6 0.1 0.4 0.1 Nondurable Goods Manufacturing 79.7 79.4 80.9 0.3 -1.2 0.4 -1.5 Wholesale Trade 127.9 128.0 130.5 -0.1 -2.6 -0.1 -2.0 Retail Trade 260.6 260.5 261.6 0.1 -1.0 0.0 -0.4 Transportation, Warehousing and Utilities 120.3 119.9 122.6 0.4 -2.3 0.3 -1.9 Utilities 16.6 16.6 16.7 0.0 -0.1 0.0 -0.6 Air Transportation 23.9 23.9 24.6 0.0 -0.7 0.0 -2.8 Truck Transportation 18.6 18.6 18.7 0.0 -0.1 0.0 -0.5 Pipeline Transportation 9.0 8.9 8.8 0.1 0.2 1.1 2.3 Balance, incl Warehousing, Water & Rail Transport 52.2 51.9 53.8 0.3 -1.6 0.6 -3.0 Information 32.6 32.8 34.5 -0.2 -1.9 -0.6 -5.5 Telecommunications 17.3 17.5 17.9 -0.2 -0.6 -1.1 -3.4 Finance & Insurance 86.4 86.4 88.5 0.0 -2.1 0.0 -2.4 Real Estate & Rental and Leasing 51.1 51.3 51.1 -0.2 0.0 -0.4 0.0 Professional & Business Services 352.2 352.0 356.7 0.2 -4.5 0.1 -1.3 Professional, Scientific & Technical Services 169.9 169.5 173.8 0.4 -3.9 0.2 -2.2 Legal Services 23.2 23.2 23.5 0.0 -0.3 0.0 -1.3 Accounting, Tax Preparation, Bookkeeping 15.6 15.6 16.7 0.0 -1.1 0.0 -6.6 Architectural, Engineering & Related Services 60.8 60.2 60.8 0.6 0.0 1.0 0.0 Computer Systems Design & Related Services 23.4 23.6 24.1 -0.2 -0.7 -0.8 -2.9 Admin & Support/Waste Mgt & Remediation 161.9 162.3 163.7 -0.4 -1.8 -0.2 -1.1 Administrative & Support Services 154.3 154.6 155.3 -0.3 -1.0 -0.2 -0.6 Employment Services 51.2 51.3 52.8 -0.1 -1.6 -0.2 -3.0 Educational Services 41.4 42.4 40.7 -1.0 0.7 -2.4 1.7 Health Care & Social Assistance 264.9 264.2 256.0 0.7 8.9 0.3 3.5 Arts, Entertainment & Recreation 31.0 31.3 31.0 -0.3 0.0 -1.0 0.0 Accommodation & Food Services 210.0 210.9 208.8 -0.9 1.2 -0.4 0.6 Other Services 93.3 93.8 93.4 -0.5 -0.1 -0.5 -0.1 Government 360.9 377.5 353.4 -16.6 7.5 -4.4 2.1 Federal Government 32.0 35.5 29.2 -3.5 2.8 -9.9 9.6 State Government 69.2 69.3 68.6 -0.1 0.6 -0.1 0.9 State Government Educational Services 36.1 36.1 35.1 0.0 1.0 0.0 2.8 Local Government 259.7 272.7 255.6 -13.0 4.1 -4.8 1.6 Local Government Educational Services 171.6 184.6 169.3 -13.0 2.3 -7.0 1.4 SOURCE: Texas Workforce Commission September 2010 ©2010, Greater Houston Partnership Page 8
  • 9. HOUSTON—THE ECONOMY AT A GLANCE Population and Employment Houston-Sugar Land-Baytown MSA 2005-2035 10 9 8 7 6 000,000 5 4 3 2 1 0 '05 '10 '15 '20 '25 '30 '35 Population Pop Forecast Employment Empl Forecast Source: The Perryman Group, Spring/Summer 2010 HOUSTON MSA EMPLOYMENT 2001-2011 2.65 160 2.60 140 2.55 120 NONFARM PAYROLL EMPLOYMENT (000,000) 2.50 100 2.45 80 12-MONTH CHANGE (000) 2.40 60 2.35 40 2.30 20 2.25 0 2.20 -20 2.15 -40 2.10 -60 2.05 -80 2.00 -100 1.95 -120 Jan-01 Jan-02 Jan-03 Jan-04 Jan-05 Jan-06 Jan-07 Jan-08 Jan-09 Jan-10 Jan-11 12-MONTH CHANGE JOBS Source: Texas Workforce Commission September 2010 ©2010, Greater Houston Partnership Page 9
  • 10. HOUSTON—THE ECONOMY AT A GLANCE GOODS-PRODUCING AND SERVICE-PROVIDING EMPLOYMENT HOUSTON MSA 2001-2011 550 2.25 540 2.20 530 2.15 2.10 520 SERVICE-PROVIDING (000,000) 2.05 GOODS-PRODUCING (000) 510 2.00 500 1.95 490 1.90 480 1.85 470 1.80 460 1.75 450 1.70 440 1.65 430 1.60 Jan-01 Jan-02 Jan-03 Jan-04 Jan-05 Jan-06 Jan-07 Jan-08 Jan-09 Jan-10 Jan-11 GOODS-PRODUCING JOBS SERVICE-PROVIDING JOBS Source: Texas Workforce Commission UNEMPLOYMENT RATE HOUSTON & U.S. 2001-2011 11 10 9 8 PERCENT OF LABOR FORCE 7 6 5 4 3 2 1 0 Jan-01 Jan-02 Jan-03 Jan-04 Jan-05 Jan-06 Jan-07 Jan-08 Jan-09 Jan-09 Jan-11 HOUSTON U.S. Source: Texas Workforce Commission September 2010 ©2010, Greater Houston Partnership Page 10
  • 11. HOUSTON—THE ECONOMY AT A GLANCE SPOT MARKET ENERGY PRICES 2001 - 2011 140 28 120 24 HENRY HUB NATURAL GAS ($/MMBTU) WEST TEXAS INTERMEDIATE ($/BBL) 100 20 80 16 60 12 40 8 20 4 0 0 Jan-01 Jan-02 Jan-03 Jan-04 Jan-05 Jan-06 Jan-07 Jan-08 Jan-09 Jan-10 Jan-11 WTI MONTHLY WTI 12-MO AVG GAS MONTHLY GAS 12-MO AVG Source: U.S. Energy Information Administration INFLATION: 12-MONTH CHANGE 2001-2011 6% 5% 4% 3% 2% 1% 0% -1% -2% -3% Jan-01 Jan-02 Jan-03 Jan-04 Jan-05 Jan-06 Jan-07 Jan-08 Jan-09 Jan-10 Jan-11 HOUSTON CPI-U U.S. CPI-U Source: U.S. Bureau of Labor Statistics September 2010 ©2010, Greater Houston Partnership Page 11