1. SimplyMap is a web-based mapping application that changes the way you use and interact with complex
data. SimplyMap enables non-technical and advanced users to quickly create professional thematic maps and
reports using powerful demographic, business, and marketing data. This guide will help you get started.
SimplyMap Quick Reference
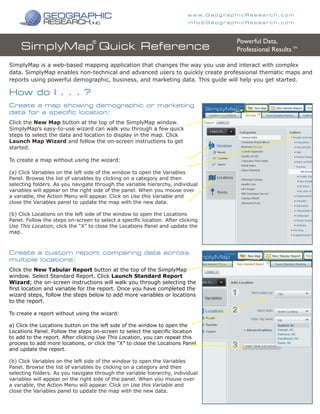
Click the New Map button at the top of the SimplyMap window.
SimplyMap’s easy-to-use wizard can walk you through a few quick
steps to select the data and location to display in the map. Click
Launch Map Wizard and follow the on-screen instructions to get
started.
To create a map without using the wizard:
(a) Click Variables on the left side of the window to open the Variables
Panel. Browse the list of variables by clicking on a category and then
selecting folders. As you navigate through the variable hierarchy, individual
variables will appear on the right side of the panel. When you mouse over
a variable, the Action Menu will appear. Click on Use this Variable and
close the Variables panel to update the map with the new data.
(b) Click Locations on the left side of the window to open the Locations
Panel. Follow the steps on-screen to select a specific location. After clicking
Use This Location, click the “X” to close the Locations Panel and update the
map.
Create a map showing demographic or marketing
data for a specific location:
Powerful Data,
Professional Results TM
®
How do I . . . ?
Click the New Tabular Report button at the top of the SimplyMap
window. Select Standard Report. Click Launch Standard Report
Wizard; the on-screen instructions will walk you through selecting the
first location and variable for the report. Once you have completed the
wizard steps, follow the steps below to add more variables or locations
to the report.
To create a report without using the wizard:
a) Click the Locations button on the left side of the window to open the
Locations Panel. Follow the steps on-screen to select the specific location
to add to the report. After clicking Use This Location, you can repeat this
process to add more locations, or click the “X” to close the Locations Panel
and update the report.
(b) Click Variables on the left side of the window to open the Variables
Panel. Browse the list of variables by clicking on a category and then
selecting folders. As you navigate through the variable hierarchy, individual
variables will appear on the right side of the panel. When you mouse over
a variable, the Action Menu will appear. Click on Use this Variable and
close the Variables panel to update the map with the new data.
Create a custom report comparing data across
multiple locations:
w w w. G e o g r a p h i c R e s e a r c h . c o m
i n f o @ G e o g r a p h i c R e s e a r c h . c o m
2. w w w . G e o g r a p h i c R e s e a r c h . c o m
a) Click on the map tab you would like to export. From the
large Action Menu near the top right corner of the window,
select Export Map As and either a GIF or PDF. This will open
a preview window where you can configure the exported map
image.
b) In the Preview window, you can drag and drop the legend
anywhere on the map. You can also add text to your map by
typing a title in the Text Area box and then clicking the “add
text area” link to add the text to your map.
c) You can select Email from the drop-down menu to send the
exported map image to any email address, or select File to
download the image directly to your computer.
Export a map to use in Powerpoint
or Word:
With SimplyMap, you can export large amounts of data for
a specific location using the Location Analysis Report. For
example, you can export data for all ZIP Codes in Chicago,
or for all Census Tracts in Maricopa County, Arizona. This
exported data can be used in a spreadsheet, database,
statistical analysis or desktop GIS program.
a) Click the New Tabular Report button at the top of the
SimplyMap window. Select Location Analysis Report. Click
Launch Location Analysis Wizard and follow the on-screen
instructions to select a location and variable for the report.
Use the menus at the top of the screen to edit the location or
the geographic unit (type of location) included in the report.
To create a location analysis report without using the wizard:
b) Select the location you are interested in, such as the city of
Chicago, and then add variables to the report. Once created
you can edit the report to show ZIP Codes, Census Tracts or
Block Groups in Chicago using the Analyze Data By dropdown
box.
c) Once you have the desired data in the report, select
Download Table from the large Actions Menu. Reports can be
downloaded in Excel, .CSV, or .DBF format.
Export ZIP Code, Tract or Block-Group
data for an entire city or county:
Printed on 100% recycled paper.