This is a quick start guide to Power BI. Stay tuned for my next Power BI guide which will include advanced techniques in using this extremely popular data program.
Call me @ 9892124323 Cheap Rate Call Girls in Vashi with Real Photo 100% Secure
Power BI - Getting Started Guide
1. Getting Started with Power BI
By Bruce Jenks
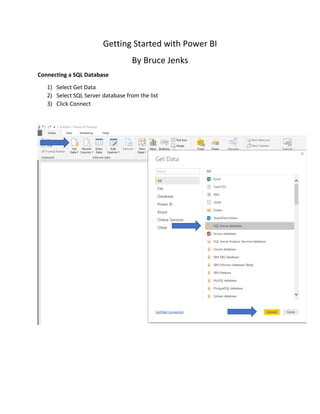
Connecting a SQL Database
1) Select Get Data
2) Select SQL Server database from the list
3) Click Connect
2. 1) Input Server Name
2) Input Database Name
3) Pick Import or DirectQuery
4) Click OK
1) Select the tables you want to use to build your report from the left.
2) Select Load
3. The following screen will appear.
1) Select Apply Changes.
2) Wait for the Apply query changes to complete.
Once the screen disappears select the Data tab on the left to see the raw data in the tables:
4. You can select through the different tables on the right:
Delete unneeded columns (Not Required) by right clicking on the name and then selecting
delete:
5. Click on the Relationships tab to see a graphical presentation of how the tables are connected:
Building a Report
Select the Report Tab on the Right:
6. Select a report type on the left. We will start with a simple table:
Select the Table:
7. Get Fields to Table:
1) Click on Field (Yellow) or drag the field to the table:
Choose options such as Sum and Average by:
1) Click on field name under Values:
2) Choose condition:
8. Choose Filtering options and Drill through options:
1) Drag data to ‘Drag data fields’ here under FILTERS:
2) Drag data to called out area below DRILLTHROUGH:
We have created a basic report:
9. Basic Report Modifications
Changing the field positions:
1) Move fields in different positions by clicking and dragging:
Changing This:
To This:
Will Give Us This:
Top to bottom under Values = Left to right on our report
10. Group by
If we remove WellID From the Values we can group by our well FieldName.
Click the x next WellID:
Now we are grouped by our well FieldName:
11. Sort by:
Click on the FieldName in our report:
Our FieldName is now sorted Z to A:
12. Switch Report Type
While current report is selected choose a different Visualization:
We now have a Pie Chart: