Contours on OS Maps
•Download as PPT, PDF•
3 likes•7,609 views

By the end of the lesson students should be able to: -explain how height is shown on maps -recognise slope types -some will identify landscape features from looking at contours

Recommended
More Related Content
What's hot
What's hot (20)
Similar to Contours on OS Maps
Similar to Contours on OS Maps (20)
More from Mr Dowdican
More from Mr Dowdican (15)
Recently uploaded
Recently uploaded (20)
Contours on OS Maps
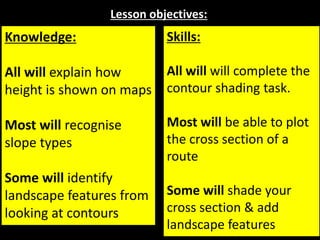
- 1. Lesson objectives: Knowledge: All will explain how height is shown on maps Most will recognise slope types Some will identify landscape features from looking at contours Skills: All will will complete the contour shading task. Most will be able to plot the cross section of a route Some will shade your cross section & add landscape features
- 2. Keywords for today's lesson: Contours Gradient Slope Elevation Topographic Intervals
- 3. They are these type of lines on a map What are contours? The lines connect areas of equal altitude on a map
- 4. Why do we use contours? True or False 1. Maps are Flat 2. Hills are not Flat Contours lines are the easiest way of showing changes in height of the landscape on a map
- 5. Why do we use contours? • They can be used to learn about the shape of the land (the relief). • A map with only a few contour lines will be flat (and often low lying) • If a map has lots of contours it is a mountainous or hilly area. Contours lines are the easiest way of showing changes in height of the landscape on a map
- 6. Remember that the closer together the contour lines the steeper the slope. Gentle slopes Steep slopes
- 7. X Y 200 250 225 225 200 200 250 275 300 275 250 225 225 So, how do they work?
- 8. 100 125 150 175 200 225 250 275 300 200 250 225 225 200 200 250 275 300 275 250 225 225 So, how do they work?
- 9. So, what do they look like on a map?
- 10. Convex slope Concave slope Steep slope Gentle slope Types of Slopes:
- 11. Where is the steepest slope on this island? 50 100 150 200
- 12. Steepest slope – contour lines are closest together Slieve Dowdican 227 .76 50 100 150 200 Sometimes spot heights can be shown as a dot with a note of the height of that place.
- 13. You can spot other features by the shape and pattern of the contours
- 14. A valley may look like this… Often with a river running down through the valley
- 15. However, a spur can look very similar ! But here the heights are increasing in the opposite direction – always double check which way the contours are increasing or decreasing.
- 16. Valley Spur
- 17. Valley Spur
- 18. Key words • Contour • Elevation • Topographic • Intervals A joined up line on a map showing the shape and height of the ground. The height gained or lost in Meters on a map. A type of map using large detail usually including contours. The difference in elevation of contour lines
- 19. Activity - Using the map, you are going to shade in areas of equal height (altitude) using the connecting contour lines - You will use a key to show the heights shown You need: -Your map -Colouring Pencils -Scrap Paper
- 21. What you need to do 1. Complete shading task on contour map 2. Plot a cross section between X and Y on the back of your sheet 3. Add the shading to your cross section 4. Mark on the two rivers
- 22. Have we met our lesson objectives? Knowledge: All will explain what are contours on a map Most will explain why contours are important Some will identify landscape features from looking at contours Skills: All will complete the contour shading task. Most will be able to plot the cross section of a route Some will shade your cross section & add landscape features