1. Basic tasks in Excel 2013
Touch
Guide
Excel is an incredibly powerful tool for getting meaning out of vast amounts of data. But it
also works really well for simple calculations and tracking almost any kind of information.
The key for unlocking all that potential is the grid of cells. Cells can contain numbers, text
or formulas. You put data in your cells and group them in rows and columns. That allows
you to add up your data, sort and filter it, put it in tables, and build great-looking charts.
Let’s go through the basic steps to get you started.
Tip For a training course to help you create your first workbook, see Create your first
Excel 2013 workbook. To learn about new features, see What's new in Excel 2013.
Create a new workbook
Excel documents are called workbooks. Each workbook has sheets, typically called
spreadsheets. You can add as many sheets as you want to a workbook, or you can create
new workbooks to keep your data separate.
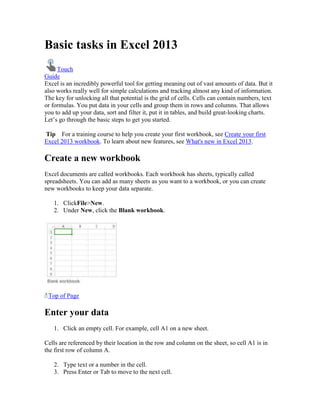
1. ClickFile>New.
2. Under New, click the Blank workbook.
Top of Page
Enter your data
1. Click an empty cell. For example, cell A1 on a new sheet.
Cells are referenced by their location in the row and column on the sheet, so cell A1 is in
the first row of column A.
2. Type text or a number in the cell.
3. Press Enter or Tab to move to the next cell.
2. Learn more about ways to enter data manually in worksheet cells.
Top of Page
Use AutoSum to add your data
When you’ve entered numbers in your sheet, you might want to add them up. A fast way to
do that is by using AutoSum.
1. Select the cell to the right or below the numbers you want to add.
2. Click Home>AutoSum, or press Alt+=.
AutoSum adds up the numbers and shows the result in the cell you selected.
Top of Page
Create a simple formula
Adding numbers is just one of the things you can do, but Excel can do other math too. Try
some simple formulas to add, subtract, multiply or divide your numbers.
1. Pick a cell and type an equal sign (=). That tells Excel that this cell will contain a
formula.
2. Type a combination of numbers and calculation operators, like the plus sign (+) for
addition, the minus sign (-) for subtraction, the asterisk (*) for multiplication, or the
forward slash (/) for division.
Forexample, enter=2+4, =4-2, =2*4, or=4/2.
3. Press Enter. That runs the calculation.
You can also press Ctrl+Enter if you want the cursor to stay on the active cell.
Learn more about creating a simple formula.
Top of Page
Apply a number format
3. To distinguish between different types of numbers, add a format, like currency,
percentages, or dates.
1. Select the cells that have numbers you want to format.
2. Click Home> Arrow next to General.
3. Pick a numberformat.
If you don’t see the number format you’re looking for, click More Number Formats.
Learn more about ways to format numbers.
4. Top of Page
Put your data in a table
A simple way to access a lot of Excel’s power is to put your data in a table. That lets you
quickly filter or sort your data for starters.
1. Select your data by clicking the first cell and dragging to the last cell in your data.
To use the keyboard, hold down Shift while you press the arrow keys to select your data.
2. Click the Quick Analysis button
in the bottom-right corner of the selection.
3. Click Tables, move your cursor to the Table button so you can see how your data
will look. Ifyoulikewhatyousee, clickthebutton.
4. Now you can play with your data: Filter to see only the data you want, or sort it to
go from, say, largest to smallest. Click the arrow in the table header of a column.
5. 5. To filter data, uncheck the Select All box to clear all check marks, and then check
the boxes of the data you want to show in your table.
6. To sort the data, click Sort A to Z or Sort Z to A.
6. Learn more about filtering data in an Excel table.
Top of Page
Show totals for your numbers
Quick Analysis tools let you total your numbers quickly. Whether it’s a sum, average, or
count you want, Excel shows the calculation results right below or next to your numbers.
1. Select the cells that contain numbers you want to add or count.
2. Click the Quick Analysis button
in the bottom-right corner of the selection.
3. Click Totals, move your cursor across the buttons to see the calculation results for
your data, and then click the button to apply the totals.
Top of Page
7. Add meaning to your data
Conditional formatting or sparklines can highlight your most important data or show data
trends. Use the Quick Analysis tool for a Live Preview to try it out.
1. Select the data you want to examine more closely.
2. Click the Quick Analysis button
that appears in the lower-right corner of your
selection.
3. Explore the options on the Formatting and Sparklines tabs to see how they affect
your data.
For example, pick a color scale in the Formatting gallery to differentiate high, medium,
and low temperatures.
4. When you like what you see, click that option.
Learn more about how to apply conditional formatting or analyze trends in data using
sparklines.
Top of Page
Show your data in a chart
The Quick Analysis tool recommends the right chart for your data and gives you a visual
presentation in just a few clicks.
1. Select the cells that contain the data you want to show in a chart.
2. Click the Quick Analysis button
that appears in the lower-right corner of your
selection.
3. Click Charts, move across the recommended charts to see which one looks best for
your data, and then click the one that you want.
8. Note Excel shows different charts in this gallery, depending on what’s recommended for
your data.
Learn about other ways to create a chart.
Top of Page
Save your work
1. Click the Save button on the Quick Access Toolbar, or press Ctrl+S.
If you’ve saved your work before, you’re done.
2. If this is the first time, go on to complete the next steps:
1. Under Save As, pick where to save your workbook, and then browse to a
folder.
2. In the File name box, enter a name for your workbook.
3. ClickSavetofinish.
Top of Page
Print
1. Click File>Print, or press Ctrl+P.
2. Preview the pages by clicking the Next Page and Previous Page arrows.
The preview window displays the pages in black and white or in color, depending on your
printer settings.
If you don’t like how your pages will be printed, you can change page margins or add page
breaks.
9. 3. ClickPrint.
Learn more about printing a worksheet or workbook.
Top of Page
Beyond the basics
Go beyond the basics with your workbooks by using a function to create a formula, using
slicers to filter data in an Excel table, or adding a trend or average line to a chart.
Appliesto:
Excel 2013