Africa’s Changing Farm Structure and the Employment Challenge by Thomas Jayne
•Download as PPTX, PDF•
1 like•1,092 views

1. The document analyzes trends in African agriculture, finding a rapid rise in medium-scale farms between 5-100 hectares that now control more land than small-scale and large-scale farms in some countries. 2. Medium-scale farmers have grown over 10 times faster than smallholders and constitute the main drivers of recent agricultural growth in Africa. 3. However, land inequality is rising as land concentrations increase, threatening the inclusiveness of agricultural development and employment growth on the continent.
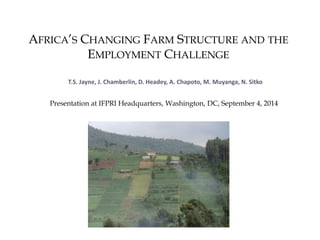
![Age pyramids, rural SSA, 2015
Male
Female
62% < 25 years old
[80+]
[75-79]
[70-74]
[65-69]
[60-64]
[55-59]
[50-54]
[45-49]
[40-44]
[35-39]
[30-34]
[25-29]
[20-24]
[15-19]
[10-14]
[5-9]
[0-4]
Rural
-10% -8% -6% -4% -2% 0% 2% 4% 6% 8% 10%
Source: UN Pop Council, 2013](data:image/gif;base64,R0lGODlhAQABAIAAAAAAAP///yH5BAEAAAAALAAAAAABAAEAAAIBRAA7)
Recommended
Recommended
More Related Content
What's hot
What's hot (19)
Viewers also liked
Viewers also liked (20)
Similar to Africa’s Changing Farm Structure and the Employment Challenge by Thomas Jayne
Similar to Africa’s Changing Farm Structure and the Employment Challenge by Thomas Jayne (20)
More from International Food Policy Research Institute (IFPRI)
More from International Food Policy Research Institute (IFPRI) (20)
Recently uploaded
Recently uploaded (20)
Africa’s Changing Farm Structure and the Employment Challenge by Thomas Jayne
- 1. AFRICA’S CHANGING FARM STRUCTURE AND THE EMPLOYMENT CHALLENGE T.S. Jayne, J. Chamberlin, D. Headey, A. Chapoto, M. Muyanga, N. Sitko Presentation at IFPRI Headquarters, Washington, DC, September 4, 2014 Photo: Christiaensen and Demery (2007)
- 2. Age pyramids, rural SSA, 2015 Male Female 62% < 25 years old [80+] [75-79] [70-74] [65-69] [60-64] [55-59] [50-54] [45-49] [40-44] [35-39] [30-34] [25-29] [20-24] [15-19] [10-14] [5-9] [0-4] Rural -10% -8% -6% -4% -2% 0% 2% 4% 6% 8% 10% Source: UN Pop Council, 2013
- 3. Conclusion 1 Africa’s arable land is highly concentrated, both between and within countries
- 4. Nine countries contain 90% of Africa’s unutilized arable land Non-forested unutilized land1 (million ha) Proportion Cumulative Proportion DRC 84.8 46.5% 46.5% Angola 18.9 10.4% 56.9% Congo 12.9 7.1% 63.9% Zambia 10.8 5.9% 69.9% Cameroon 10.5 5.7% 75.6% Mozambique 9.0 4.9% 80.5% CAR 7.1 3.9% 84.4% Gabon 6.5 3.6% 88.0% Sudan 5.8 3.2% 91.2% Rest of Africa (n=45) 8.8% 100.0%
- 5. Clustering of rural populations: Zambia
- 6. Clustering of rural populations: Kenya
- 7. Conclusion 2 Rapid rise of medium-scale farmers (5-100 ha)
- 8. Table 2: Changes in farm structure among small- and medium-scale farmers in Zambia (2009 - 2012) Landholding size Category Number of farms % change (2001-2012) % of total farmland Share of landholding 2001* 2009 2012 2009 2012 cultivated (2012) 0 – 2 ha 638,118 916,787 748,771 17.3% 24.1% 16.2% 91.2% 2 – 5 ha 159,039 366,628 418,544 163.2% 33.8% 31.7% 66.4% 5 – 10 ha 20,832 110,436 165,129 692.6% 20.3% 25.0% 49.5% 10 – 20 ha 2,352 35,898 53,454 2272.7% 12.3% 15.0% 36.7% 20 – 100 ha -- 9,030 13,839 53.3%** 9.5% 12.0% 10.9% Total 820,341 1,438,779 1,399,737 70.6% 100.0% 100.0% Source: Ministry of Agriculture Crop Forecast Surveys, 2009, 2012. *2001 figures are land under cultivation. ** Growth rate computed from 2009-2012 only. “na” means not available.
- 9. Table 2: Changes in farm structure among small- and medium-scale farmers in Zambia (2009 - 2012) Landholding size Category Number of farms % change (2001-2012) % of total farmland Share of landholding 2001* 2009 2012 2009 2012 cultivated (2012) 0 – 2 ha 638,118 916,787 748,771 17.3% 24.1% 16.2% 91.2% 2 – 5 ha 159,039 366,628 418,544 163.2% 33.8% 31.7% 66.4% 5 – 10 ha 20,832 110,436 165,129 692.6% 20.3% 25.0% 49.5% 10 – 20 ha 2,352 35,898 53,454 2272.7% 12.3% 15.0% 36.7% 20 – 100 ha -- 9,030 13,839 53.3%** 9.5% 12.0% 10.9% Total 820,341 1,438,779 1,399,737 70.6% 100.0% 100.0% Source: Ministry of Agriculture Crop Forecast Surveys, 2009, 2012. *2001 figures are land under cultivation. ** Growth rate computed from 2009-2012 only. “na” means not available.
- 10. Table 2: Changes in farm structure among small- and medium-scale farmers in Zambia (2009 - 2012) Landholding size Category Number of farms % change (2001-2012) % of total farmland Share of landholding 2001* 2009 2012 2009 2012 cultivated (2012) 0 – 2 ha 638,118 916,787 748,771 17.3% 24.1% 16.2% 91.2% 2 – 5 ha 159,039 366,628 418,544 163.2% 33.8% 31.7% 66.4% 5 – 10 ha 20,832 110,436 165,129 692.6% 20.3% 25.0% 49.5% 10 – 20 ha 2,352 35,898 53,454 2272.7% 12.3% 15.0% 36.7% 20 – 100 ha -- 9,030 13,839 53.3%** 9.5% 12.0% 10.9% Total 820,341 1,438,779 1,399,737 70.6% 100.0% 100.0% Source: Ministry of Agriculture Crop Forecast Surveys, 2009, 2012. *2001 figures are land under cultivation. ** Growth rate computed from 2009-2012 only. “na” means not available.
- 11. Crop sales by farm size, Zambia 12,000 10,000 8,000 6,000 4,000 2,000 - Mean sales (2011 Zmk ‘000s prices) Season 0-0.99 ha 1-1.99 ha 2-4.99 ha 5+ ha Linear (5+ ha) 11 Source: MACO CFS 2000/1 to 2010/11 and authors’ computations
- 12. Crop sales by farm size, Zambia 12,000 10,000 8,000 6,000 4,000 2,000 - Mean sales (2011 Zmk ‘000s prices) Season 0-0.99 ha 1-1.99 ha 2-4.99 ha 5+ ha Linear (5+ ha) 12 Source: MACO CFS 2000/1 to 2010/11 and authors’ computations Largest smallholder farms (9%) consistently doing better
- 13. Conclusion 3 Land controlled by MS farms exceeds that of LS (foreign + domestic combined)
- 14. More land cultivated/owned by MS than by large-scale, including LS foreign investors Large scale (foreign+domestic) Medium scale (5-100 ha) Million hectares Ghana (cultivated) 3.08 4.21 Kenya (cultivated) 0.69 0.84 Zambia (owned) 2.11 2.47
- 15. Characteristics of medium-scale farmers • In most countries: • Urban-based • Primary employment = salaried job • Relatively highly educated • Primarily men • In central / northern Ghana: • Most started out as small-scale farmers scaled-up • Acquired land from customary authorities • Relatively land-abundant environment
- 16. Conclusion 4 Medium-scale farmers control more land than small-scale farmers (0-5 ha) in Zambia and most likely in Ghana as well
- 17. Large scale Medium-scale (5-100 ha) Small-scale (0-5 ha) Total land controlled Million hectares Ghana (2005) 3.08 4.21 5.08 = 12.37 Kenya (2006) 0.69 0.84 2.63 = 4.16 Zambia (2012) 2.11 2.47 2.09 = 6.67
- 18. Large scale Medium-scale (5-100 ha) Small-scale (0-5 ha) Total land controlled PAC remaining (arable + grasslands) Million hectares Ghana 3.08 4.21 5.08 = 12.37 3.56 Kenya 0.69 0.84 2.63 = 4.16 1.01 Zambia 2.11 2.47 2.09 = 6.67 3.35
- 19. Conclusion 5 The amount of land available for cropland expansion (PAC) is between 20-35% of total stock of arable land
- 20. Conclusion 5: PAC is sizeable but small in relation to land already utilized in Kenya and Ghana PAC / already utilized + PAC Including forest land Excluding forest land Ghana (cultivated) 26.8% 22.4% Kenya (cultivated) 21.5% 19.5% Zambia (owned) 43.1% 33.4%
- 21. Conclusion 6 Rising concentration of landholdings
- 22. Gini coefficients of landholding Period Movement in Gini coefficient: Ghana (cult. area) 1992 2005 0.54 0.65 Kenya (cult. area) 1994 2006 0.51 0.55 Zambia (landholding) 2001 2012 0.42 0.49
- 23. Conclusions 1. Rate of growth of medium-scale farms (MS: 5-100 ha) 10 times faster than small-scale (SS: 0-5 ha) farms 2. Despite major focus on large-scale “land grabs”, more farm land is owned by MS farmers than by LS farms 3. Land controlled by MS farmers > that of SS farmers (0-5 ha) in at least 1 of the 3 countries examined (probably 2/3 by 2014) 4. Mean farm size rising in some countries even while holdings are gradually shrinking for most farm hhs 5. Rising Gini coefficients over time in landholdings 6. Potentially available cropland as % of total utilized + unutilized arable land: ranges from 43.1% (Zambia) to 21.5% (Kenya)
- 24. Policy questions 1. Africa is enjoying 5% annual ag growth rates – who is driving this growth? 2. Are ag/employment/poverty reduction strategies compatible with countries’ land policies? 3. Will the rate of non-farm job growth depend on how inclusive agricultural growth is (multipliers)? 4. Will a commitment to inclusive agricultural development require area expansion and a change in land allocation policies?
- 25. Stylized fact: A stylized fact is often a broad generalization that summarizes some complicated statistical relationship, which although essentially true, may have inaccuracies in the detail. http://en.wikipedia.org/wiki/Stylized_fact