Downloaded 1,724 times

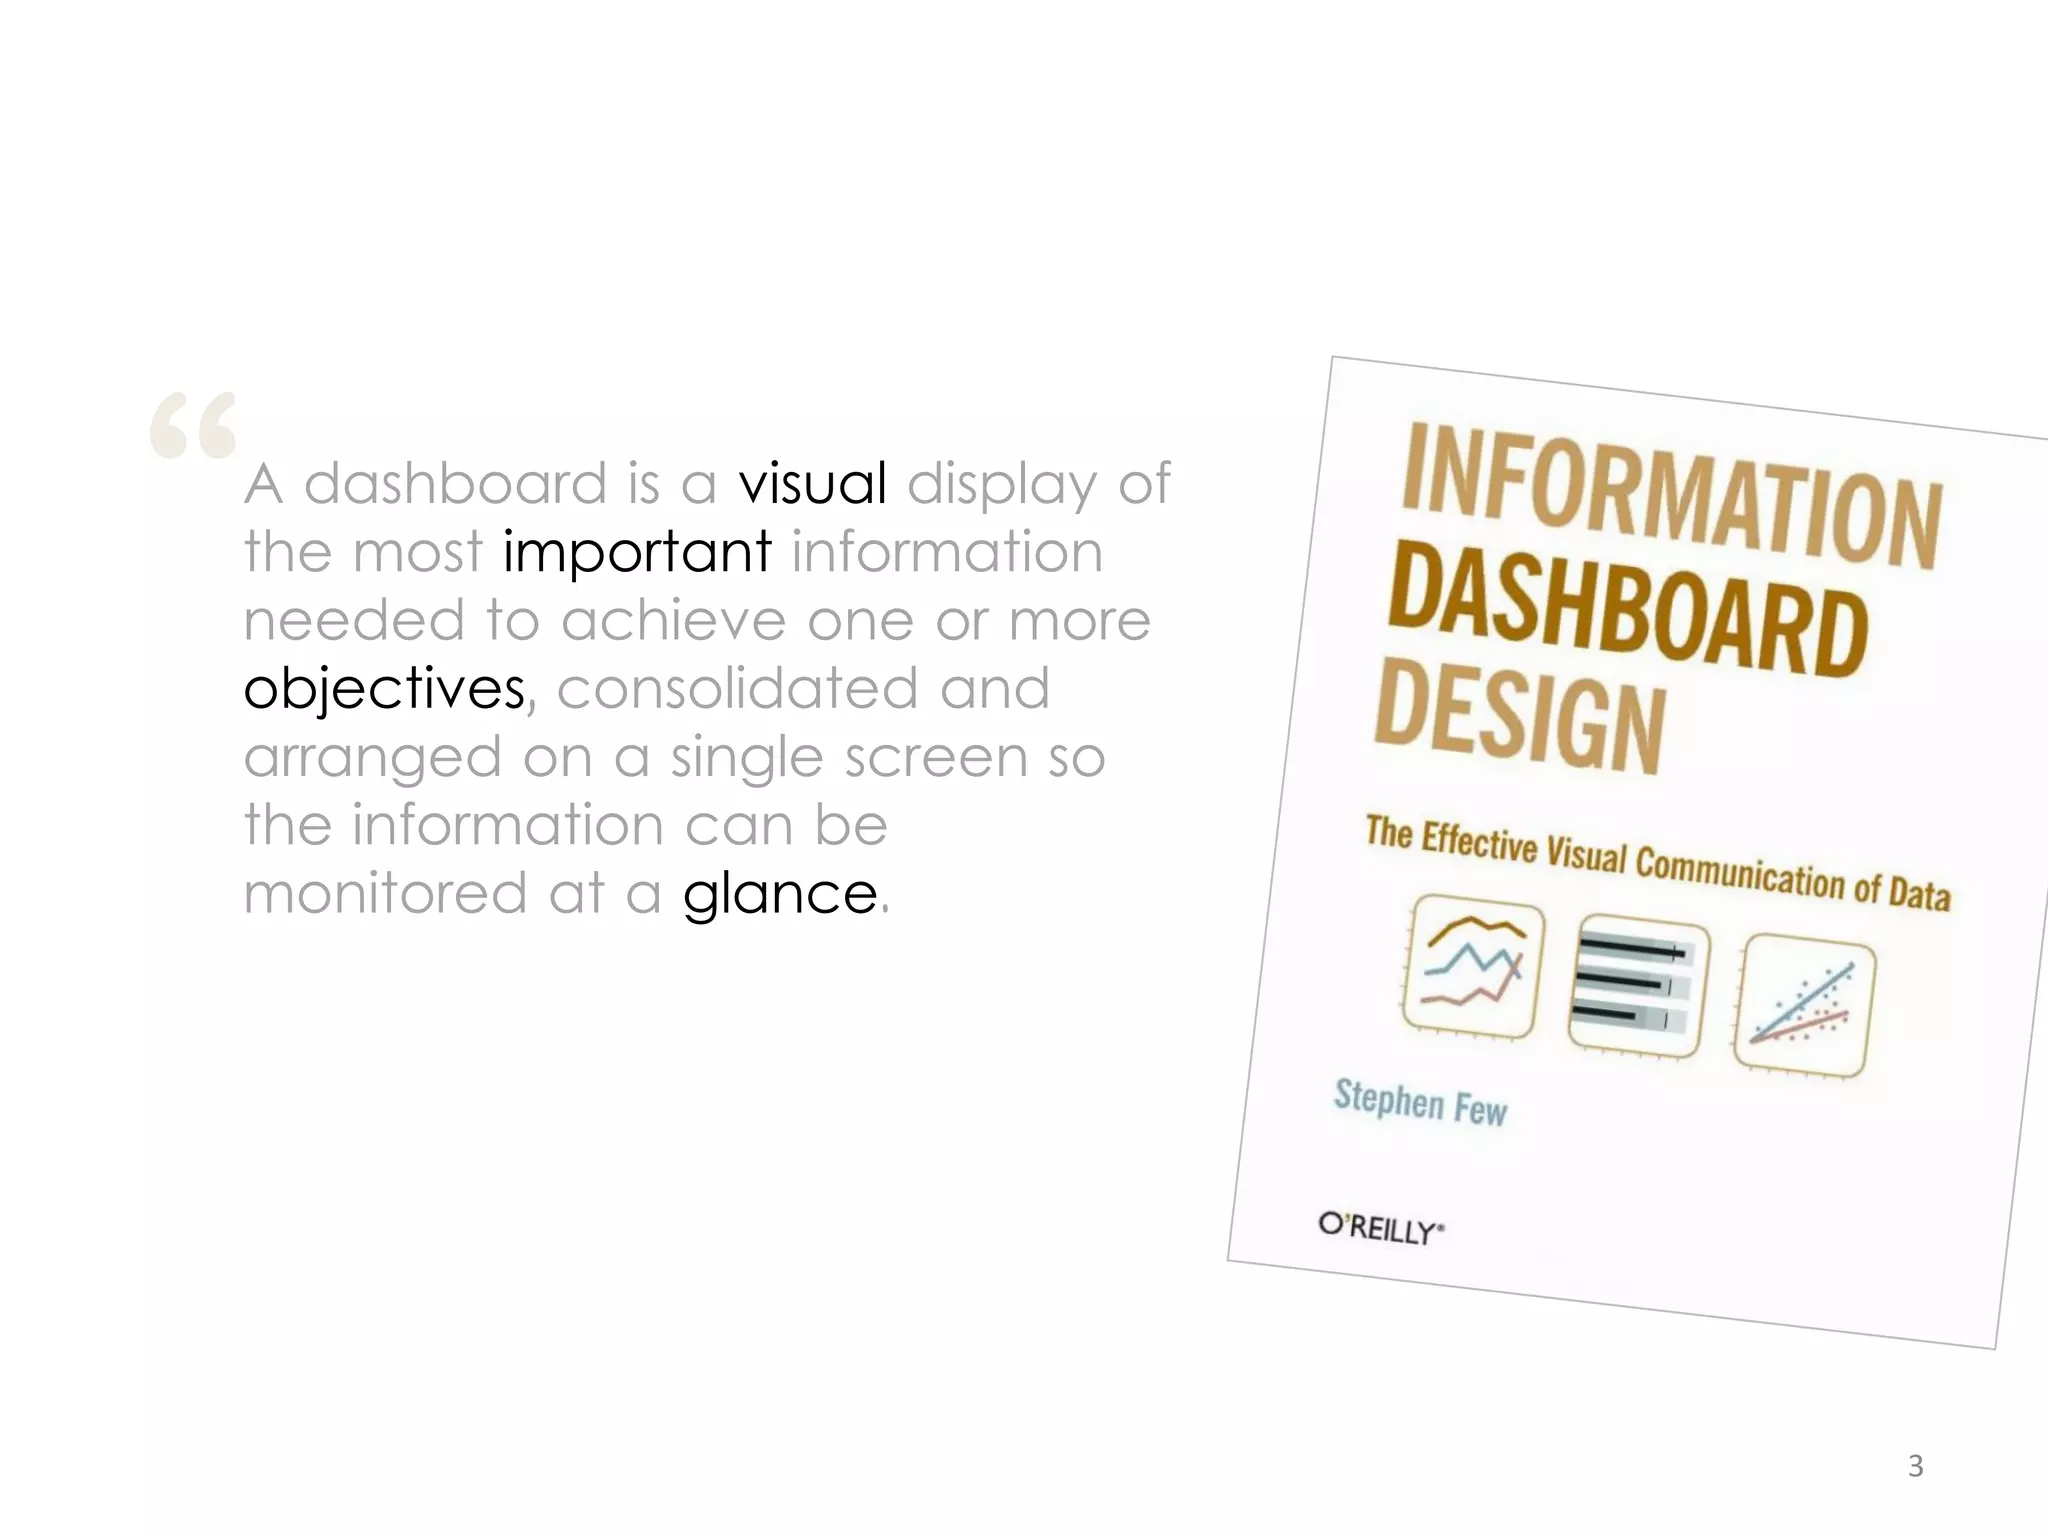


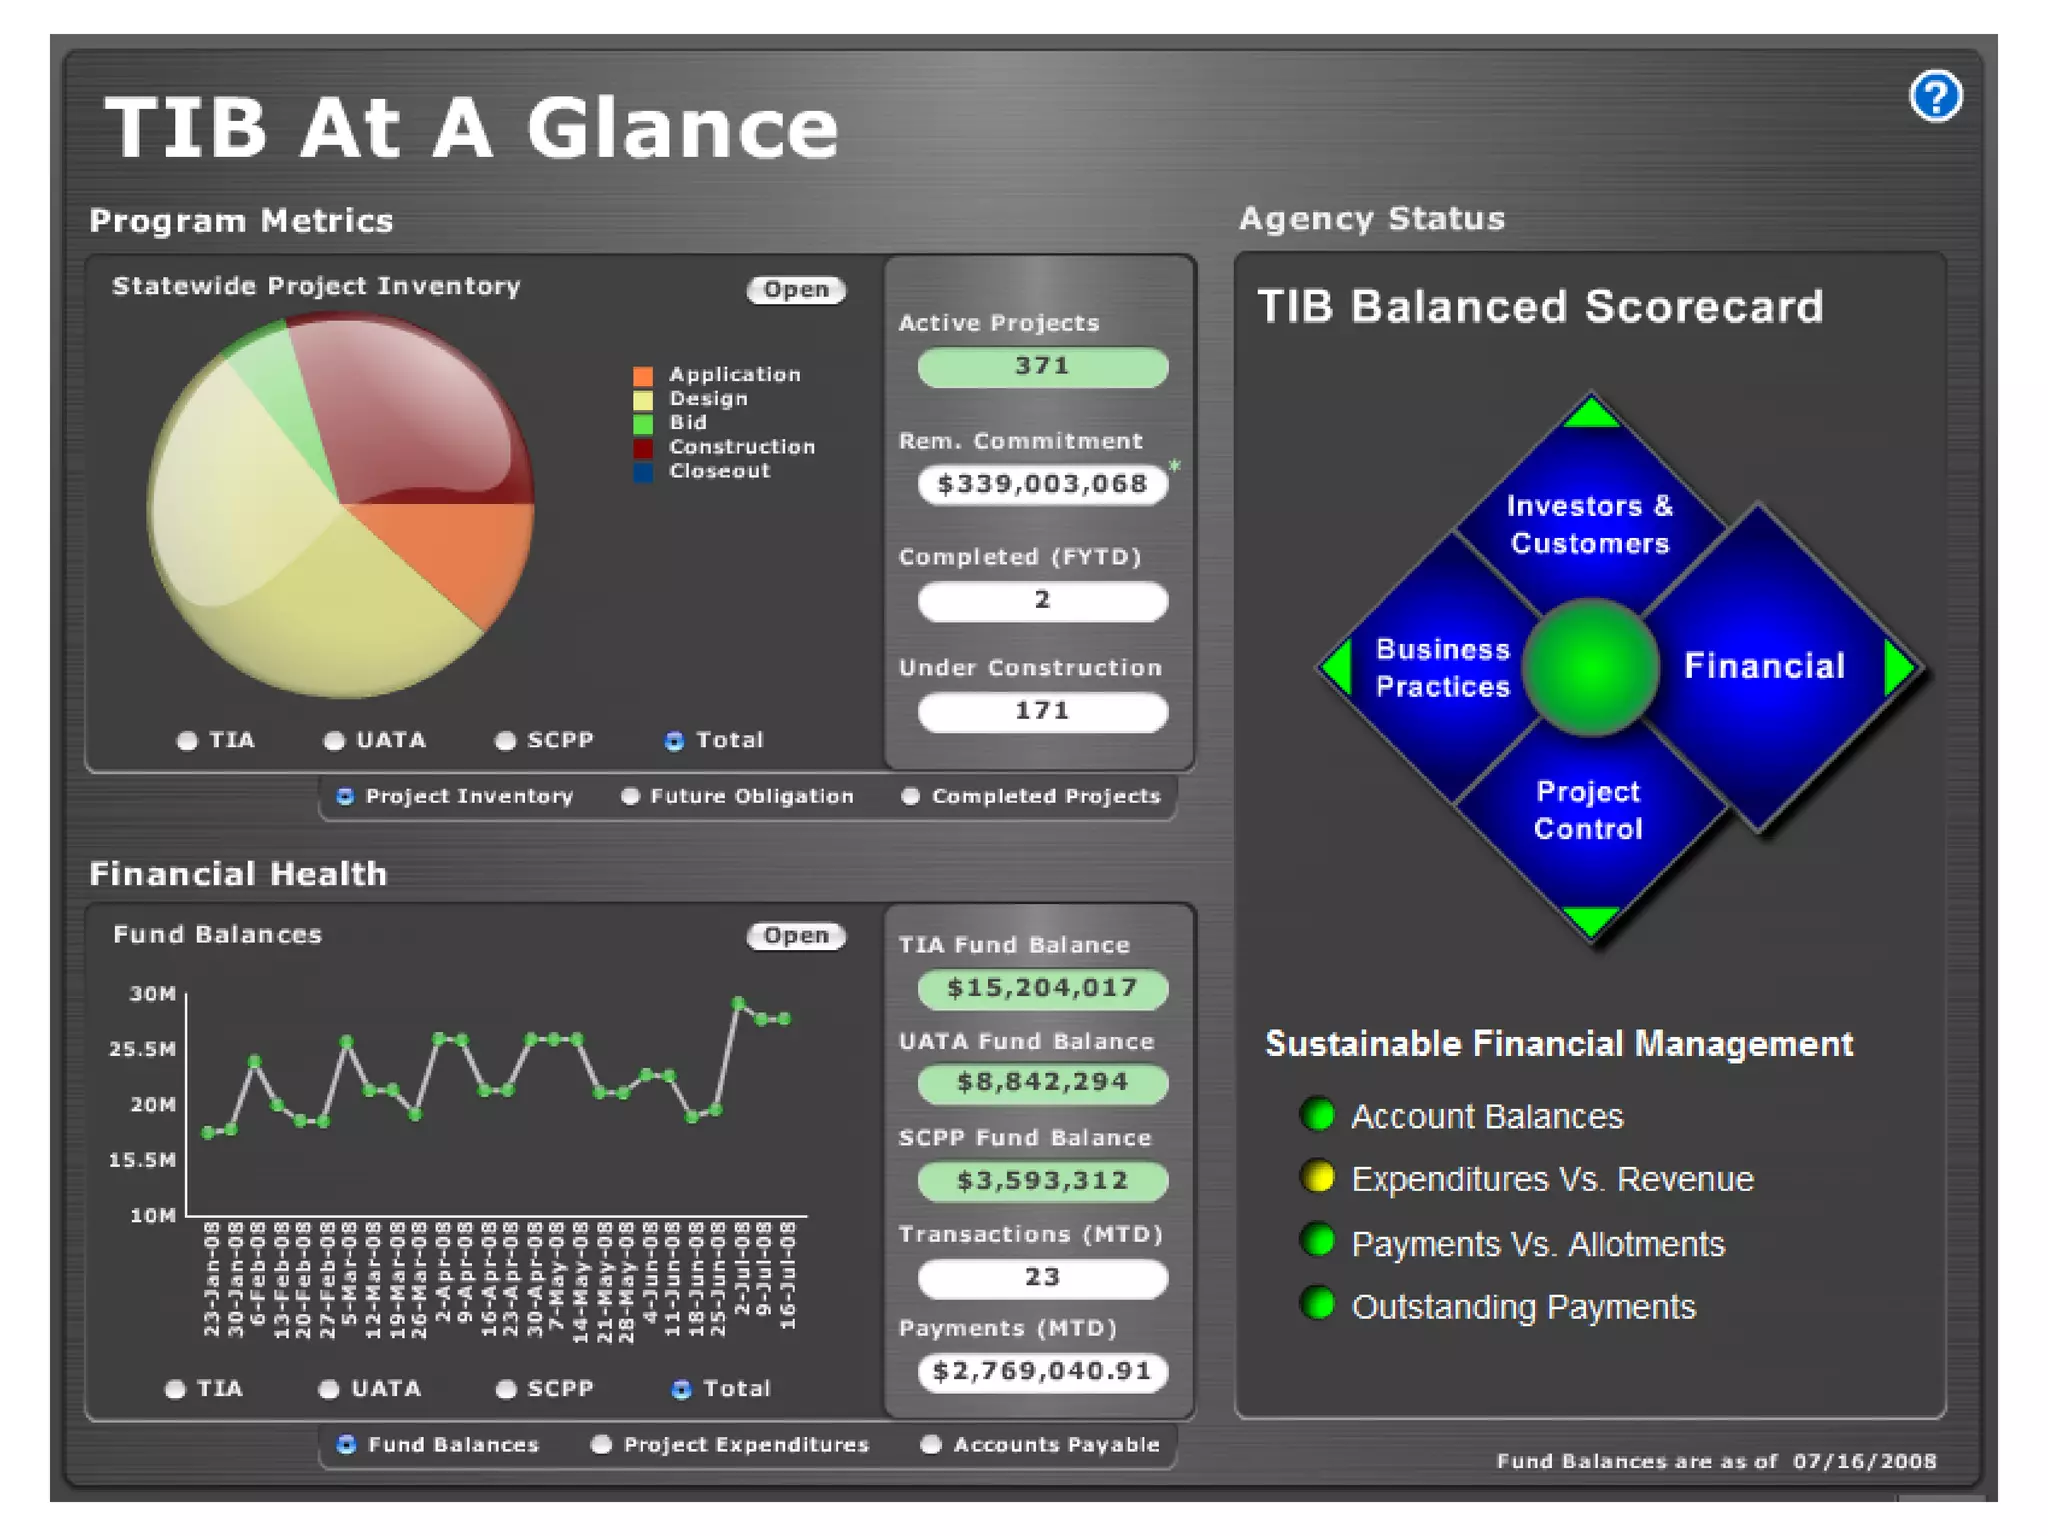


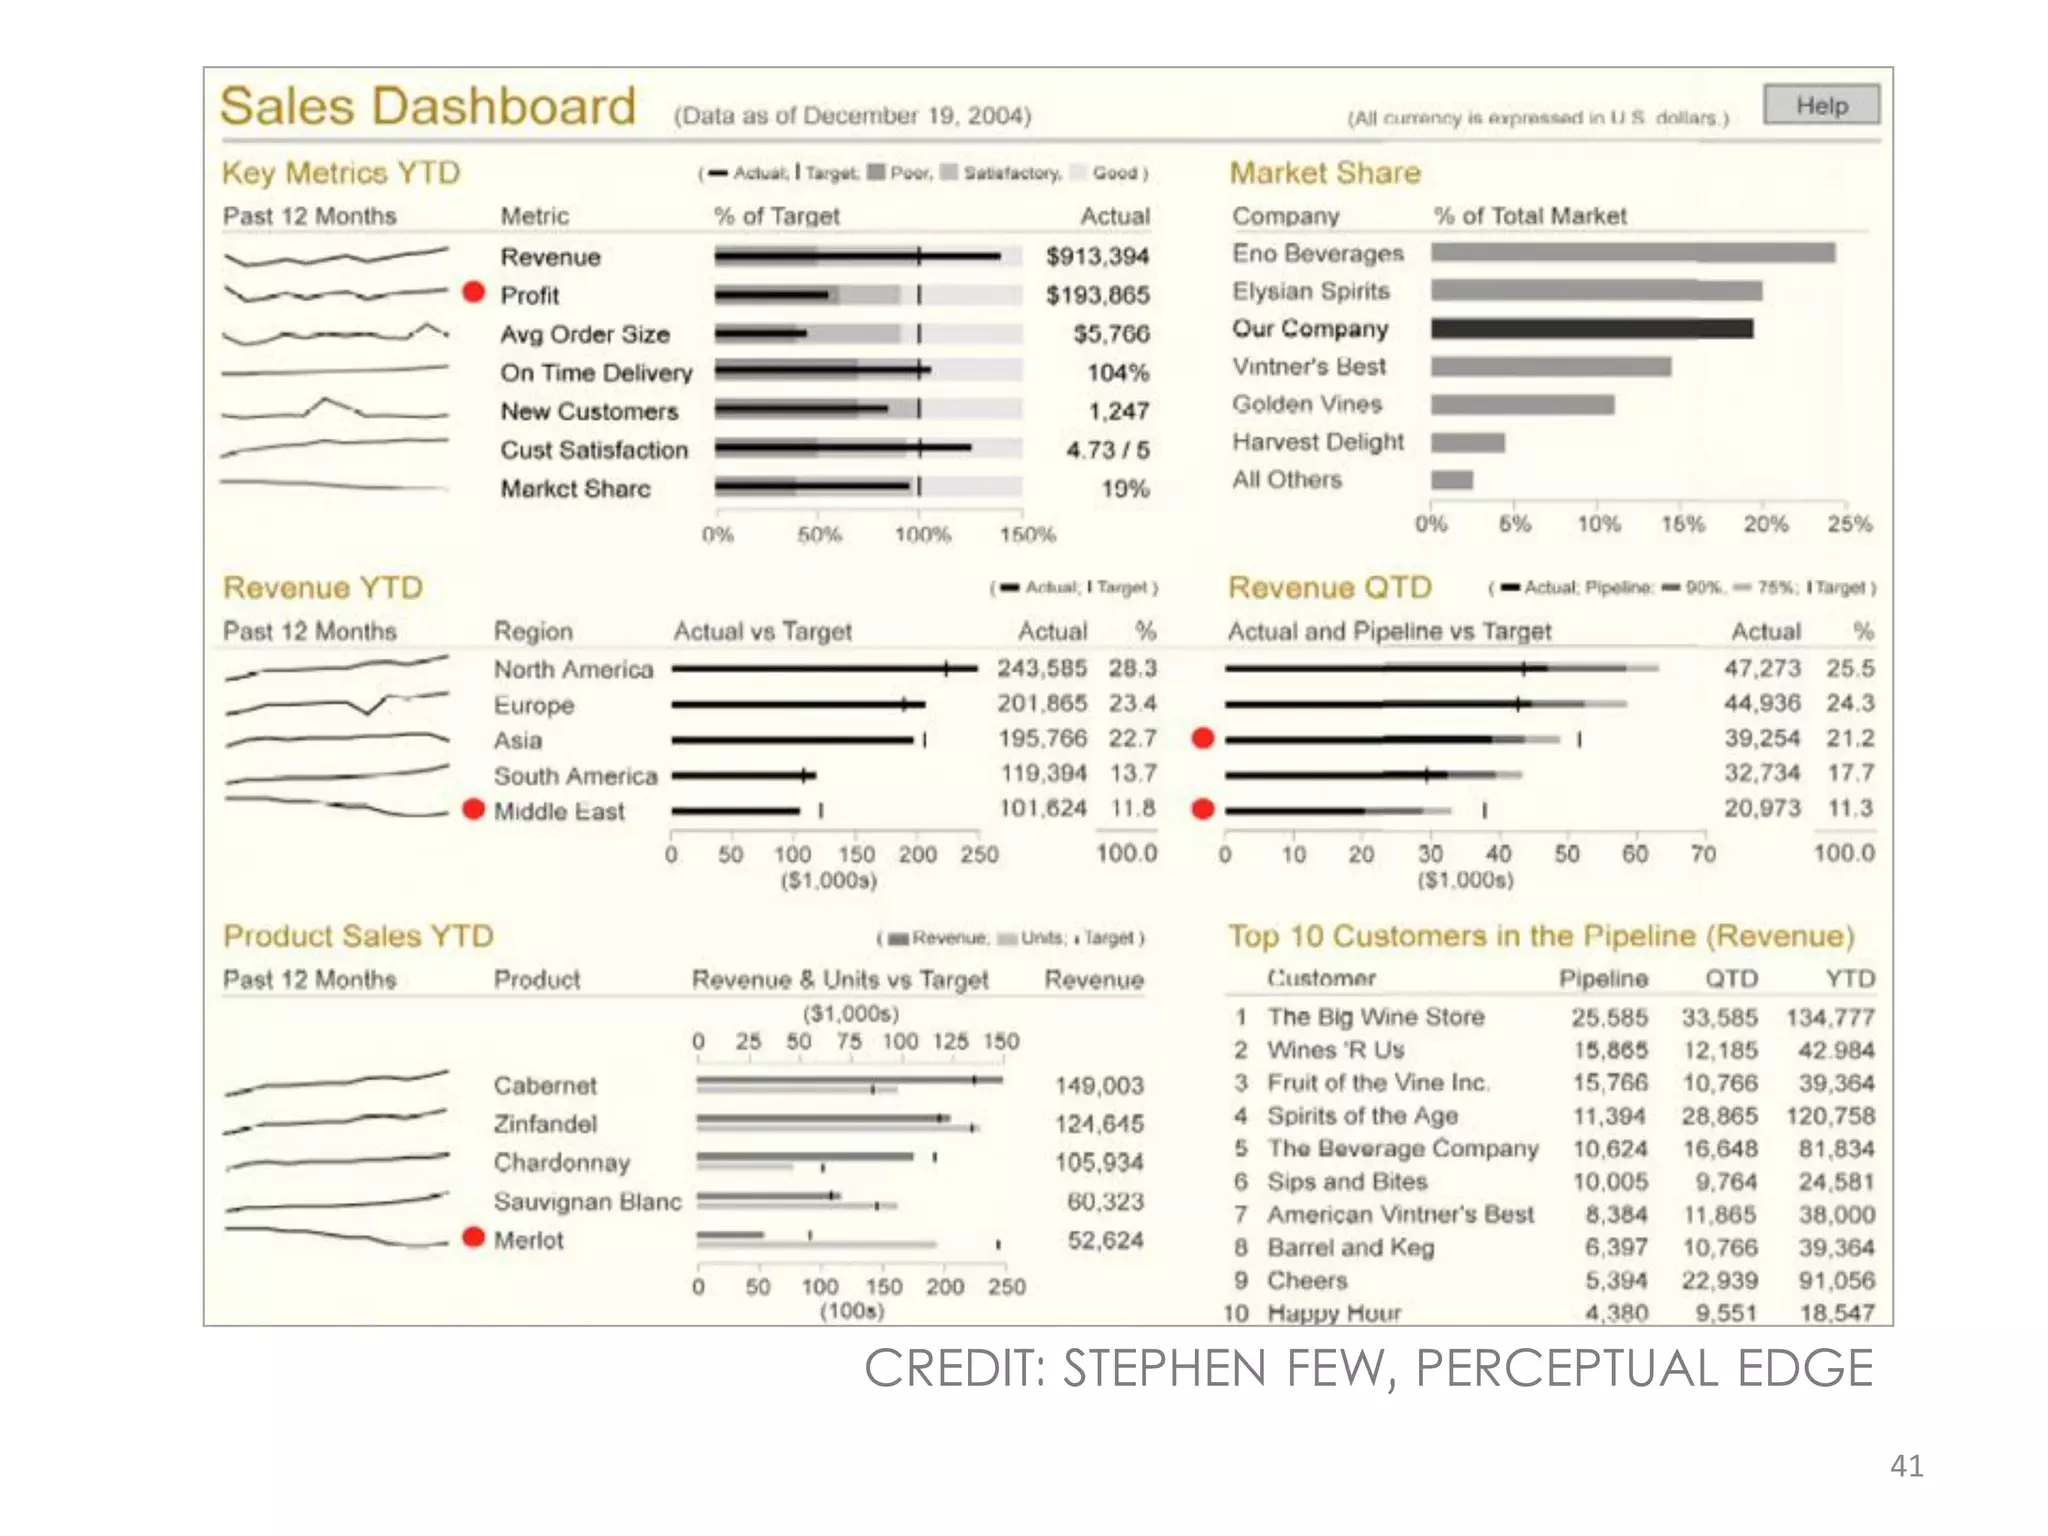
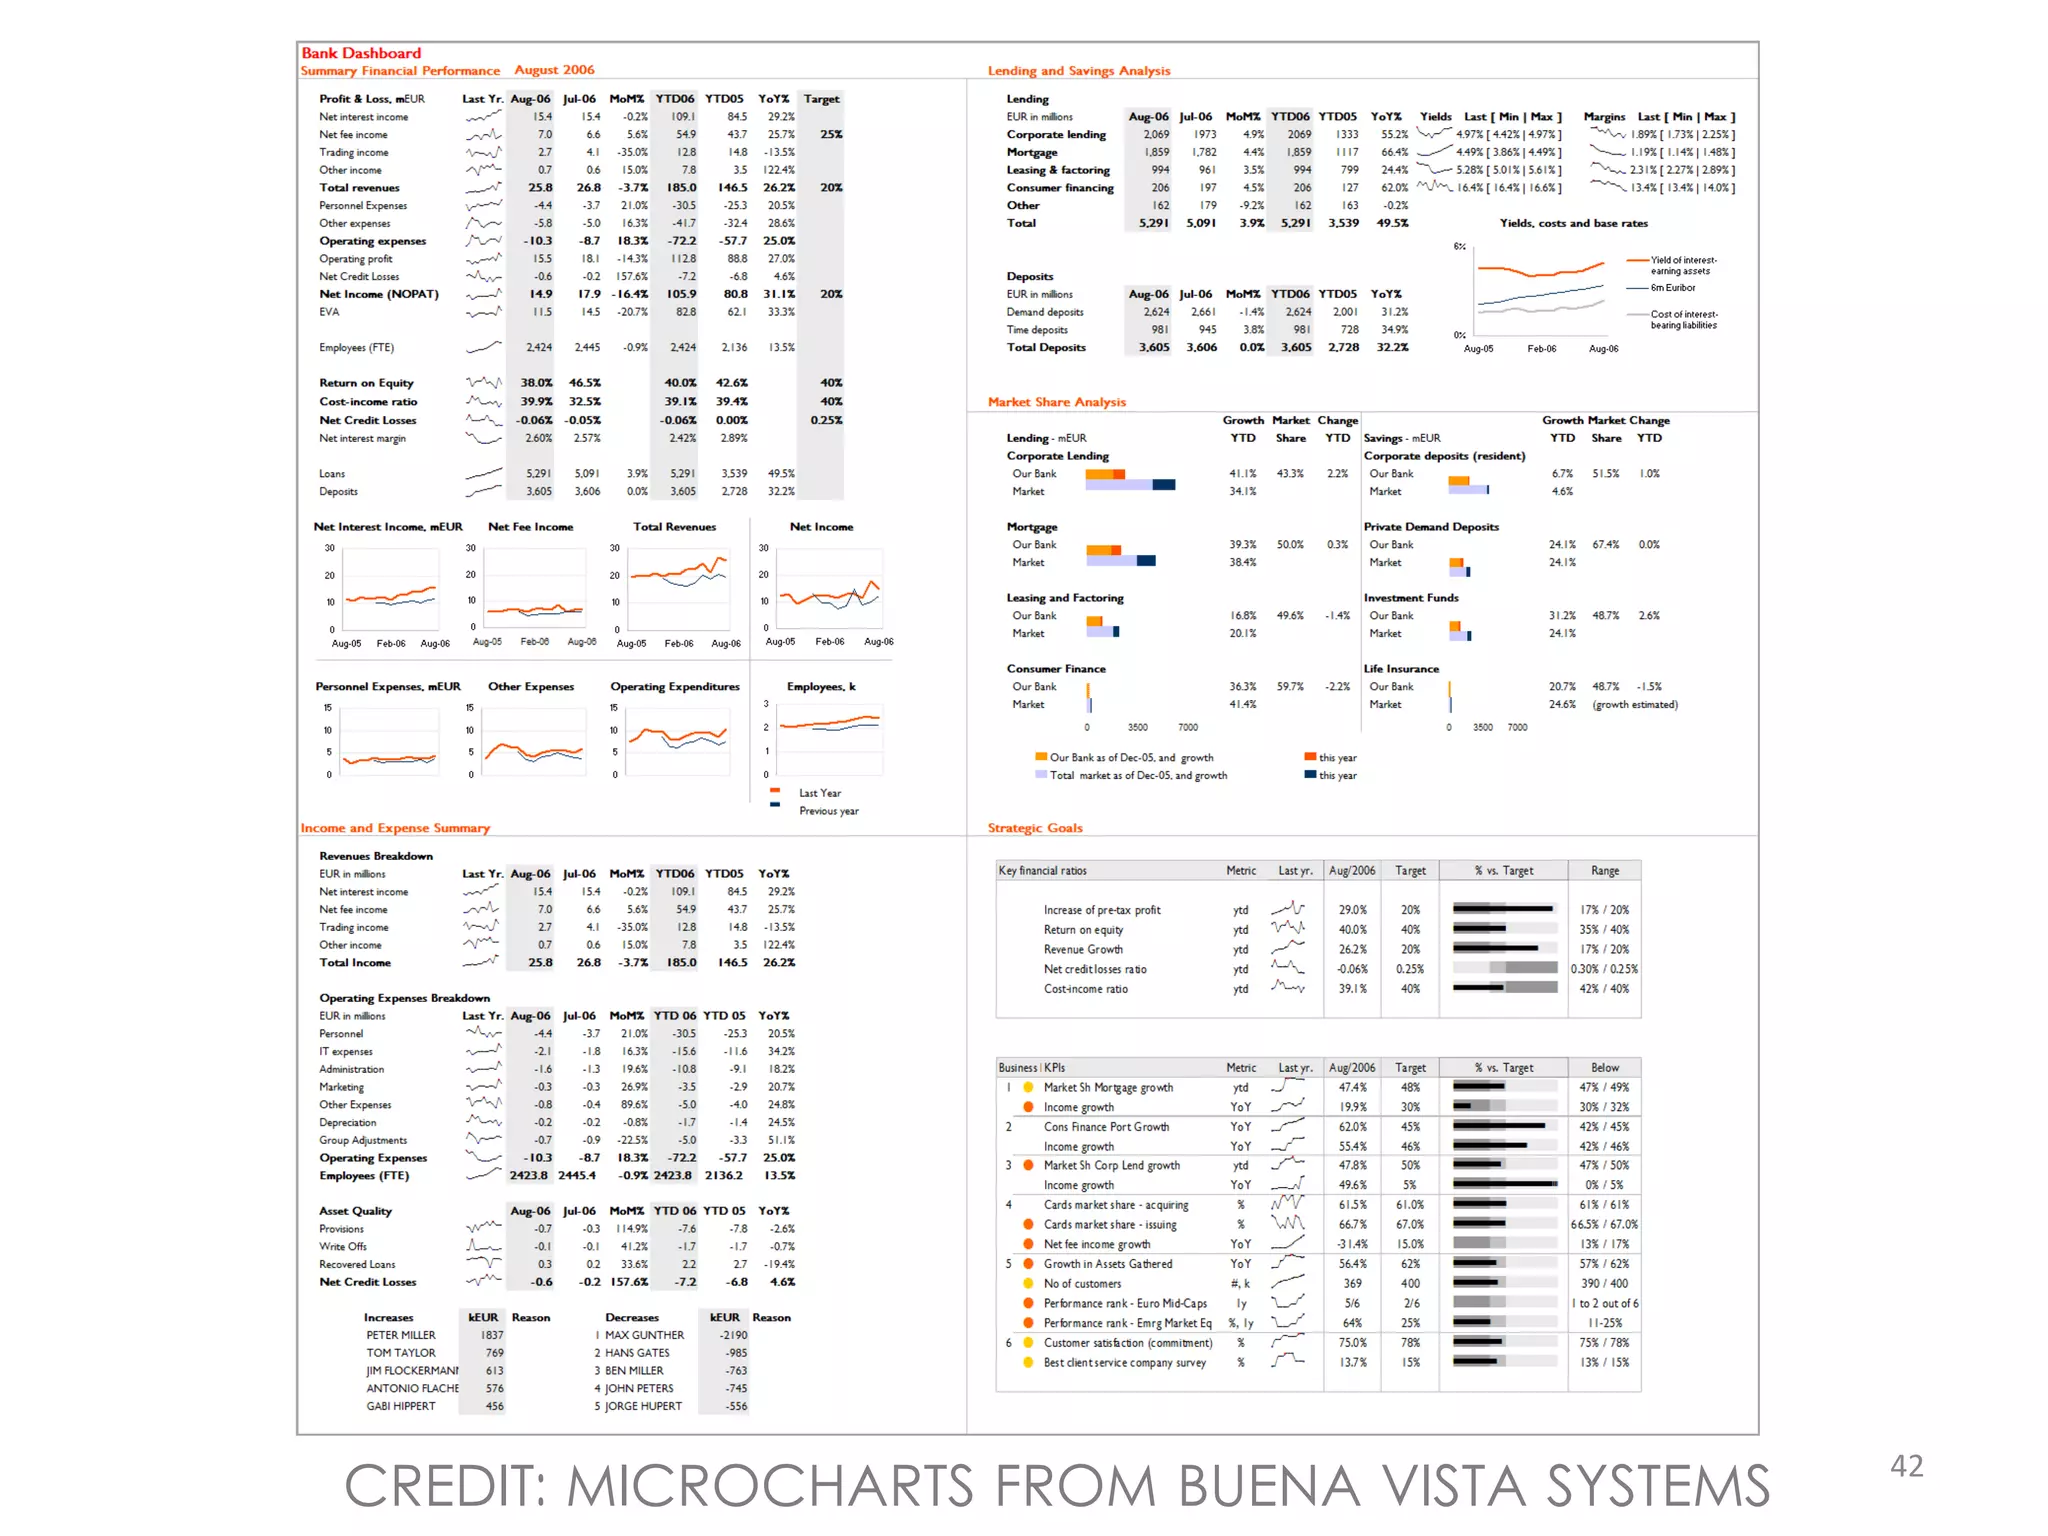
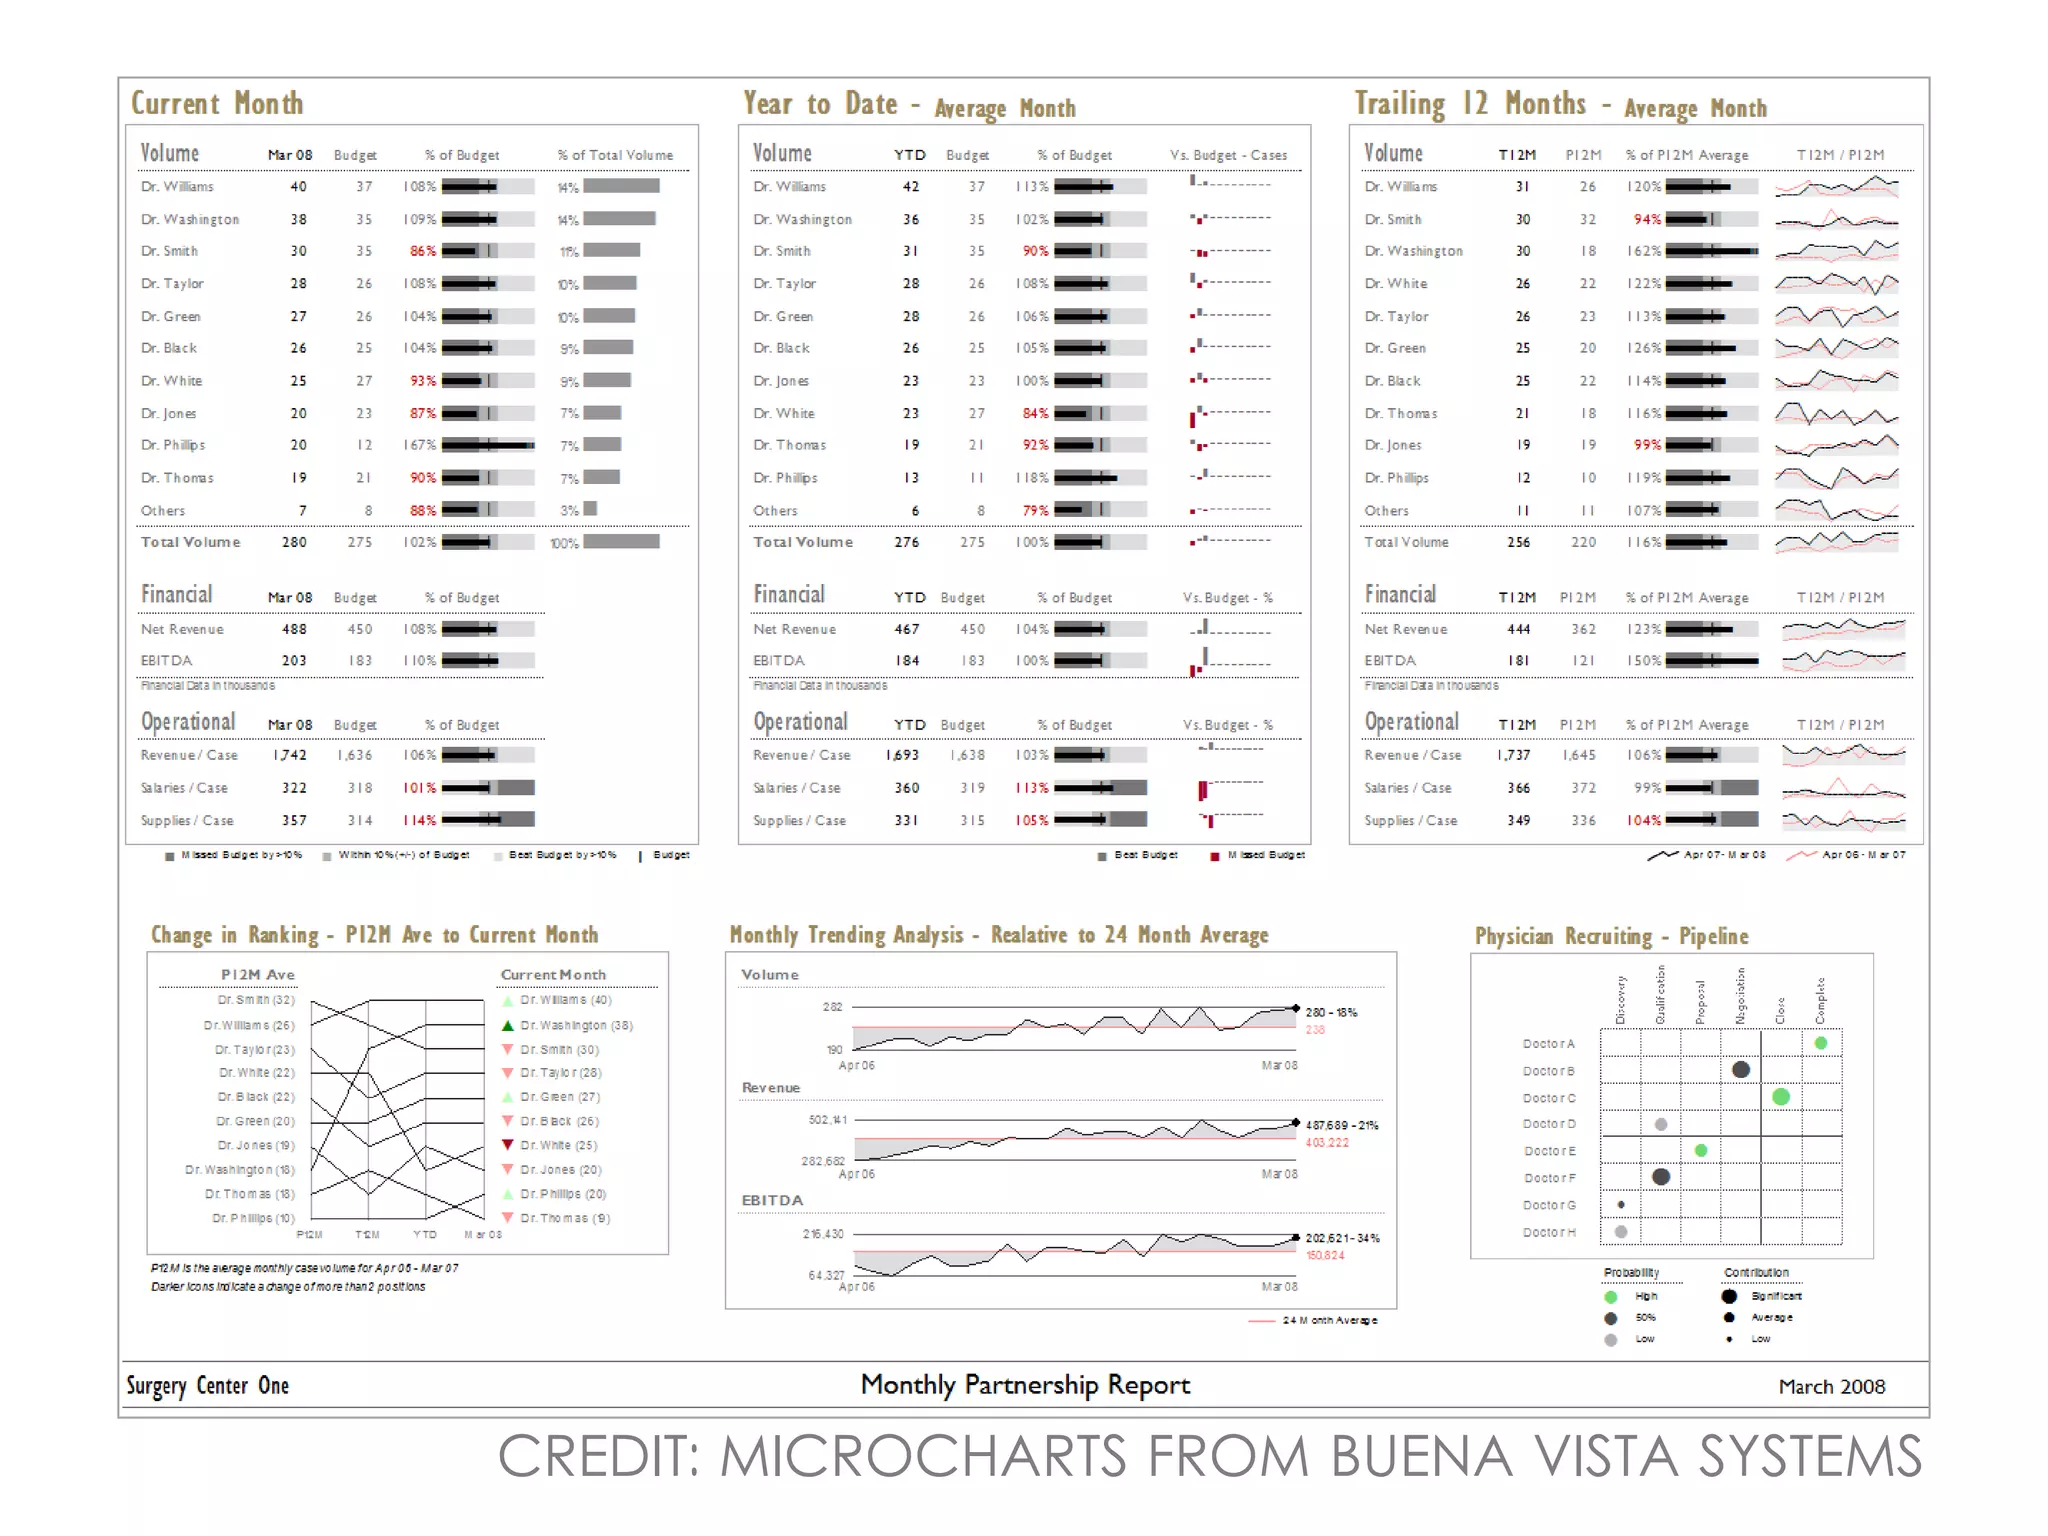
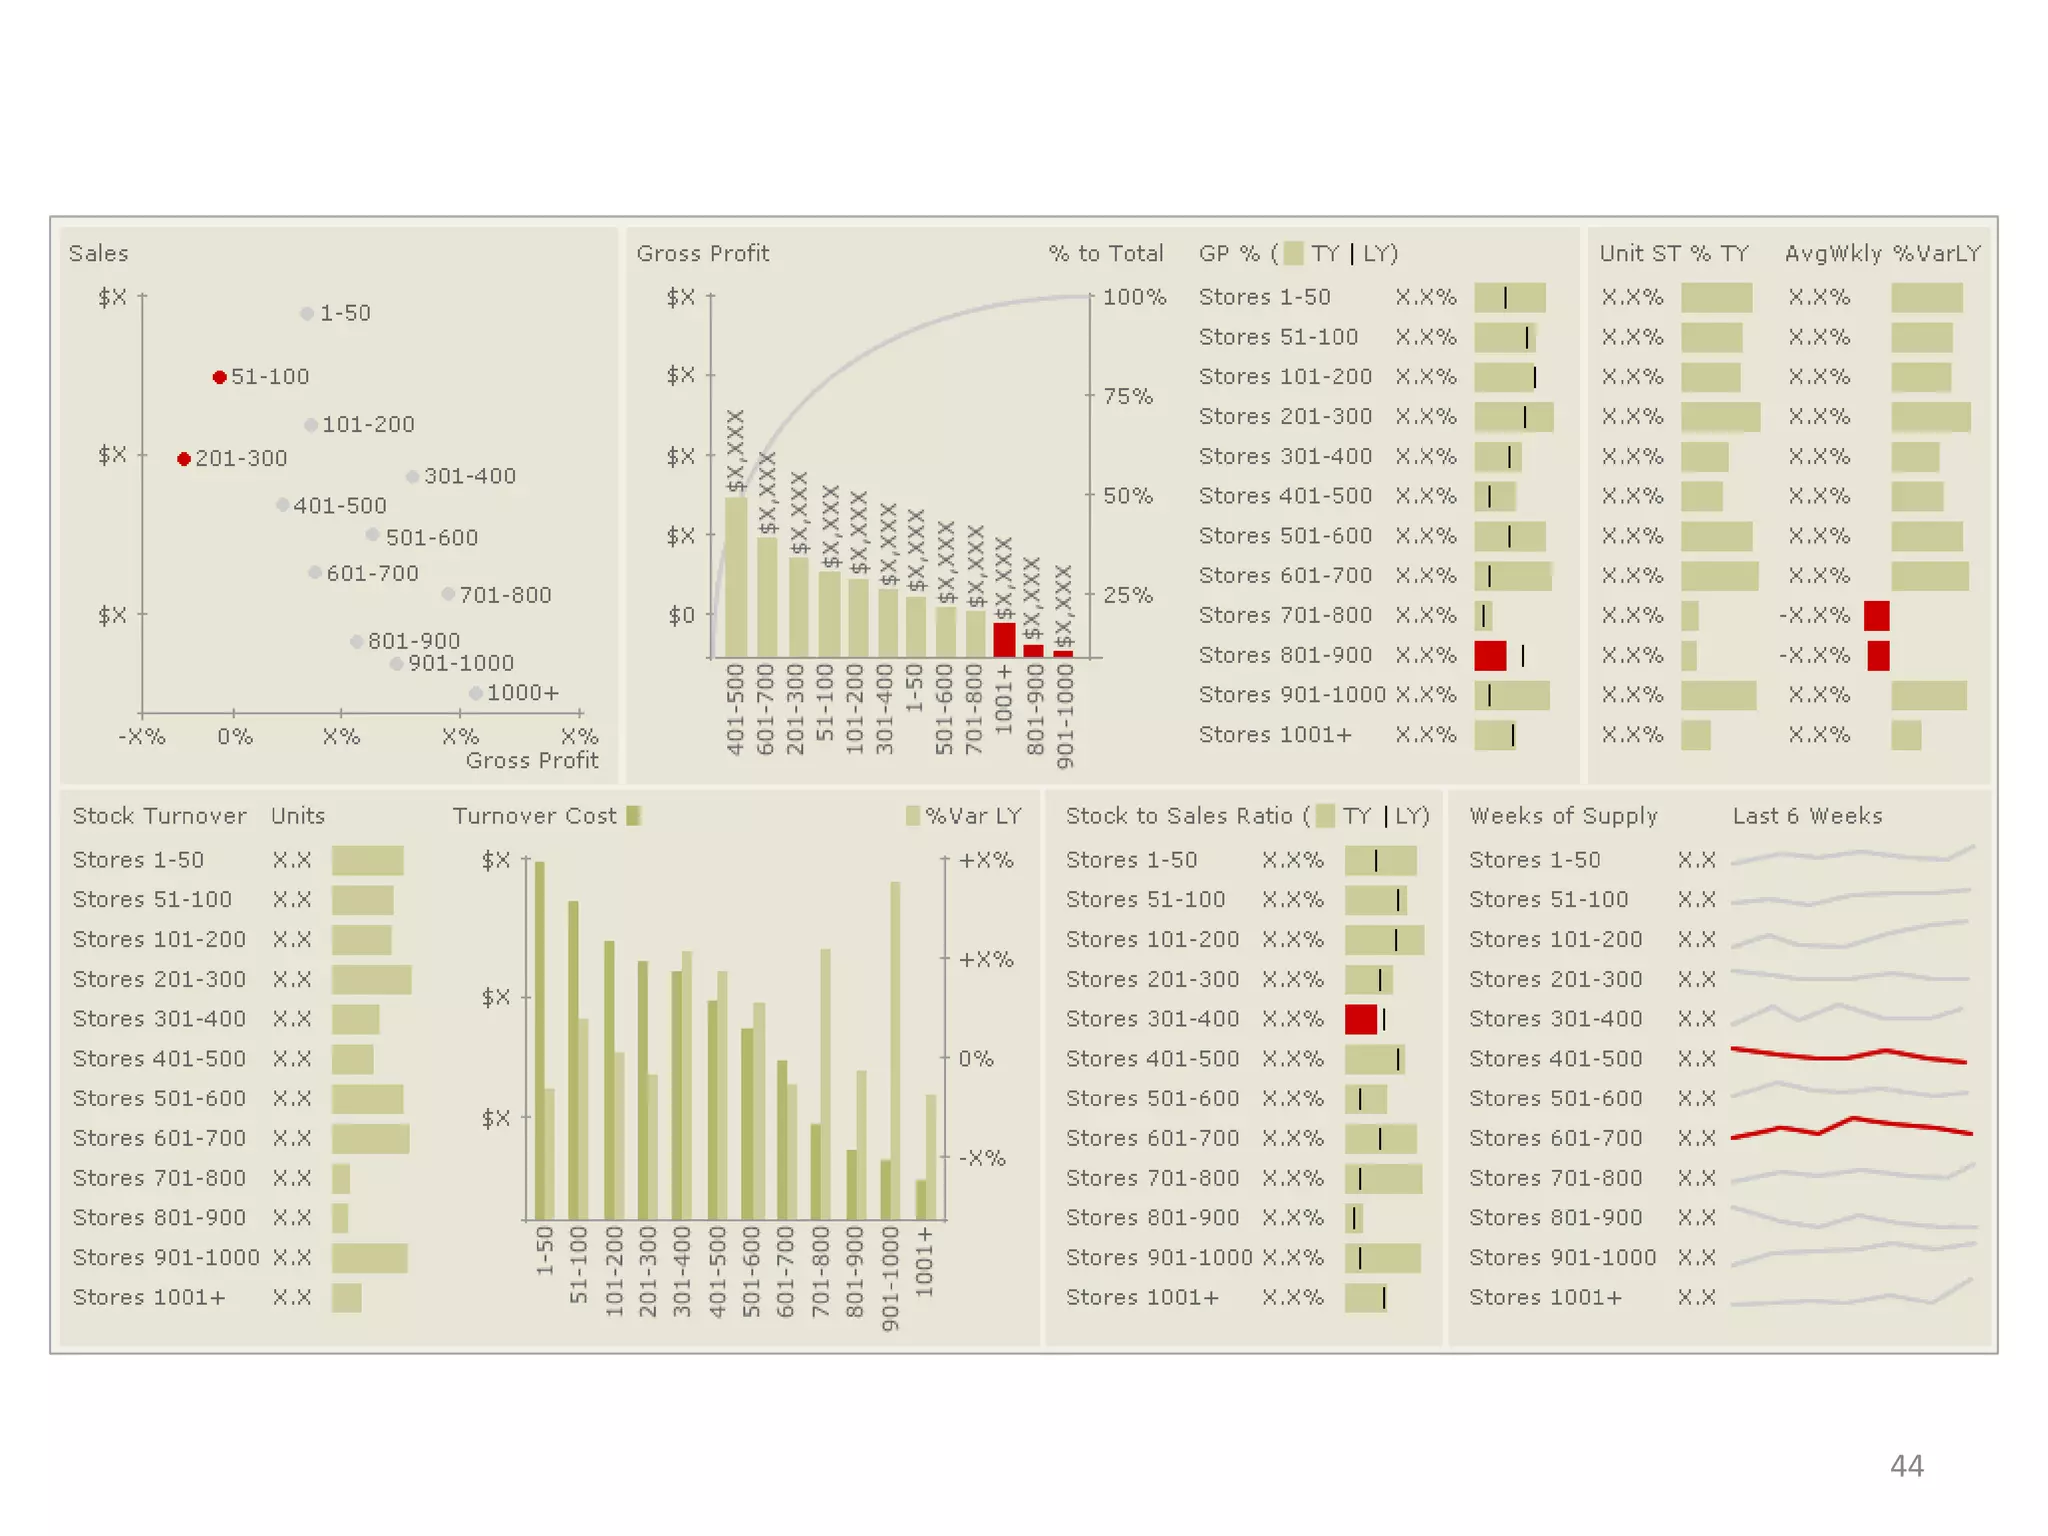
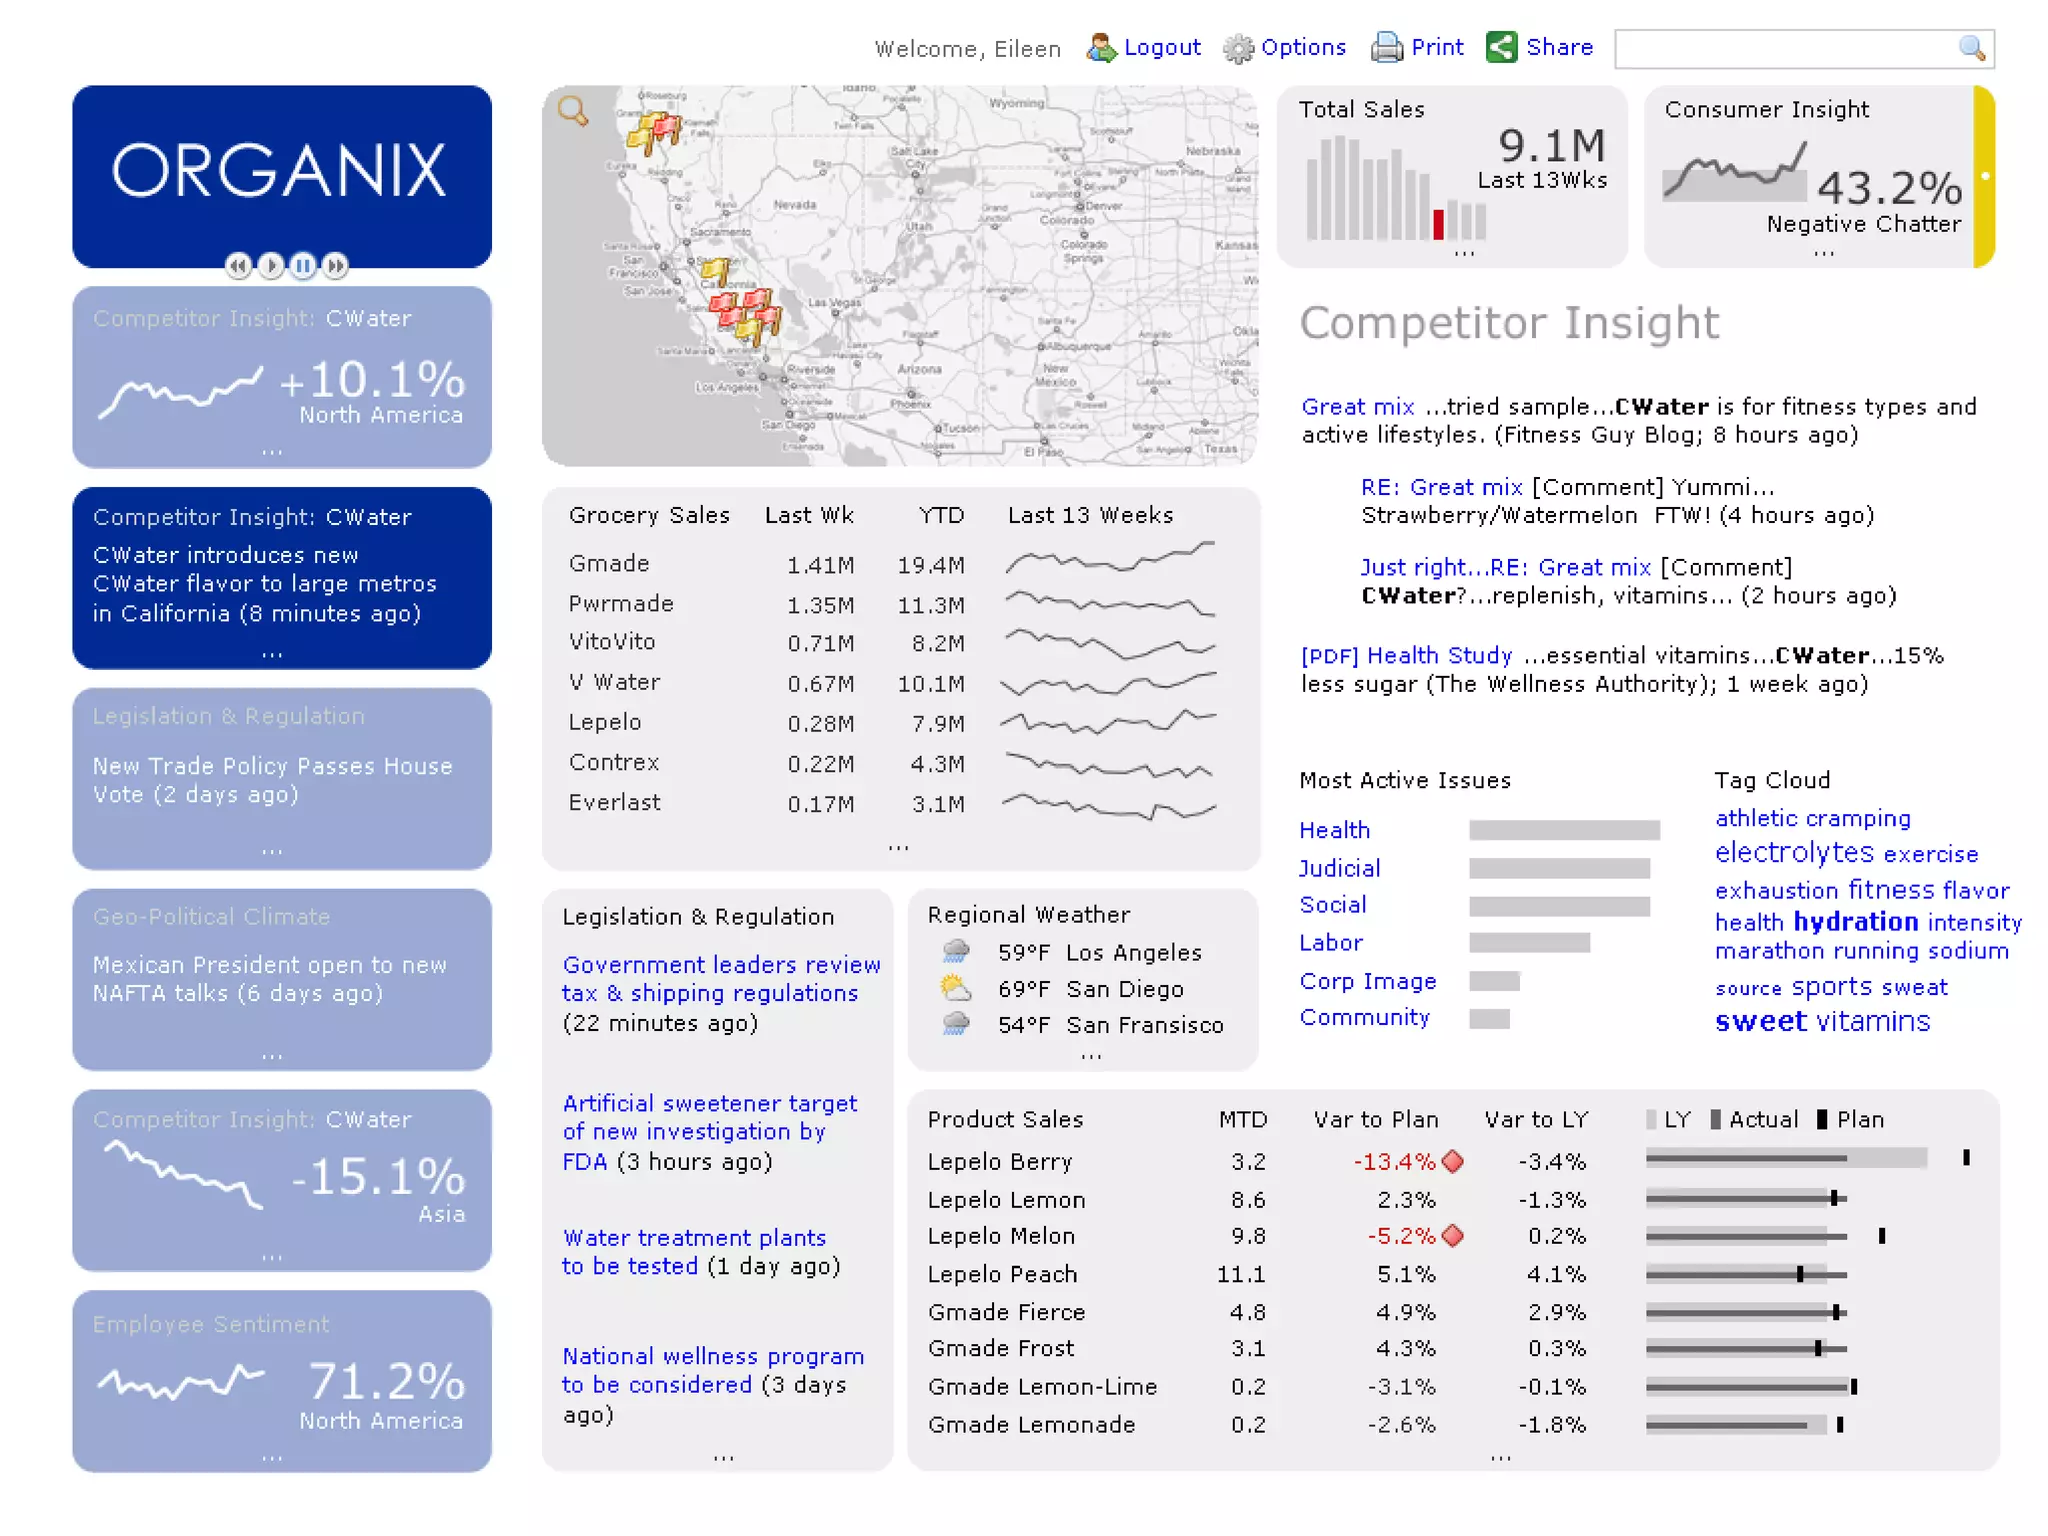


The document discusses the fundamentals of effective dashboard design, highlighting that a dashboard is a visual display of key information for achieving objectives. It emphasizes user focus and incorporates various design techniques to enhance usability. The content includes references to resources and examples for further exploration of effective dashboard practices.


