Downloaded 396 times
![Signals
To be transmitted, data must be transformed
to electromagnetic signals.
A signal is defined as any physical quantity that varies
with time, space or any other independent variables.
By a signal we mean any variable that carries some
information.
Continous signal:
x(t)
Discrete signal (sequence):
x[n]
3](https://image.slidesharecdn.com/2-140226042654-phpapp01/75/2-data-and-signals-3-2048.jpg)
![PERIODIC & NON-PERIDIC SIGNALS
Periodic Signal
A continuous-time periodic signal is
unchanged/repeated by a time shift
of T0. T0 is called the fundamental
period.
x( t ) = x( t + T0 )
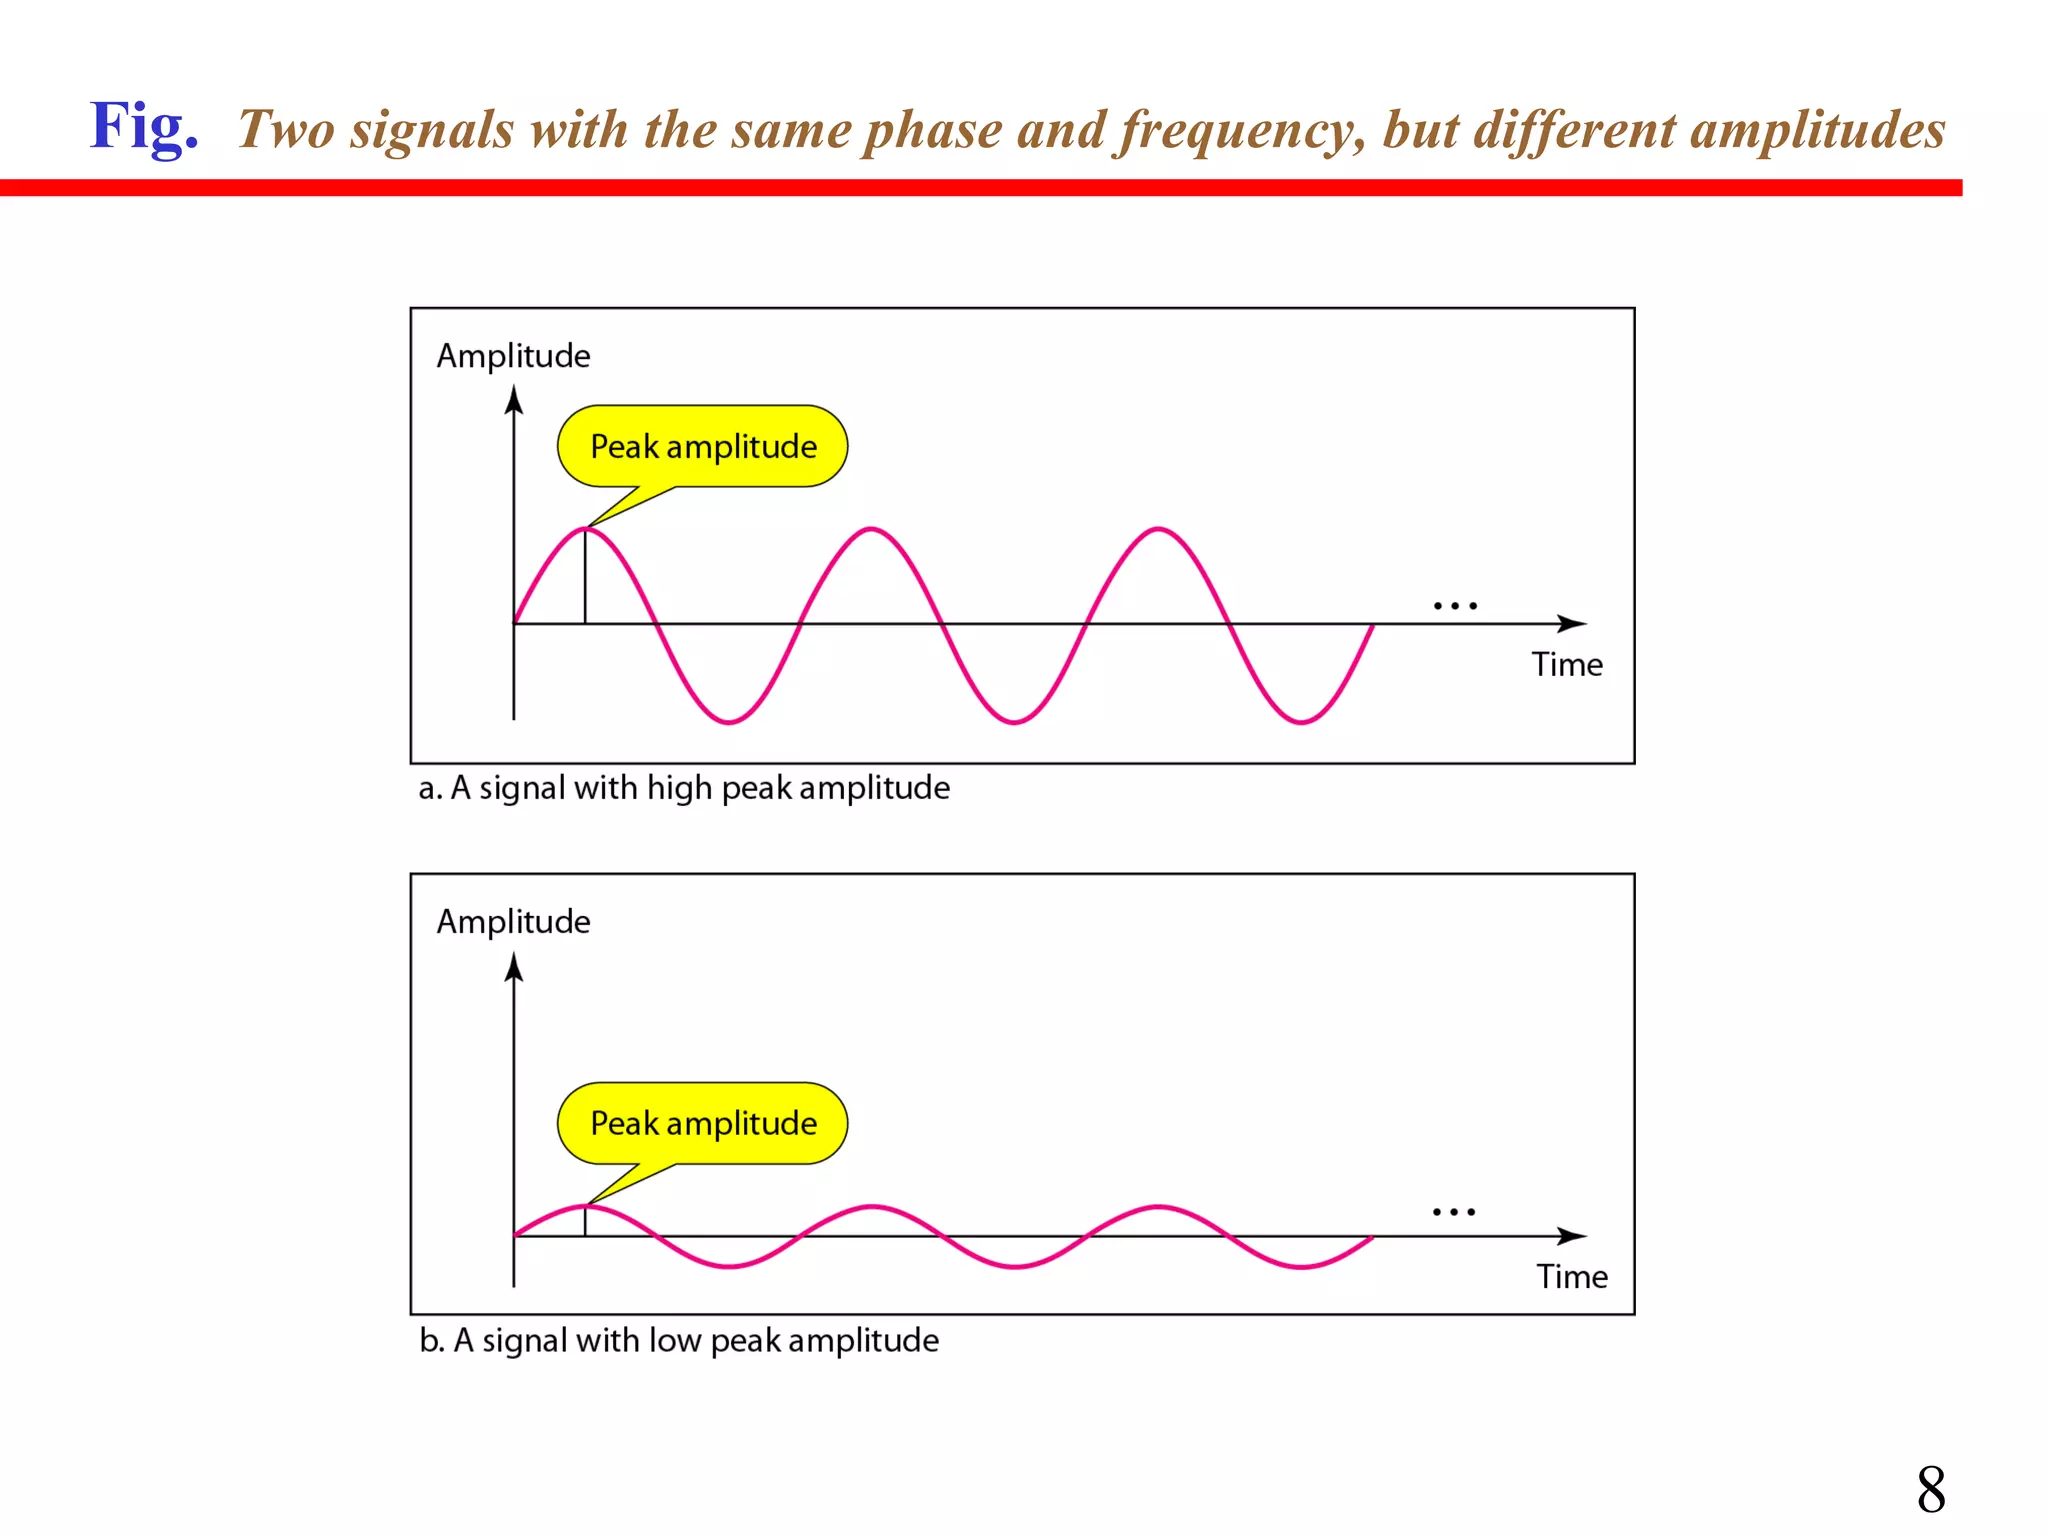
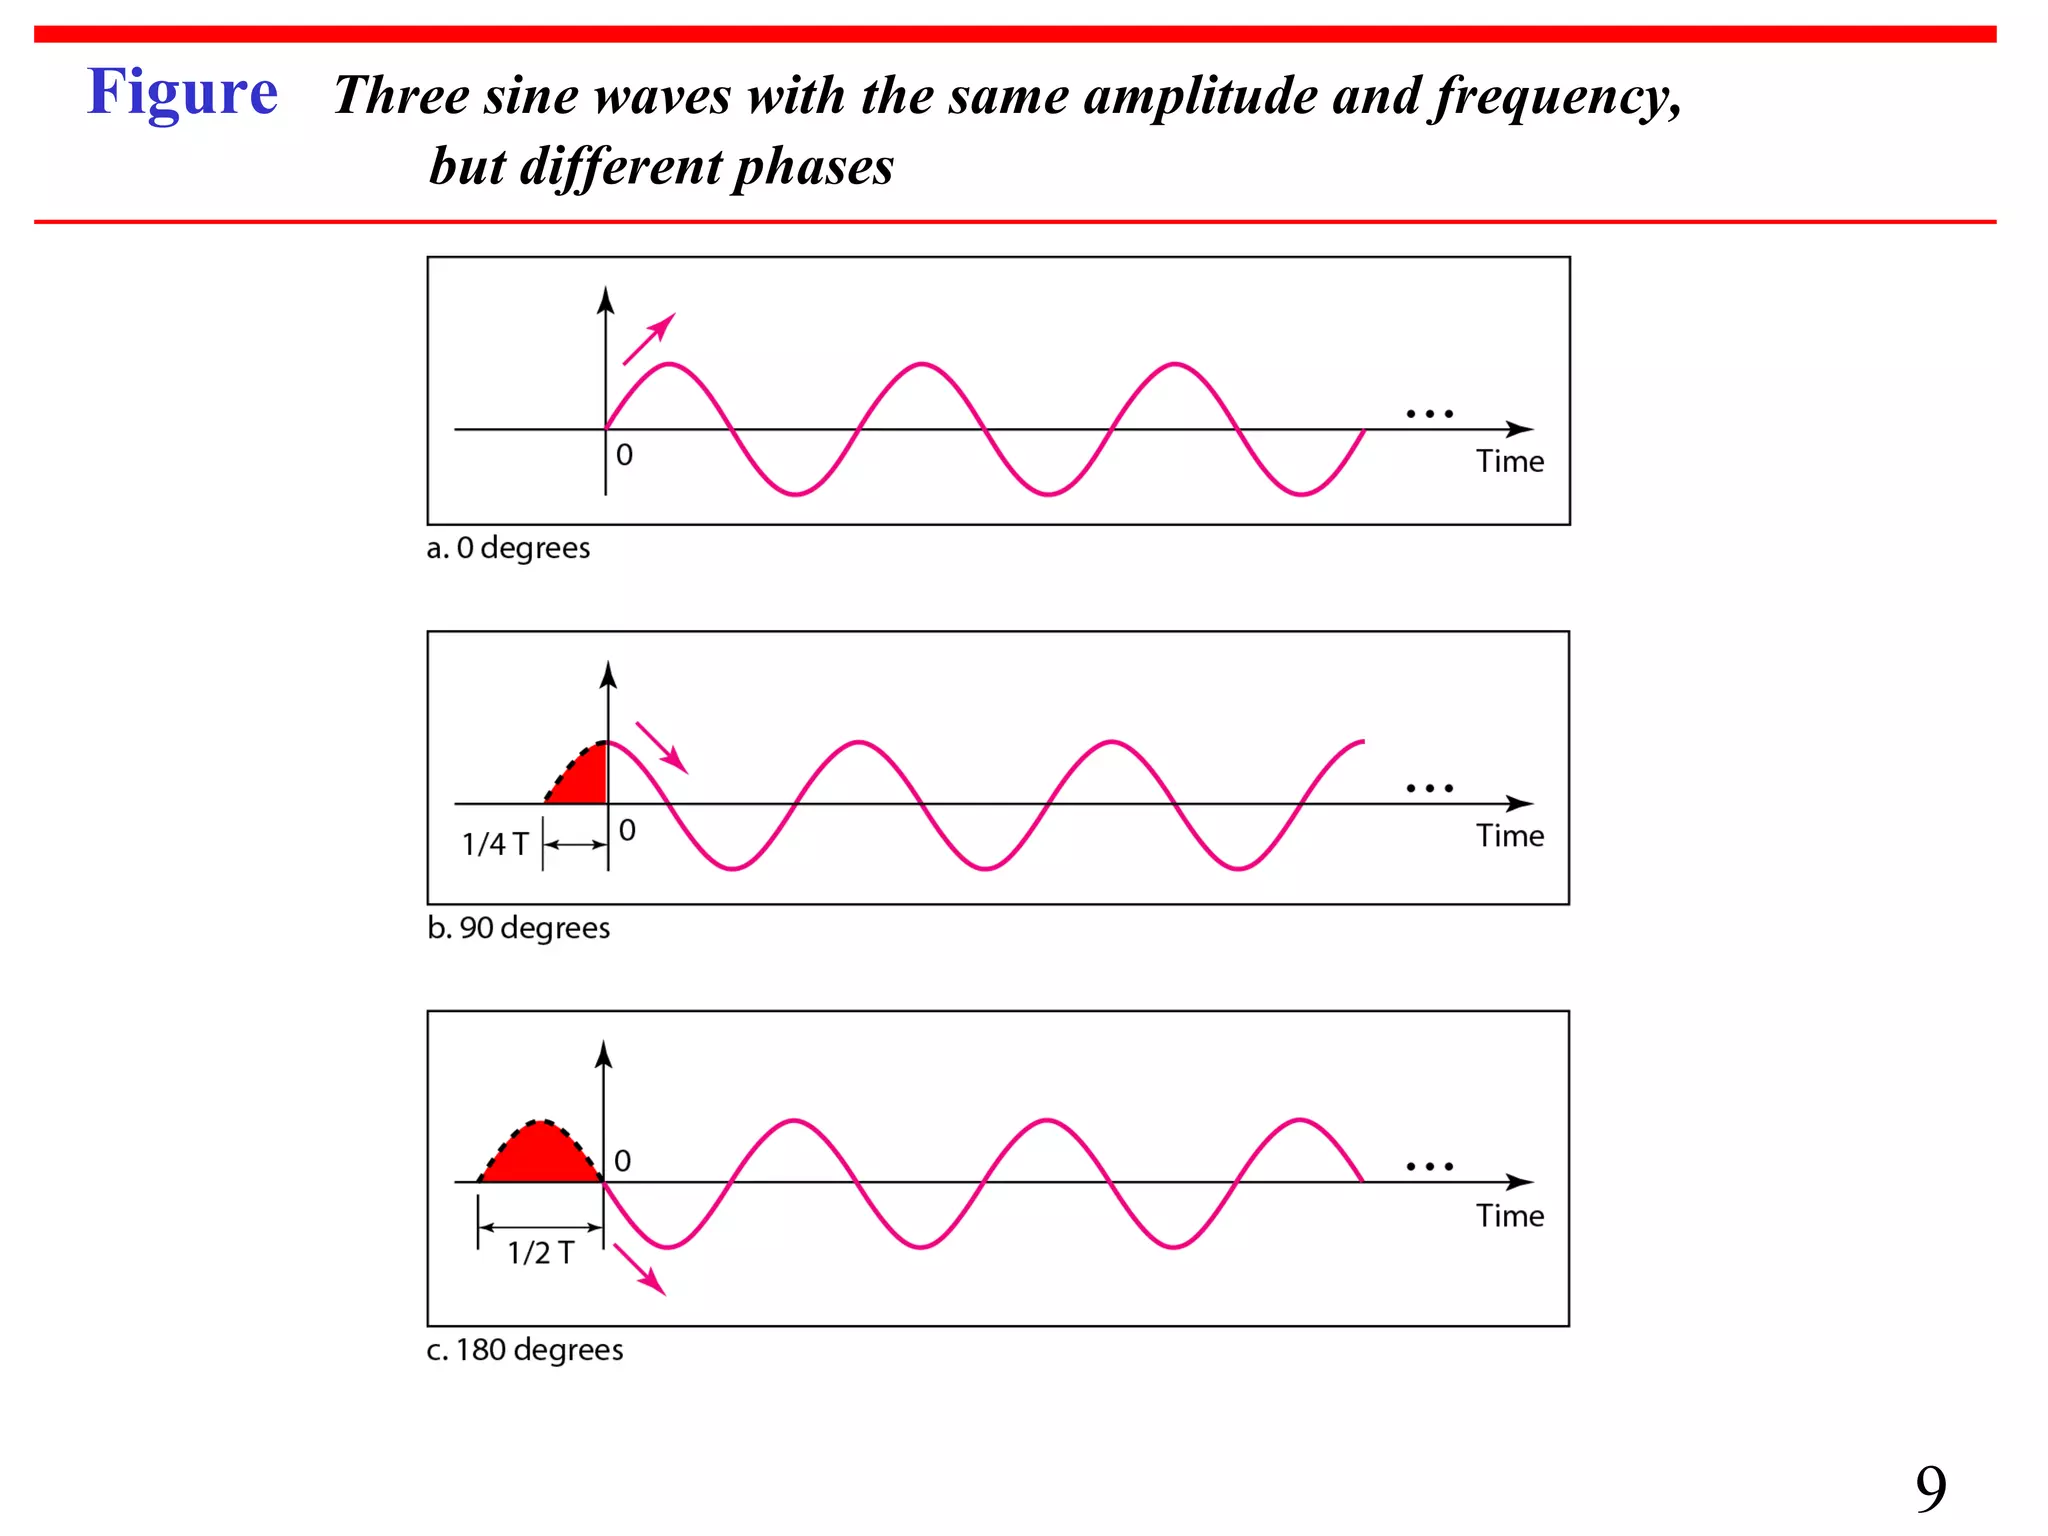
A sine wave: x(t) = A sin(2Πft+Φ)
A discrete-time periodic signal is
unchanged by a time shift of N0.
N0 is the fundamental period.
x[ n ] = x[ n + N 0 ]
Non-Periodic Signal
Not periodic
In data communications, we commonly use periodic
analog signals and non-periodic digital signals.
5](https://image.slidesharecdn.com/2-140226042654-phpapp01/75/2-data-and-signals-5-2048.jpg)
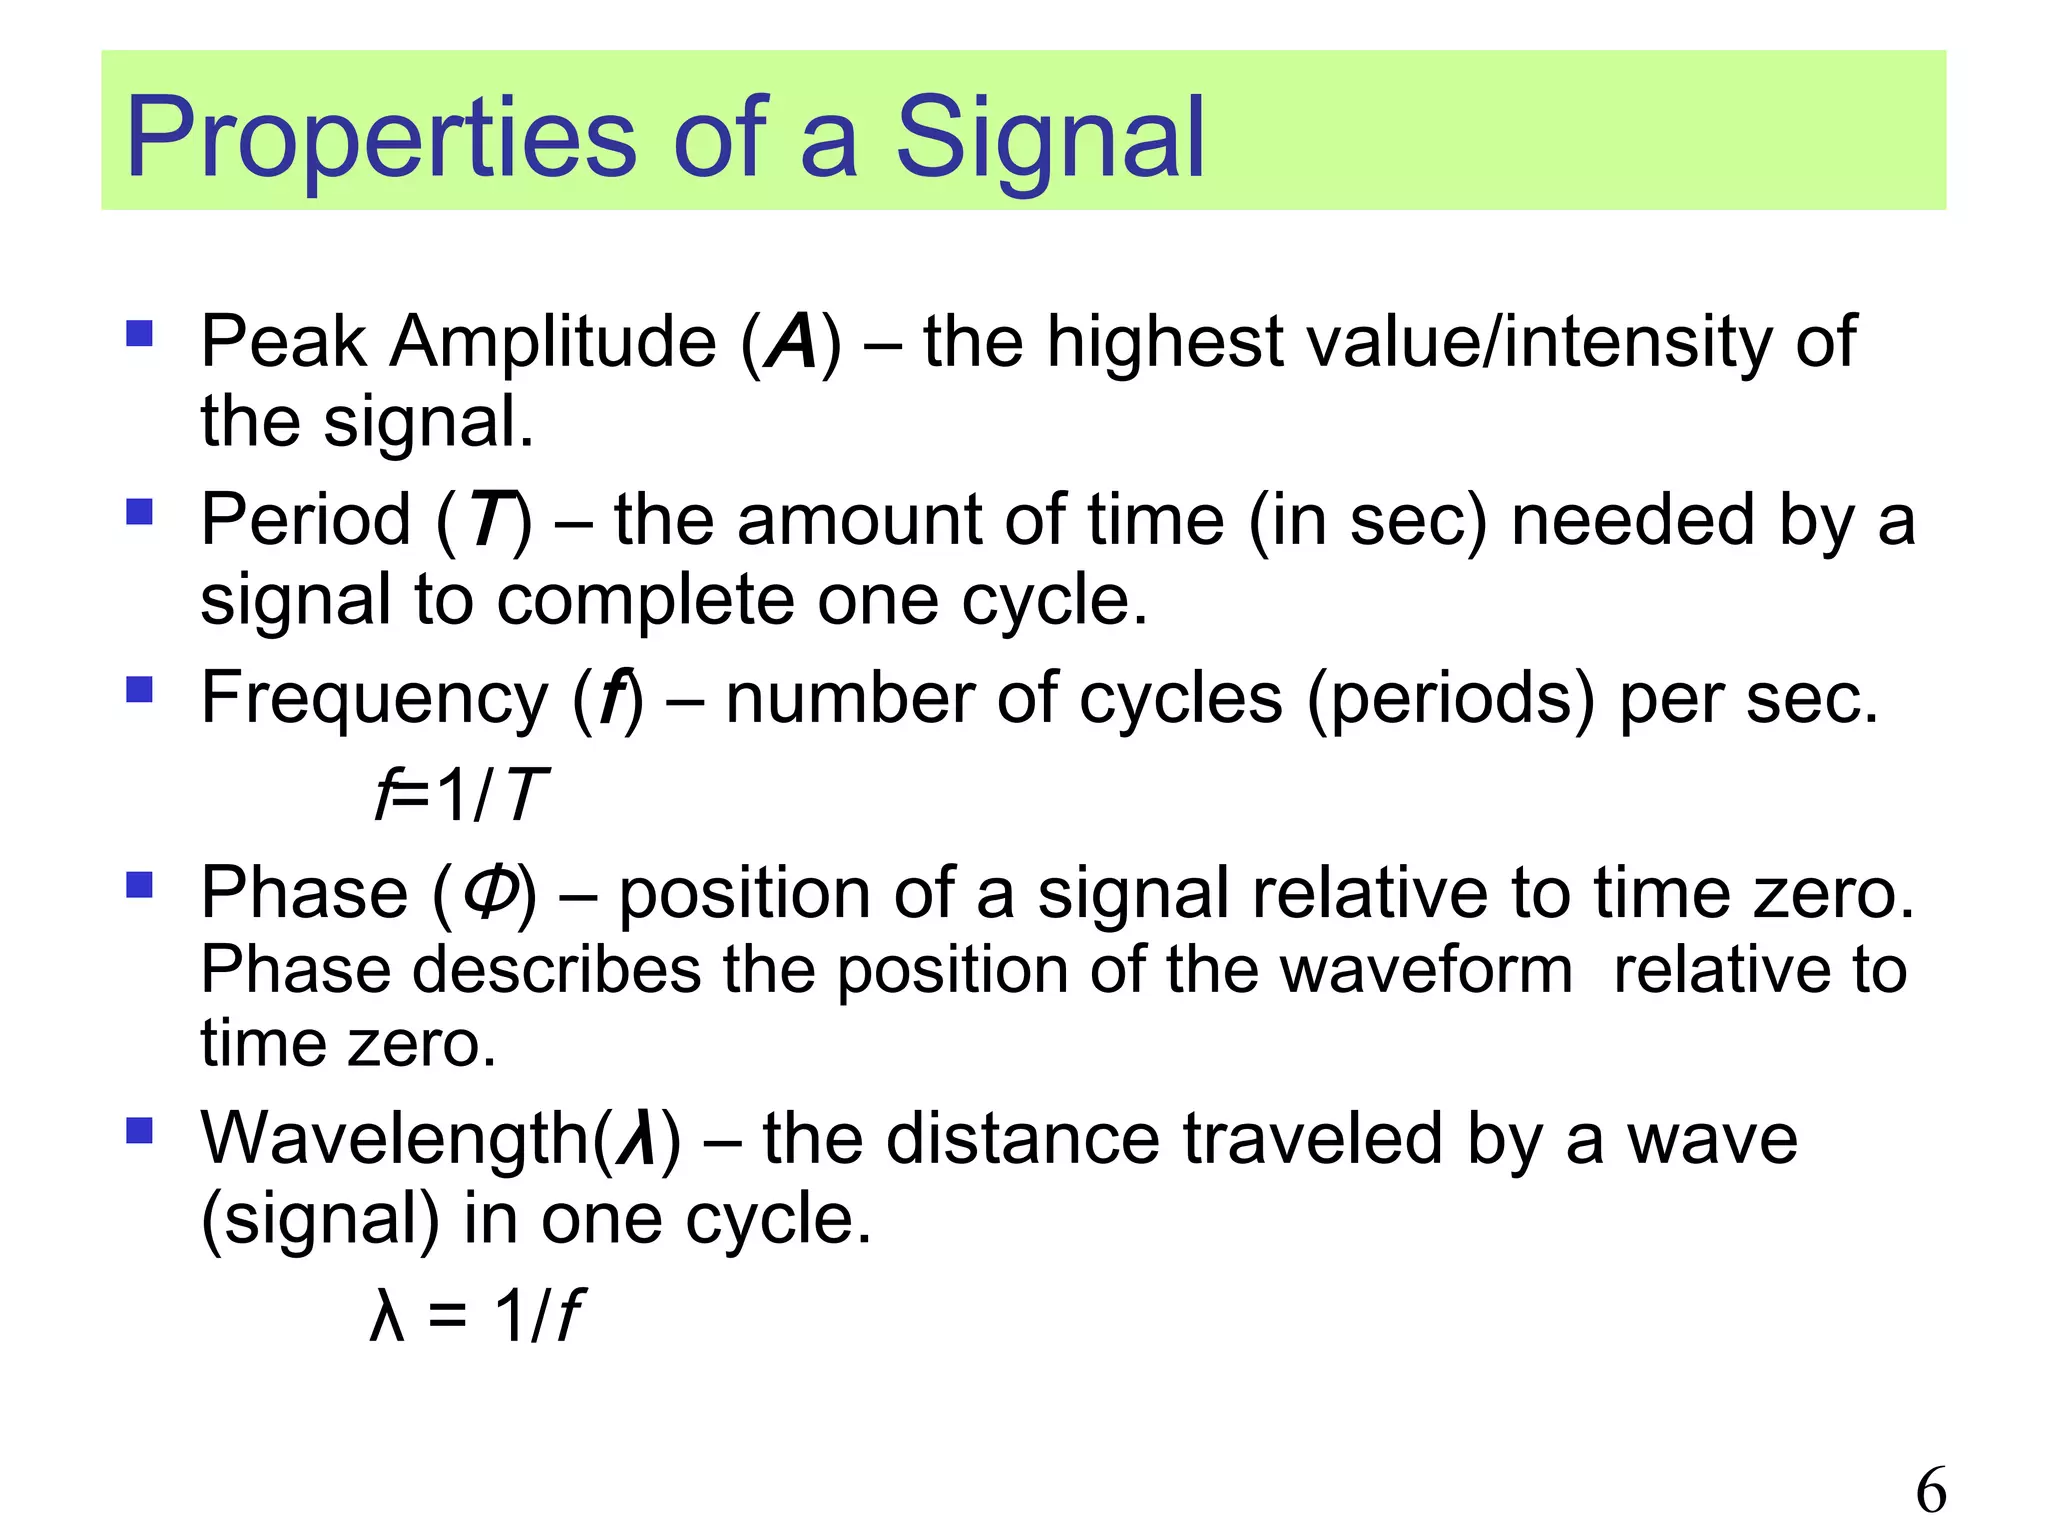
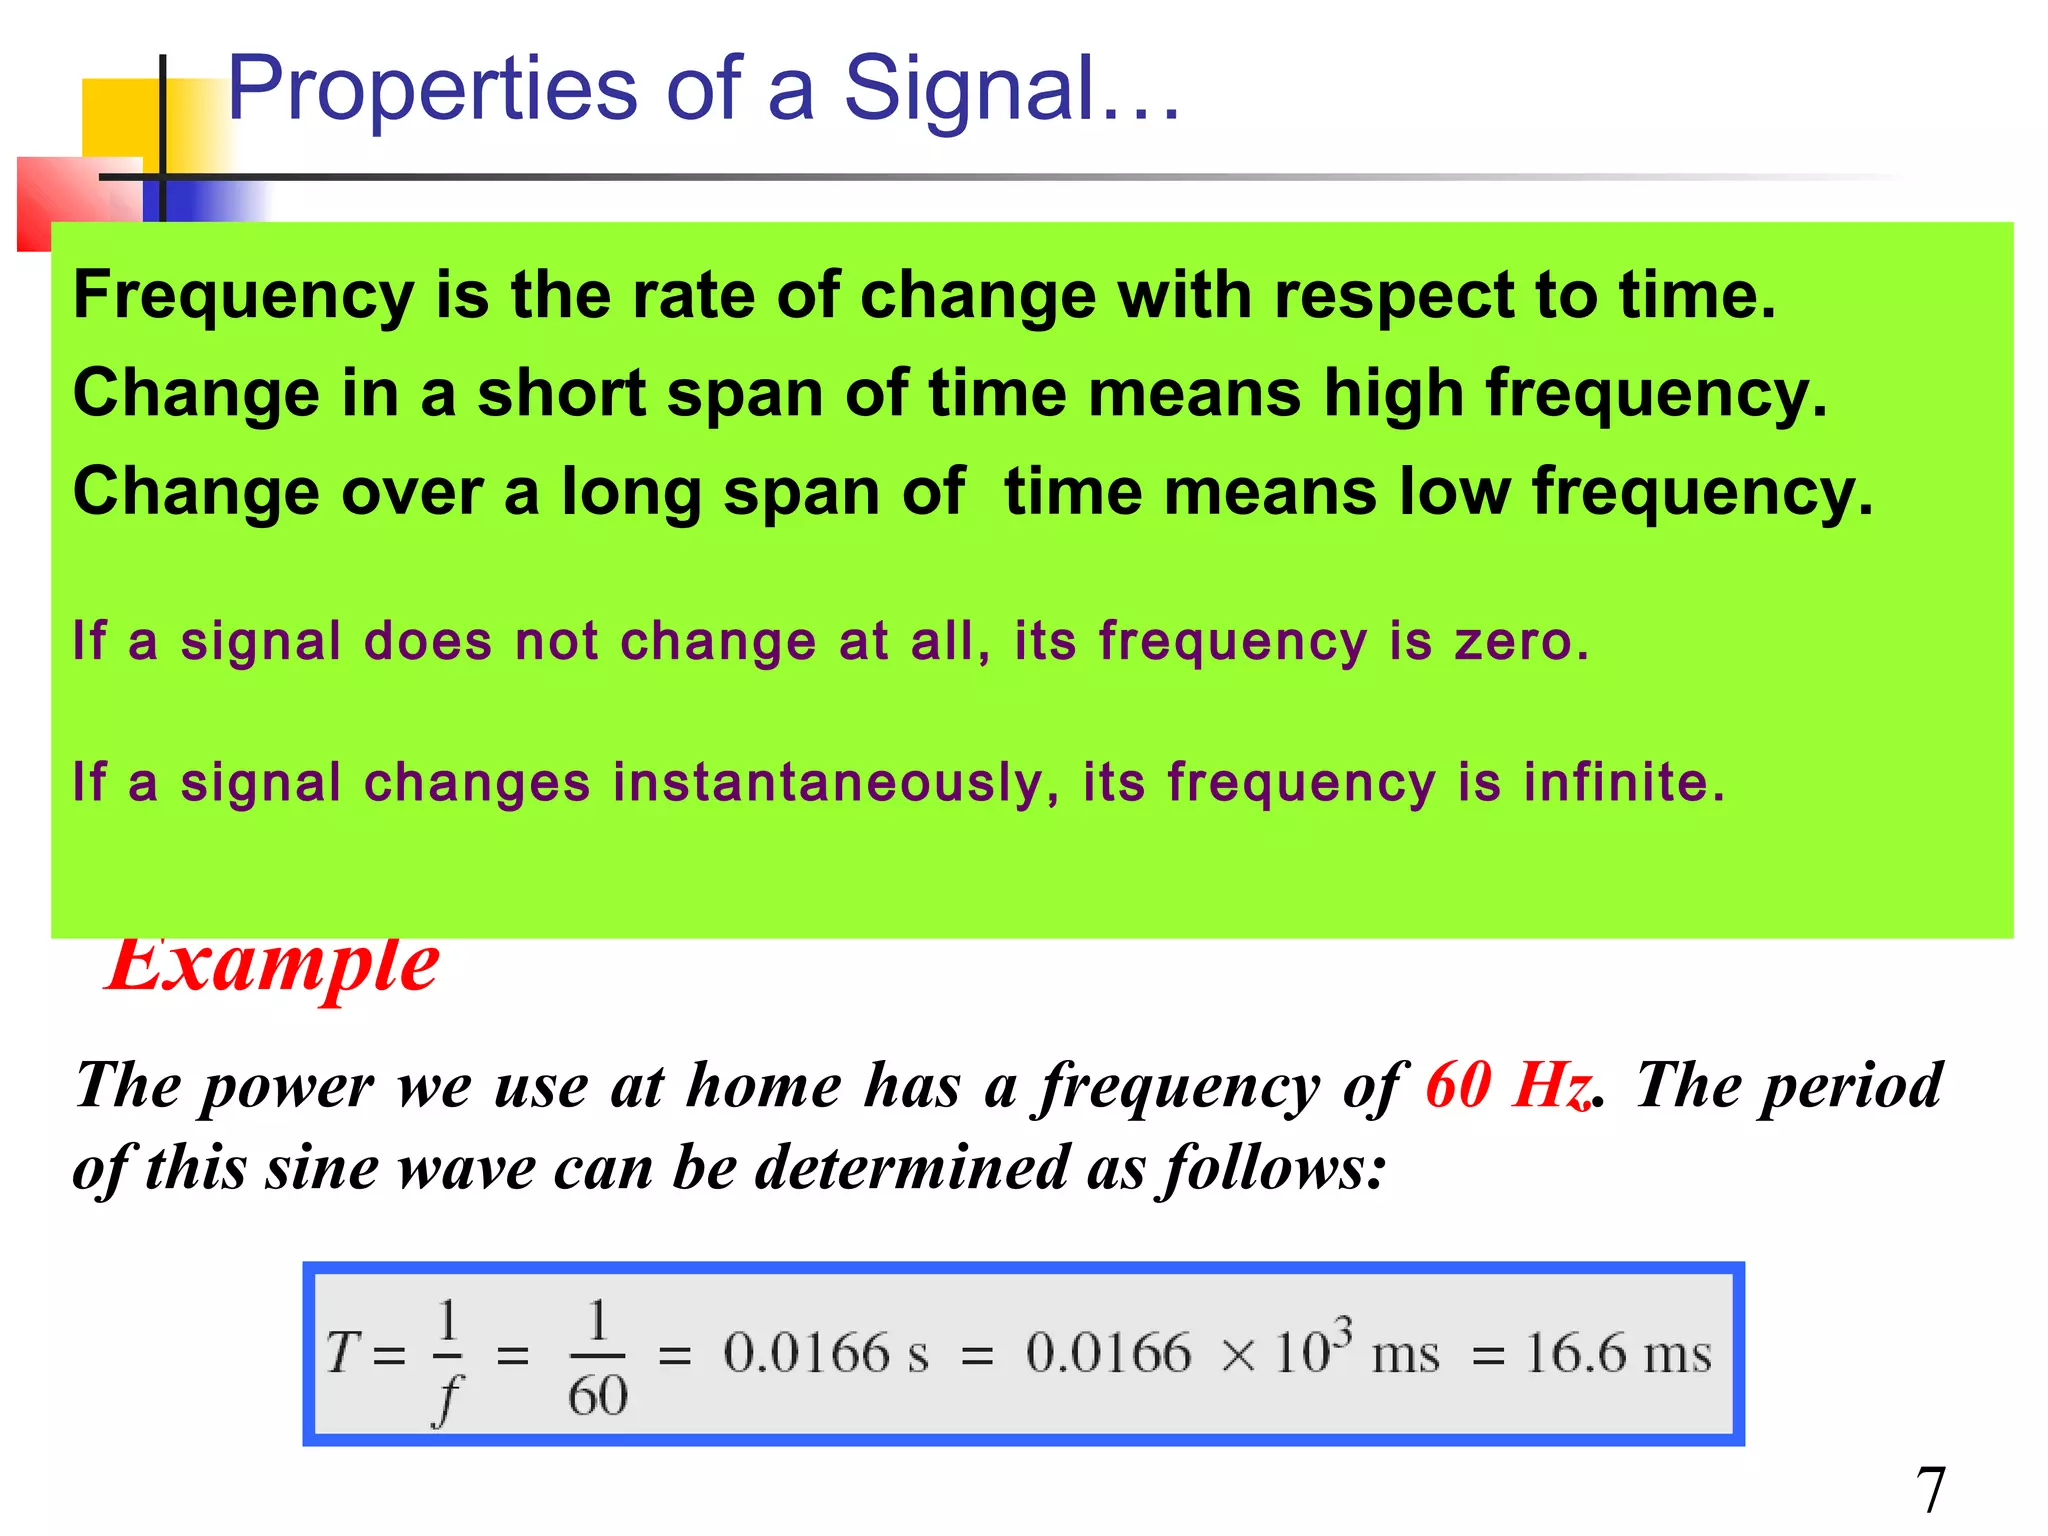
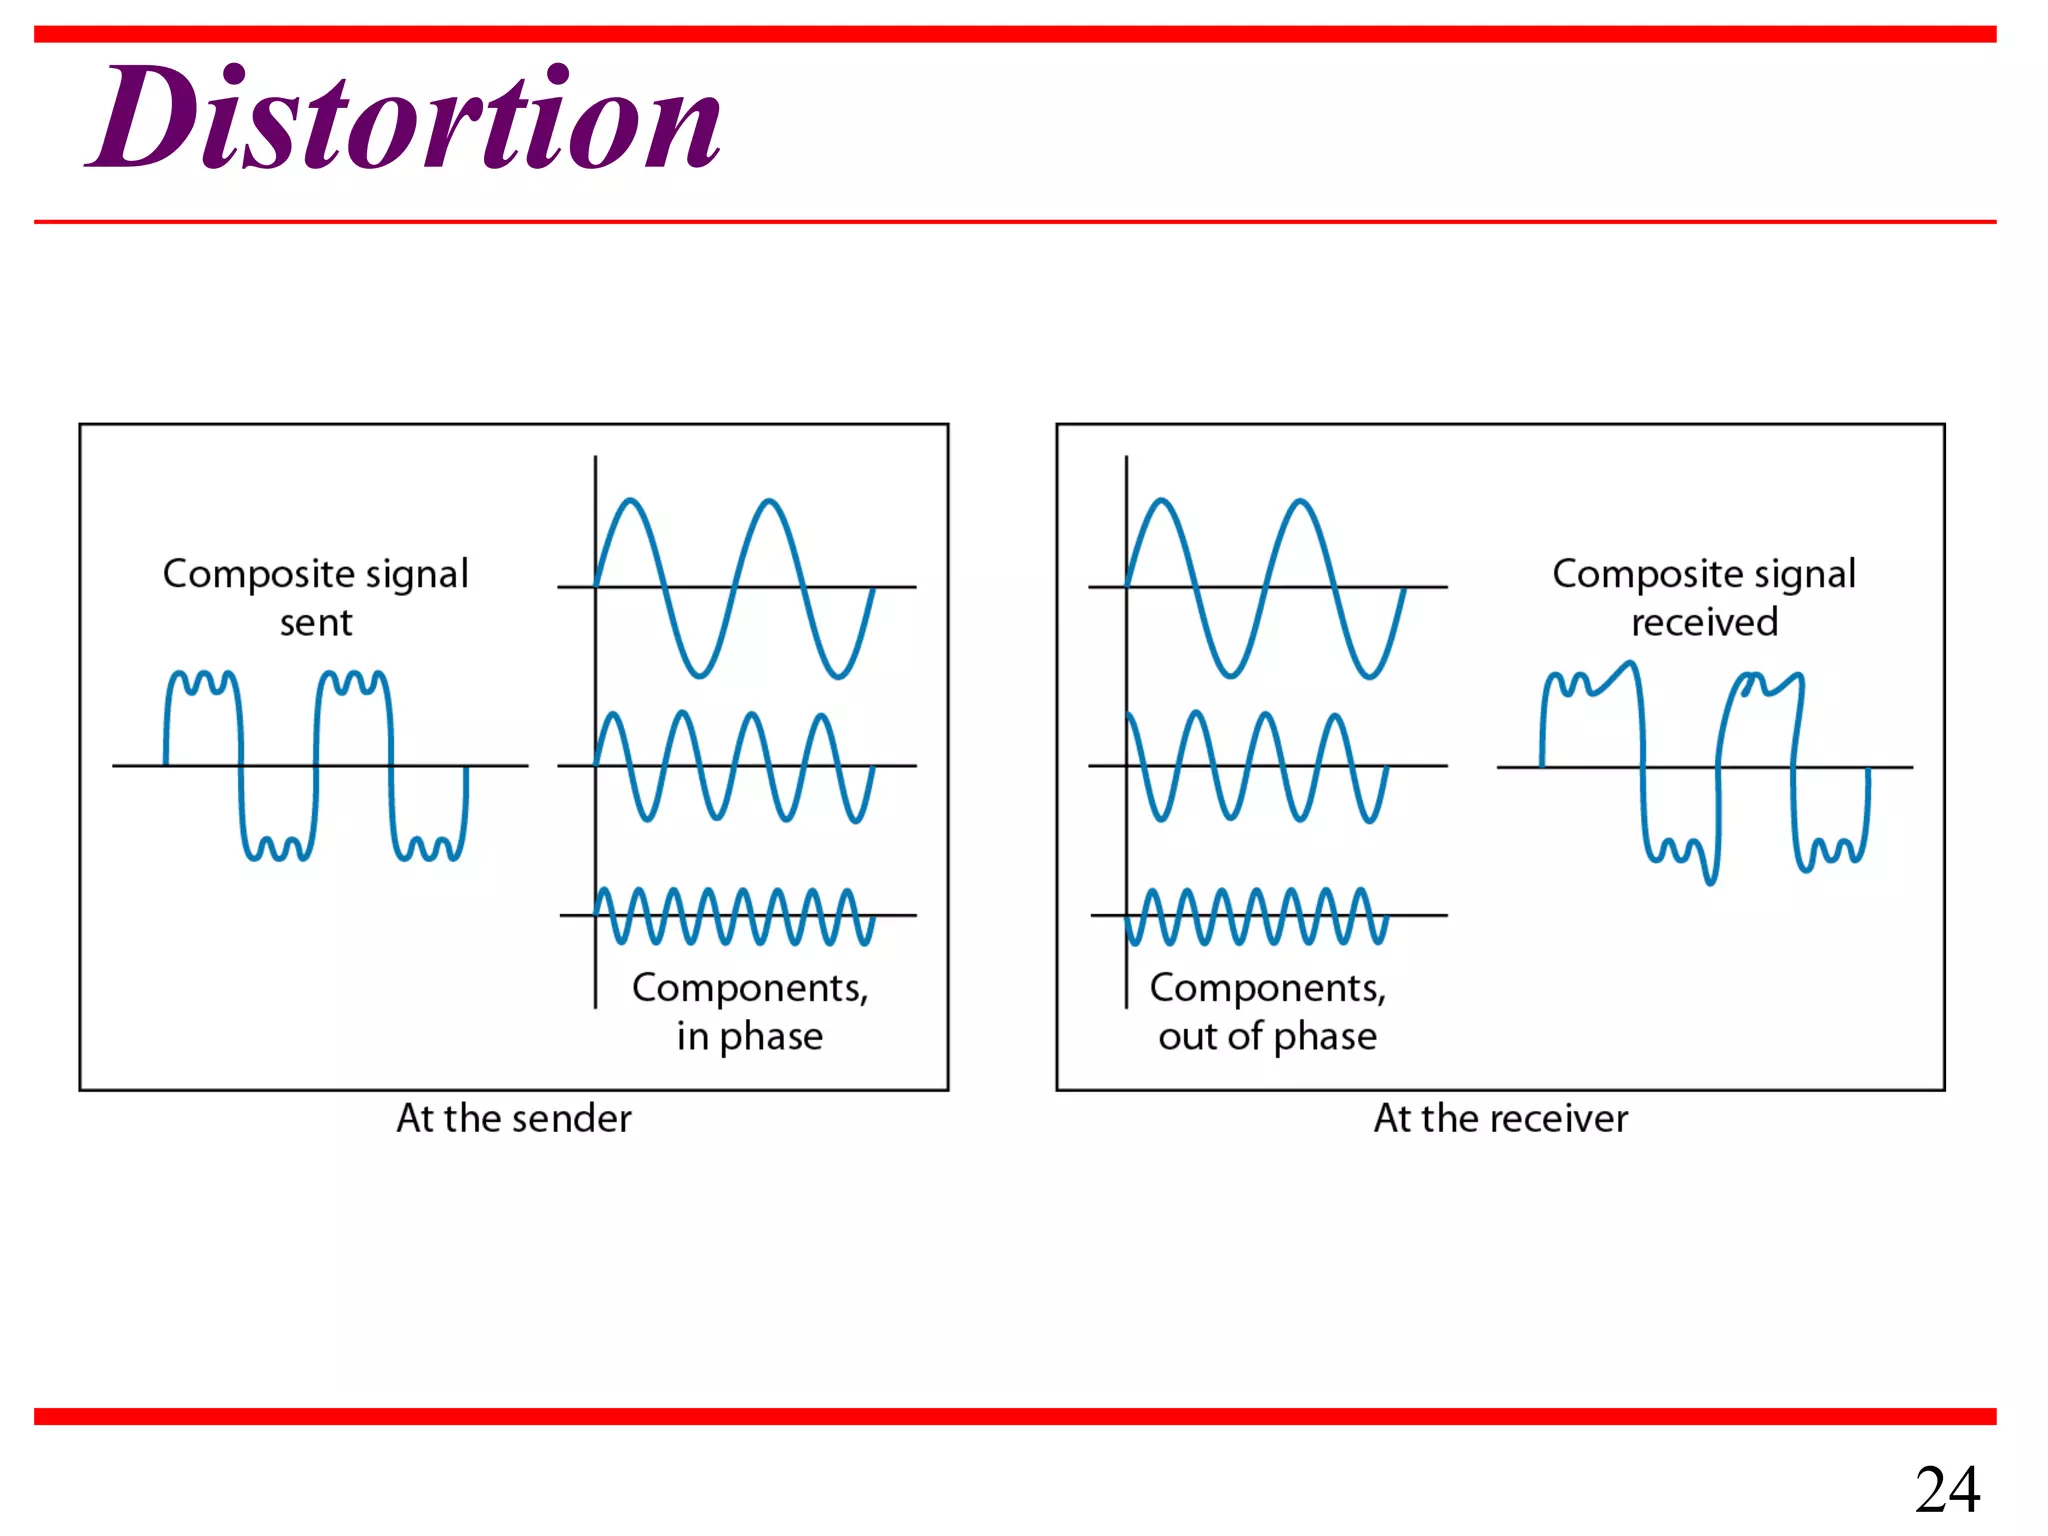
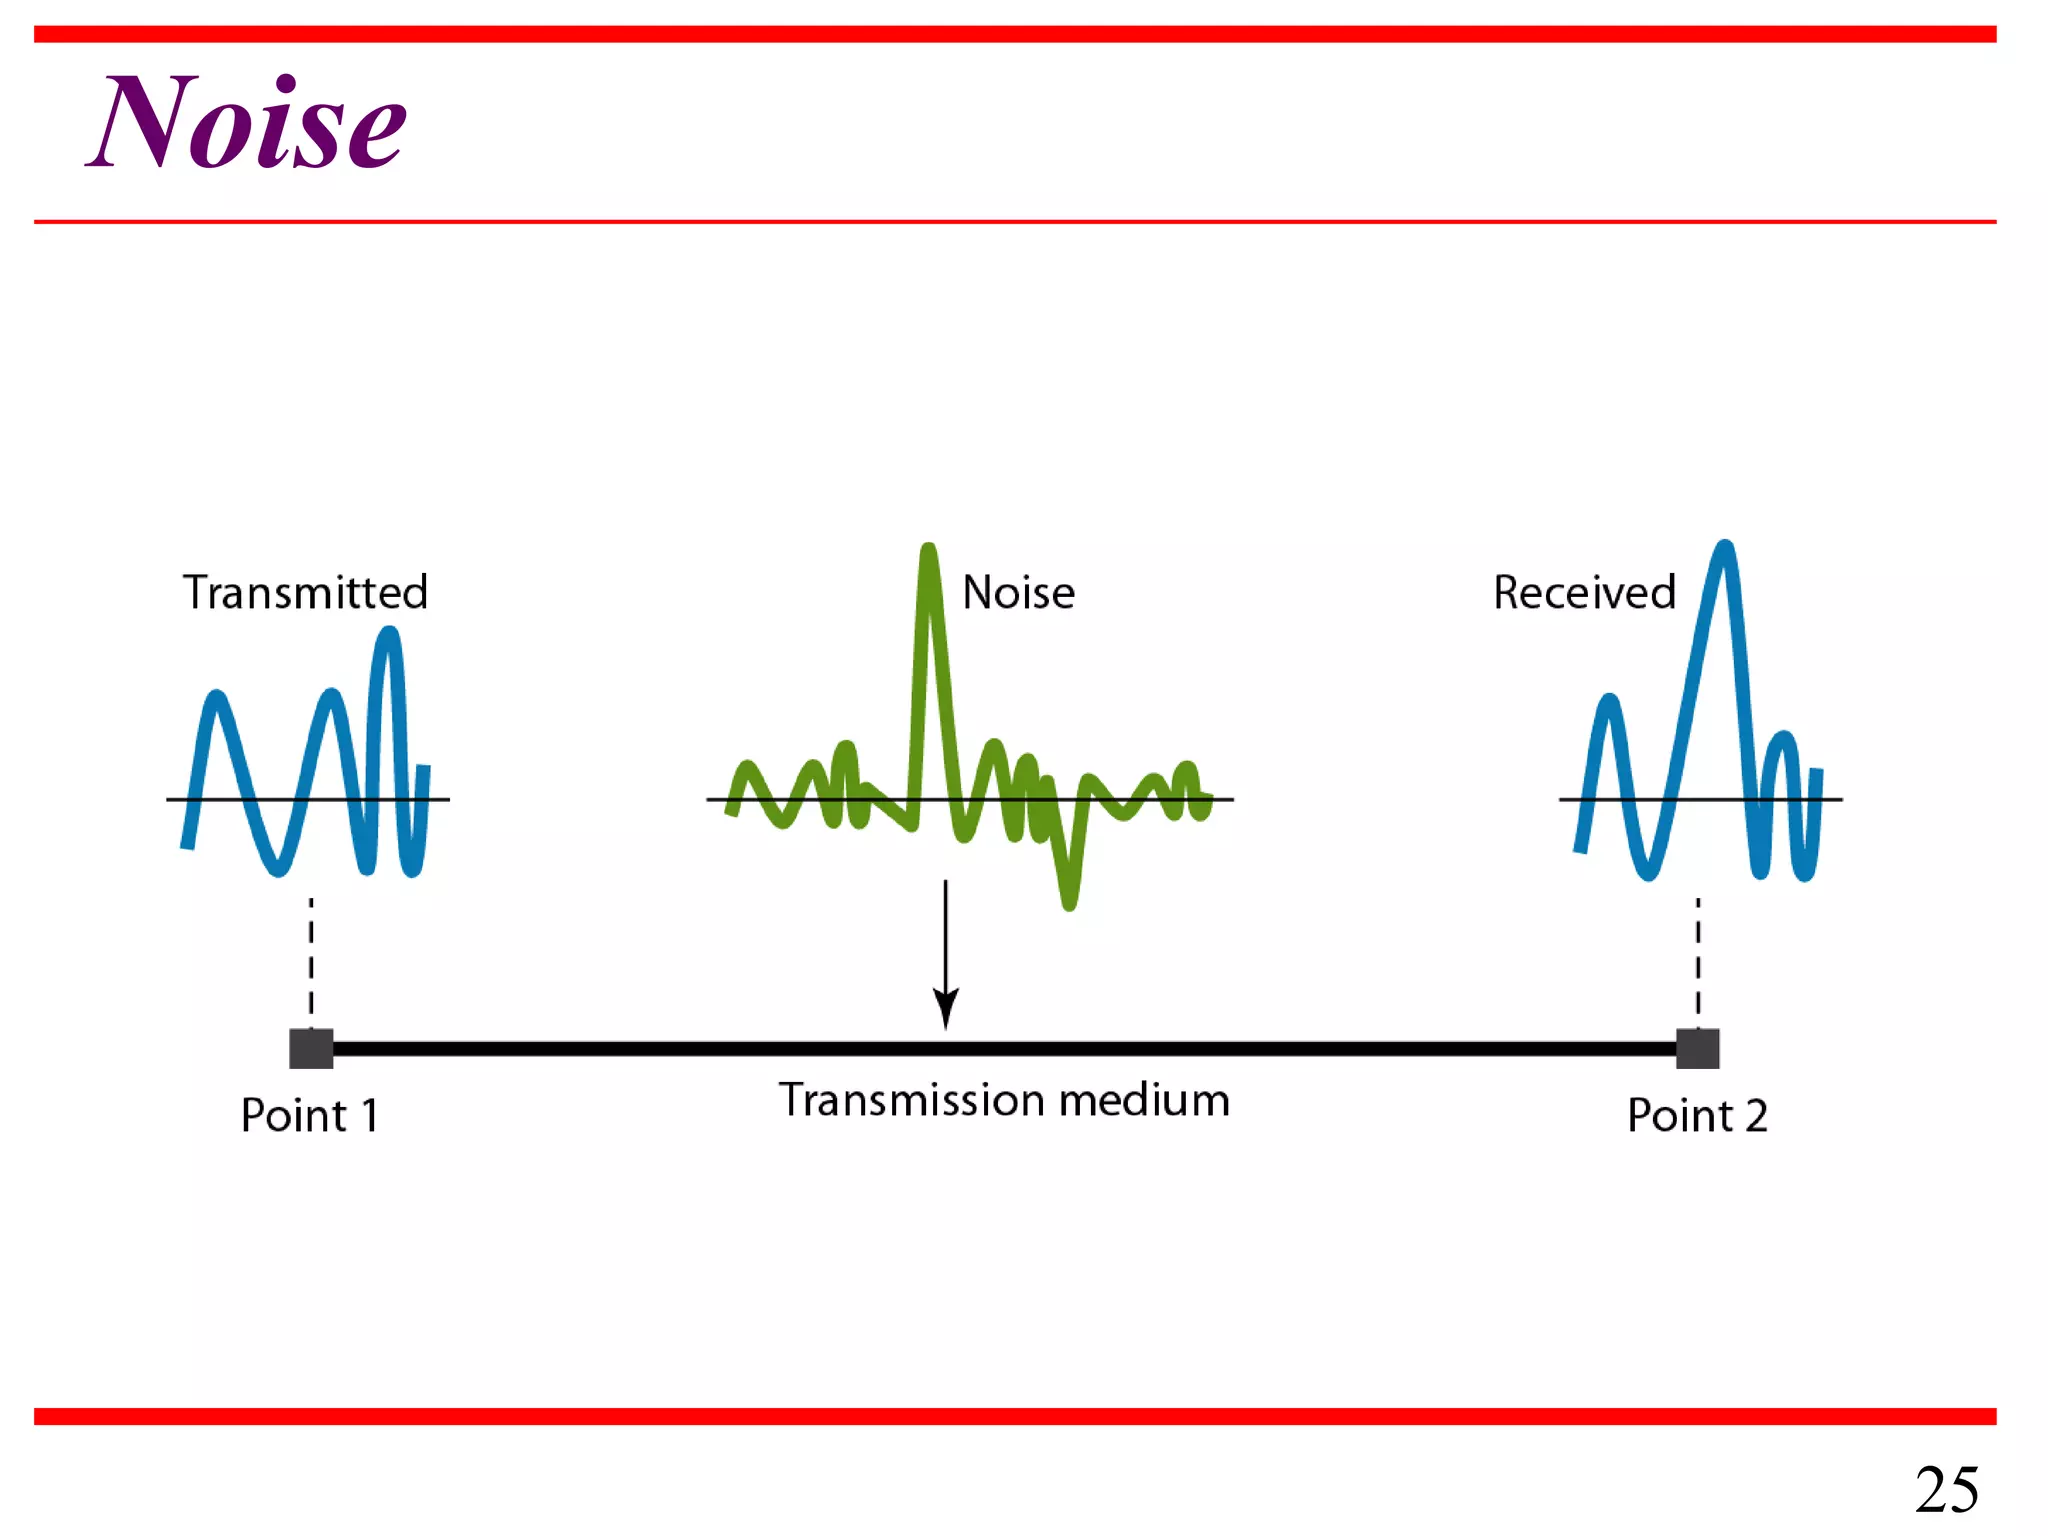
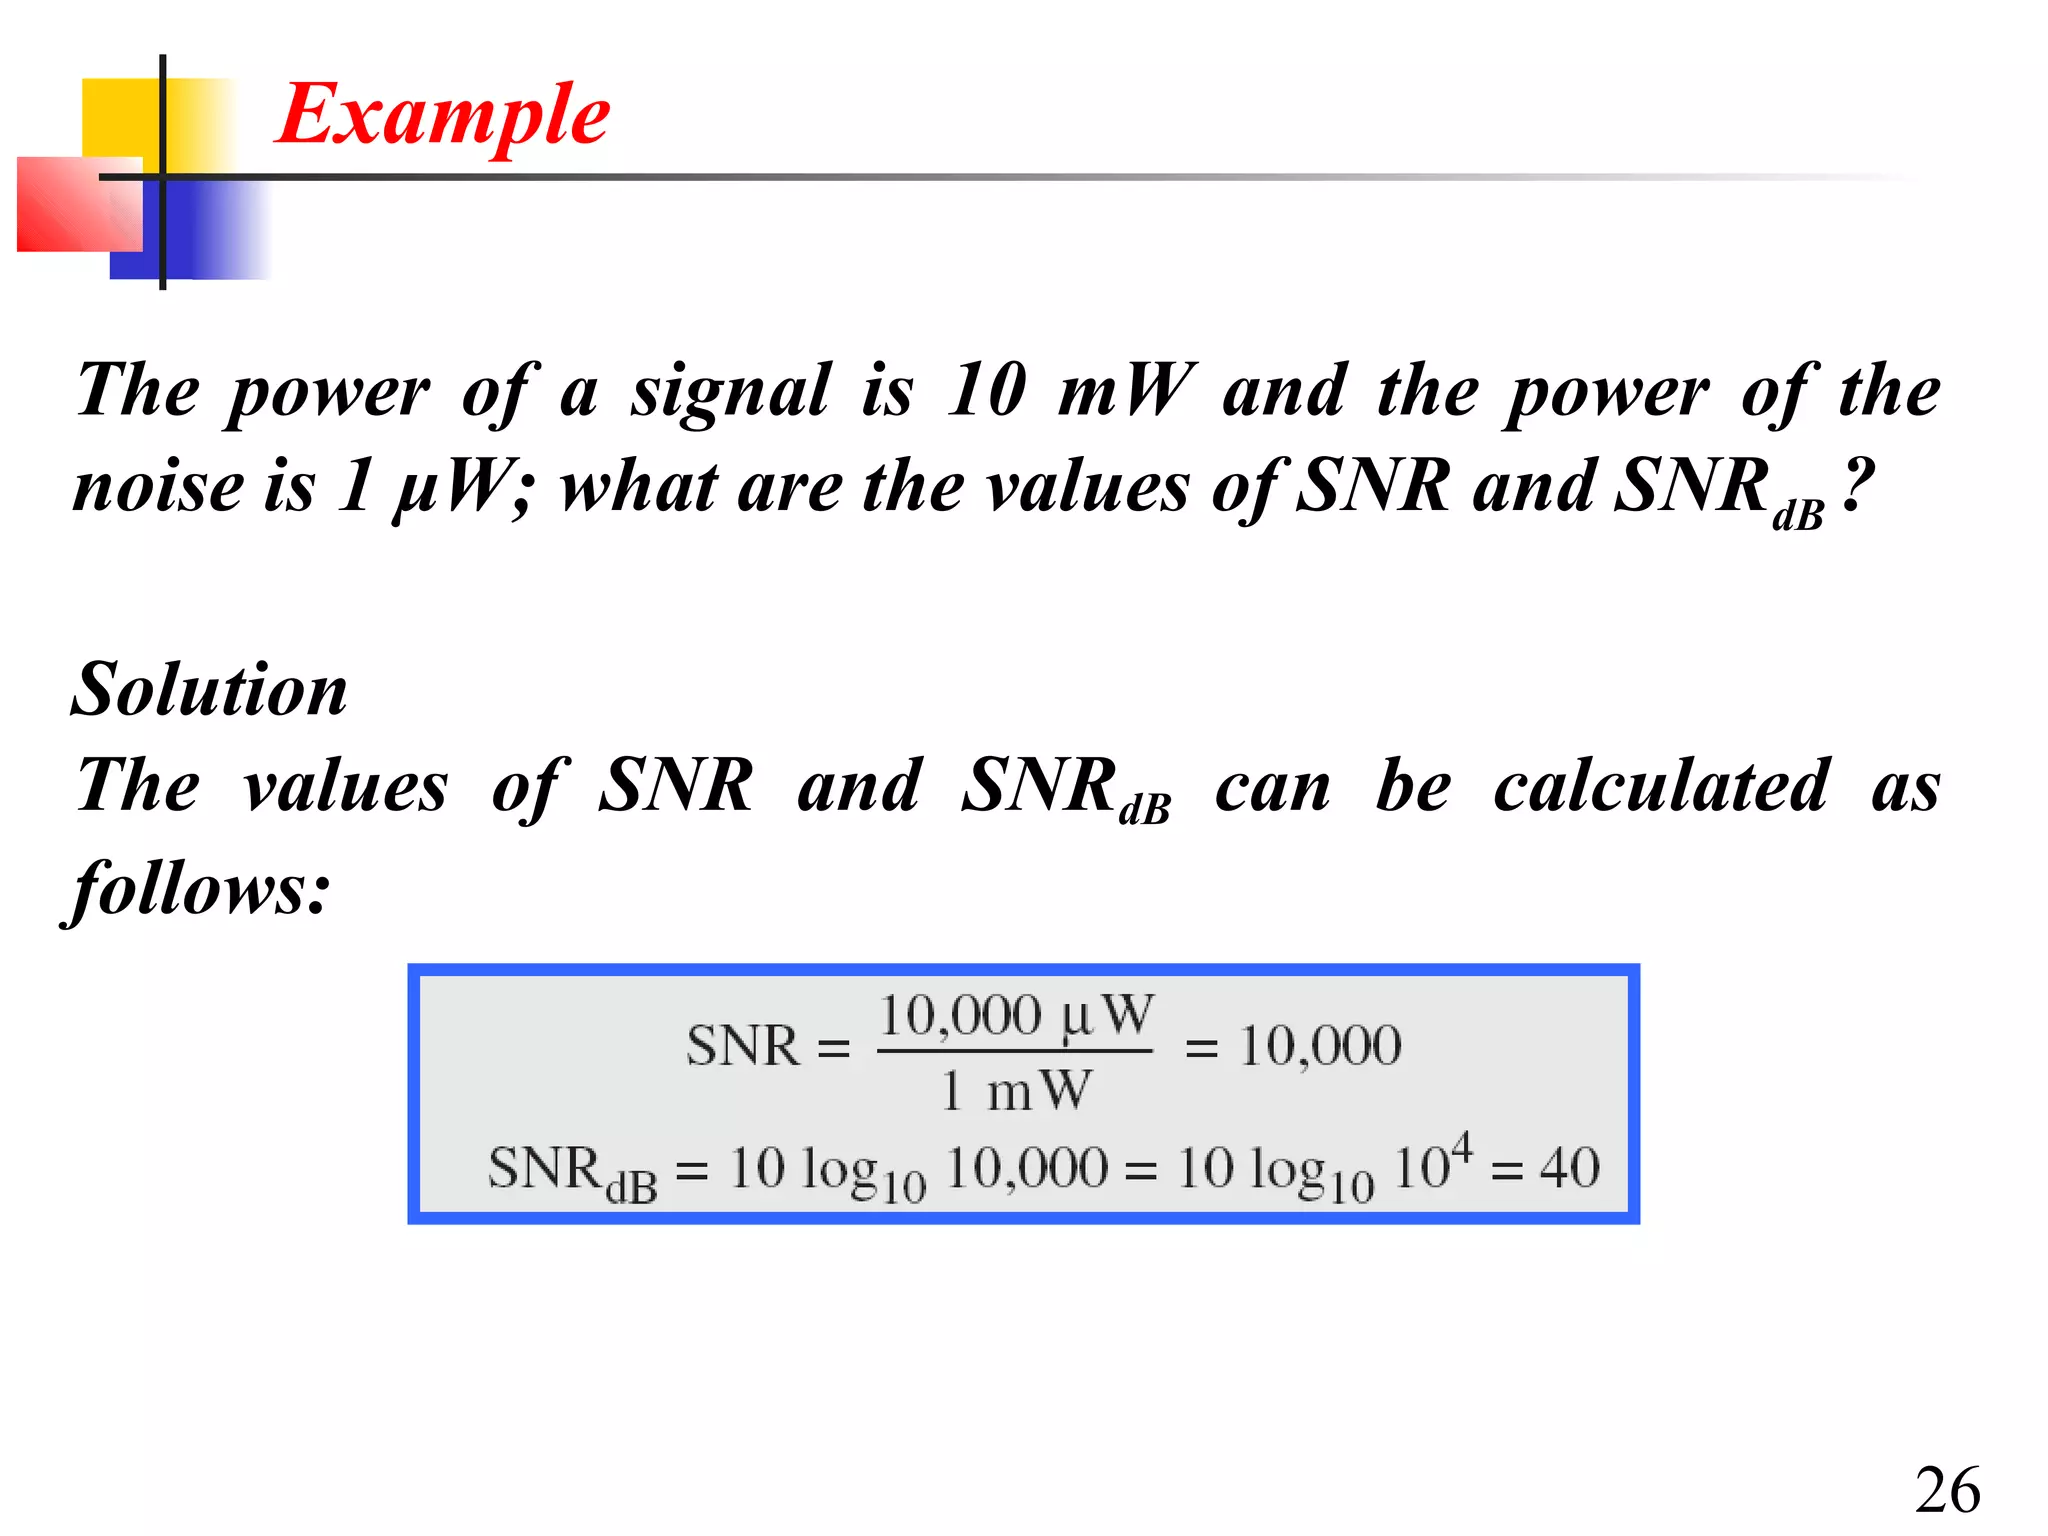
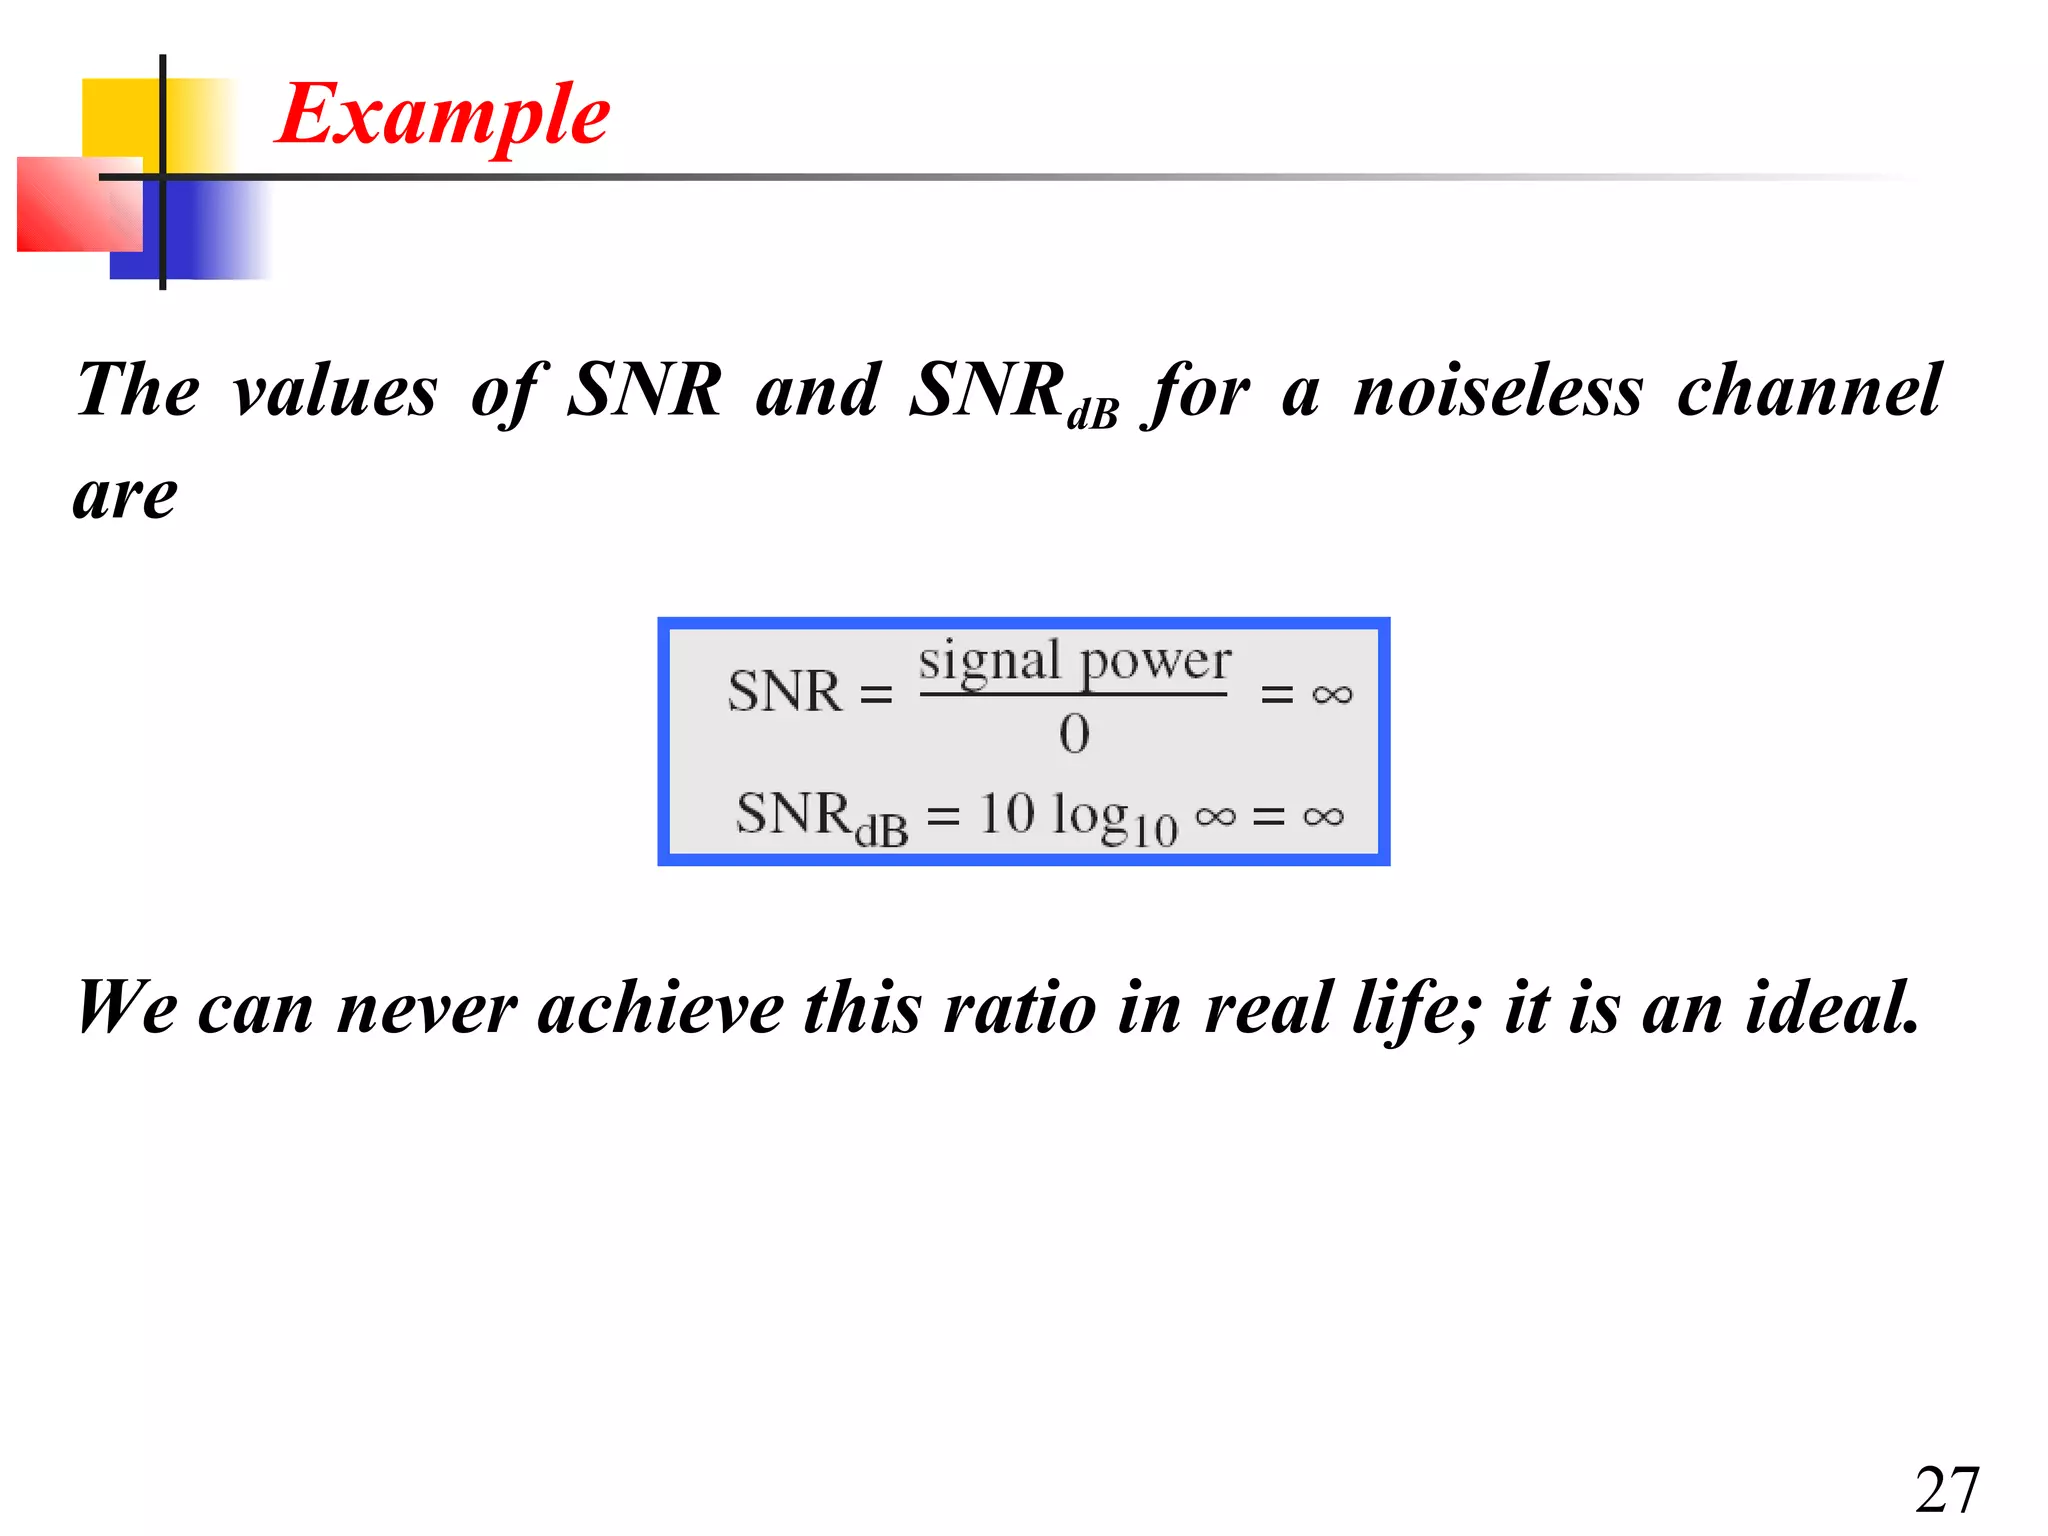

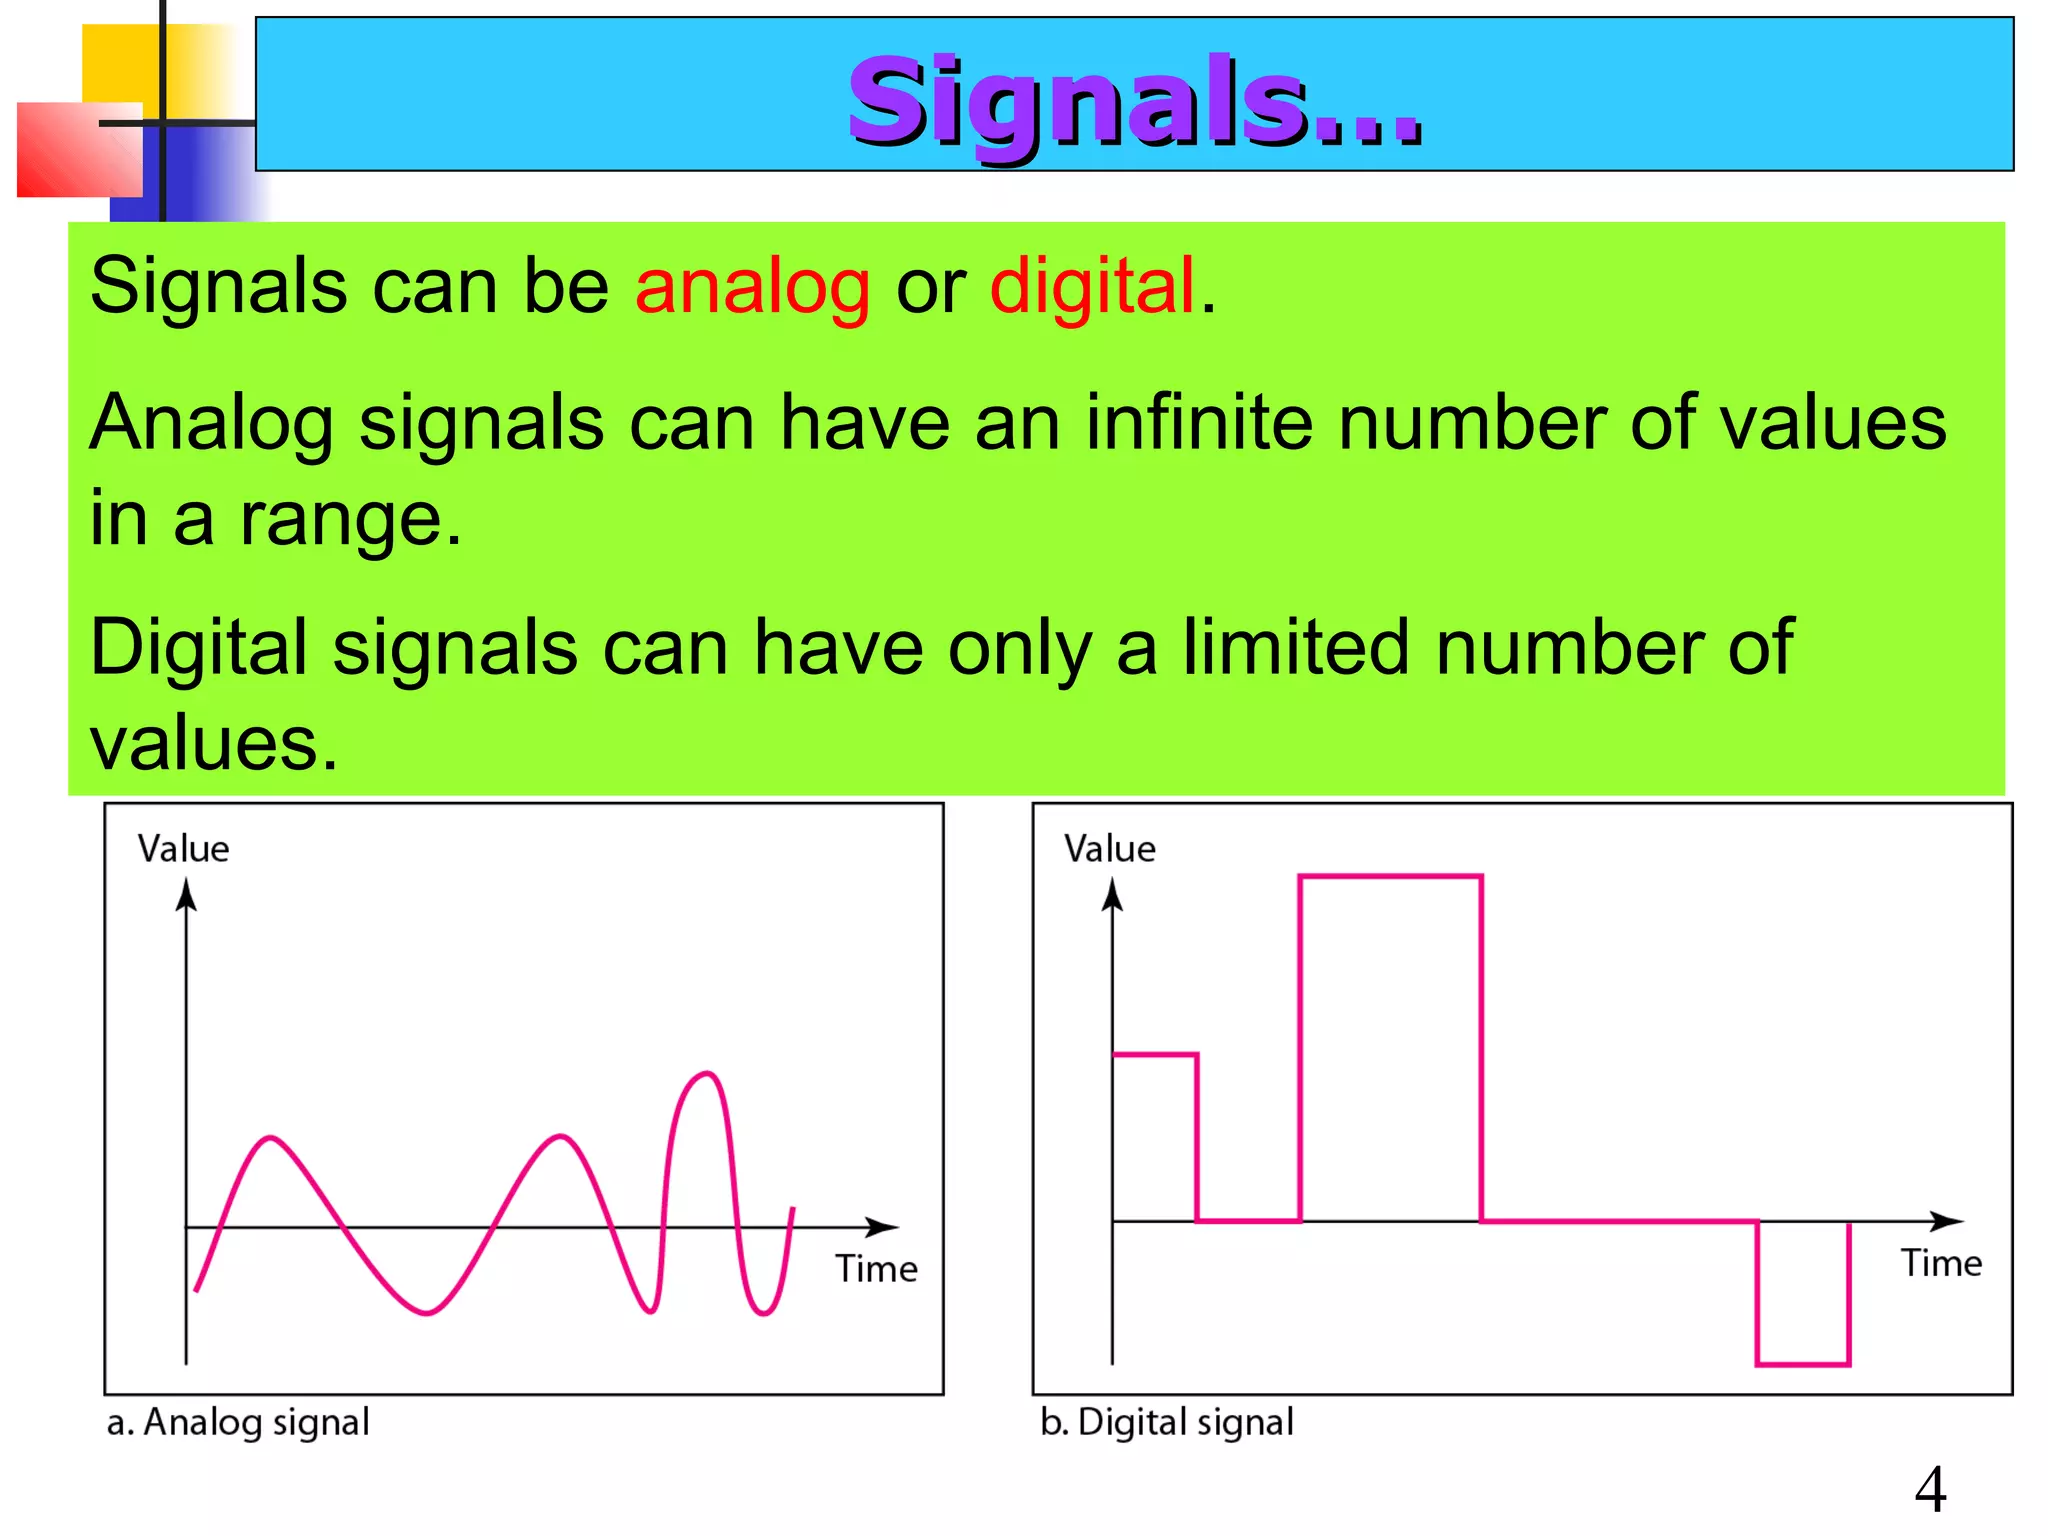
This document discusses data and signals used in data communication. It defines analog and digital data, as well as continuous and discrete signals. Signals can be transformed into electromagnetic waves for transmission. Both signals and data can be either analog or digital. The key properties of signals, including amplitude, period, frequency, phase, and wavelength are described. The document also discusses how signals can be impaired by attenuation, distortion, and noise during transmission. The Nyquist sampling theorem and Shannon capacity theorem place important limits on maximum data transmission rates based on bandwidth and signal-to-noise ratio. Examples are provided to illustrate how to calculate transmission rates, signal levels, amplification, and bandwidth.