3.1
Chapter 3
Data and Signals
3.2
DATA
DATA
Data can be
Data can be Analog
Analog or
or Digital
Digital.
.
The term
The term Analog data
Analog data refers to information that is
refers to information that is
continuous;
continuous;
Digital data
Digital data refers to information that has discrete
refers to information that has discrete
states.
states.
Analog data take continuous values. Digital data take
discrete values.
discrete values.
3.3
To be transmitted, data must be transformed
to electromagnetic signals.
Signals
Signals
A signal is defined as any physical quantity that varies
with time, space or any other independent variables.
By a signal we mean any variable that carries some
information.
Continous signal: x(t)
Discrete signal (sequence): x[n]
3.4
Signals can be analog or digital.
Analog signals can have an infinite
number of values in a range; digital
signals can have only a limited
number of values.
Note
3.5
Figure: Comparison of analog and digital signals
3.6
In data communications, we commonly
use periodic analog signals and
nonperiodic digital signals.
Note
3.7
PERIODIC ANALOG SIGNALS
Periodic analog signals can be classified as
Periodic analog signals can be classified as simple
simple or
or
composite
composite. A simple periodic analog signal, a
. A simple periodic analog signal, a sine wave
sine wave,
,
cannot be decomposed into simpler signals. A composite
periodic analog signal is composed of multiple sine
waves.
waves.
Sine Wave
Wavelength
Time and Frequency Domain
Composite Signals
Bandwidth
Topics discussed in this section:
3.8
Figure A sine wave
x(t) = A sin(2Πft+Φ)
3.9
Properties of a Signal
 Peak Amplitude (A) – the highest value/intensity of
the signal.
 Period (T) – the amount of time (in sec) needed by
a signal to complete one cycle.
 Frequency (f) – number of cycles (periods) per sec.
f=1/T
 Phase (Φ) – position of a signal relative to time
zero.
 Wavelength(λ) – the distance traveled by a wave
(signal) in one cycle.
λ = 1/f
3.10
Frequency and period are the inverse of
each other.
Note
3.11
The power we use at home has a frequency of 60 Hz.
The period of this sine wave can be determined as
follows:
Example 3.3
3.12
Frequency is the rate of change with
respect to time.
Change in a short span of time
means high frequency.
Change over a long span of
time means low frequency.
Note
3.13
If a signal does not change at all, its
frequency is zero.
If a signal changes instantaneously, its
frequency is infinite.
Note
3.14
Phase describes the position of the
waveform relative to time zero.
Note
3.15
Figure Two signals with the same phase and frequency,
but different amplitudes
3.16
Figure Three sine waves with the same amplitude and frequency,
but different phases
3.17
A sine wave is offset 1/6 cycle with respect to time 0.
What is its phase in degrees and radians?
Example
Solution
We know that 1 complete cycle is 360°. Therefore, 1/6
cycle is
3.18
Figure Wavelength and period
3.19
Figure The time-domain and frequency-domain plots of a sine wave
3.20
A complete sine wave in the time
domain can be represented by one
single spike in the frequency domain.
Note
3.21
The frequency domain is more compact and
useful when we are dealing with more than one
sine wave. For example, Figure 3.8 shows three
sine waves, each with different amplitude and
frequency. All can be represented by three
spikes in the frequency domain.
Example
3.22
Figure 3.8 The time domain and frequency domain of three sine waves
3.23
A single-frequency sine wave is not
useful in data communications;
we need to send a composite signal, a
signal made of many simple sine waves.
Note
3.24
According to Fourier analysis, any
composite signal is a combination of
simple sine waves with different
frequencies, amplitudes, and phases.
Note
3.25
If the composite signal is periodic, the
decomposition gives a series of signals
with discrete frequencies;
if the composite signal is nonperiodic,
the decomposition gives a combination
of sine waves with continuous
frequencies.
Note
3.26
Figure 3.9 shows a periodic composite signal with
frequency f. This type of signal is not typical of those
found in data communications. We can consider it to be
three alarm systems, each with a different frequency.
The analysis of this signal can give us a good
understanding of how to decompose signals.
Example 3.8
3.27
Figure 3.9 A composite periodic signal
3.28
Figure 3.10 Decomposition of a composite periodic signal in the time and
frequency domains
3.29
Figure 3.11 shows a nonperiodic composite signal. It
can be the signal created by a microphone or a telephone
set when a word or two is pronounced. In this case, the
composite signal cannot be periodic, because that
implies that we are repeating the same word or words
with exactly the same tone.
Example 3.9
3.30
Figure 3.11 The time and frequency domains of a nonperiodic signal
3.31
The bandwidth of a composite signal is
the difference between the
highest and the lowest frequencies
contained in that signal.
Note
3.32
Figure 3.12 The bandwidth of periodic and nonperiodic composite signals
3.33
If a periodic signal is decomposed into five sine waves
with frequencies of 100, 300, 500, 700, and 900 Hz, what
is its bandwidth? Draw the spectrum, assuming all
components have a maximum amplitude of 10 V.
Solution
Let fh be the highest frequency, fl the lowest frequency,
and B the bandwidth. Then
Example 3.10
The spectrum has only five spikes, at 100, 300, 500, 700,
and 900 Hz (see Figure 3.13).
3.34
Figure 3.13 The bandwidth for Example 3.10
3.35
A periodic signal has a bandwidth of 20 Hz. The highest
frequency is 60 Hz. What is the lowest frequency? Draw
the spectrum if the signal contains all frequencies of the
same amplitude.
Solution
Let fh be the highest frequency, fl the lowest frequency,
and B the bandwidth. Then
Example 3.11
The spectrum contains all integer frequencies. We show
this by a series of spikes (see Figure 3.14).
3.36
Figure 3.14 The bandwidth for Example 3.11
3.37
A nonperiodic composite signal has a bandwidth of 200
kHz, with a middle frequency of 140 kHz and peak
amplitude of 20 V. The two extreme frequencies have an
amplitude of 0. Draw the frequency domain of the
signal.
Solution
The lowest frequency must be at 40 kHz and the highest
at 240 kHz. Figure 3.15 shows the frequency domain
and the bandwidth.
Example 3.12
3.38
Figure 3.15 The bandwidth for Example 3.12
3.39
A digital signal is a composite analog
signal with an infinite bandwidth.
Note
3.40
TRANSMISSION IMPAIRMENT
Signals travel through transmission media, which are not
perfect. The imperfection causes signal impairment. This
means that the signal at the beginning of the medium is
not the same as the signal at the end of the medium.
What is sent is not what is received. Three causes of
impairment are
impairment are attenuation
attenuation,
, distortion
distortion, and
, and noise
noise.
.
Attenuation
Distortion
Noise
Topics discussed in this section:
3.41
Figure 3.25 Causes of impairment
3.42
Figure 3.26 Attenuation
3.43
Suppose a signal travels through a transmission medium
and its power is reduced to one-half. This means that P2
is (1/2)P1. In this case, the attenuation (loss of power)
can be calculated as
Example 3.26
A loss of 3 dB (–3 dB) is equivalent to losing one-half
the power.
3.44
A signal travels through an amplifier, and its power is
increased 10 times. This means that P2 = 10P1 . In this
case, the amplification (gain of power) can be calculated
as
Example 3.27
3.45
Figure 3.28 Distortion
3.46
Figure 3.29 Noise
3.47
The power of a signal is 10 mW and the power of the
noise is 1 μW; what are the values of SNR and SNRdB ?
Solution
The values of SNR and SNRdB can be calculated as
follows:
Example 3.31
3.48
The values of SNR and SNRdB for a noiseless channel
are
Example 3.32
We can never achieve this ratio in real life; it is an ideal.
3.49
Figure 3.30 Two cases of SNR: a high SNR and a low SNR
3.50
3-5 DATA RATE LIMITS
A very important consideration in data communications
is how fast we can send data, in bits per second, over a
channel. Data rate depends on three factors:
1.
1. The bandwidth available
The bandwidth available
2.
2. The level of the signals we use
The level of the signals we use
3
3. The quality of the channel (the level of noise)
. The quality of the channel (the level of noise)
Noiseless Channel: Nyquist Bit Rate
Noisy Channel: Shannon Capacity
Using Both Limits
Topics discussed in this section:
3.51
Increasing the levels of a signal may
reduce the reliability of the system.
Note
3.52
Bit rate = 2X BX log2L
Where B is the bandwidth, L is the number of signal levels used to
represent data
Noiseless Channel and Nyquist theorem
3.53
Consider a noiseless channel with a bandwidth of 3000
Hz transmitting a signal with two signal levels. The
maximum bit rate can be calculated as
Example 3.34
3.54
Consider the same noiseless channel transmitting a
signal with four signal levels (for each level, we send 2
bits). The maximum bit rate can be calculated as
Example 3.35
3.55
We need to send 265 kbps over a noiseless channel with
a bandwidth of 20 kHz. How many signal levels do we
need?
Solution
We can use the Nyquist formula as shown:
Example 3.36
Since this result is not a power of 2, we need to either
increase the number of levels or reduce the bit rate. If we
have 128 levels, the bit rate is 280 kbps. If we have 64
levels, the bit rate is 240 kbps.
3.56
Consider an extremely noisy channel in which the value of the signal-
to-noise ratio is almost zero.
For noisy channel the capacity C (highest data rate) is
calculated as:
This means that the capacity of this channel is zero regardless of
the bandwidth. In other words, we cannot receive any data
through this channel.
Noisy Channel and Shannon Capacity
3.57
We can calculate the theoretical highest bit rate of a
regular telephone line. A telephone line normally has a
bandwidth of 3000. The signal-to-noise ratio is usually
3162. For this channel the capacity is calculated as
Example 3.38
This means that the highest bit rate for a telephone line
is 34.860 kbps. If we want to send data faster than this,
we can either increase the bandwidth of the line or
improve the signal-to-noise ratio.
3.58
The signal-to-noise ratio is often given in decibels.
Assume that SNRdB = 36 and the channel bandwidth is 2
MHz. The theoretical channel capacity can be calculated
as
Example 3.39
3.59
For practical purposes, when the SNR is very high, we
can assume that SNR + 1 is almost the same as SNR. In
these cases, the theoretical channel capacity can be
simplified to
Example 3.40
For example, we can calculate the theoretical capacity of
the previous example as
3.60
We have a channel with a 1-MHz bandwidth. The SNR
for this channel is 63. What are the appropriate bit rate
and signal level?
Solution
First, we use the Shannon formula to find the upper
limit.
Example 3.41
3.61
The Shannon formula gives us 6 Mbps, the upper limit.
For better performance we choose something lower, 4
Mbps, for example. Then we use the Nyquist formula to
find the number of signal levels.
Example 3.41 (continued)
3.62
The Shannon capacity gives us the
upper limit; the Nyquist formula tells us
how many signal levels we need.
Note

3. Data and Signals.ppt Data Communication slide

  • 1.
  • 2.
    3.2 DATA DATA Data can be Datacan be Analog Analog or or Digital Digital. . The term The term Analog data Analog data refers to information that is refers to information that is continuous; continuous; Digital data Digital data refers to information that has discrete refers to information that has discrete states. states. Analog data take continuous values. Digital data take Analog data take continuous values. Digital data take discrete values. discrete values.
  • 3.
    3.3 To be transmitted,data must be transformed to electromagnetic signals. Signals Signals A signal is defined as any physical quantity that varies with time, space or any other independent variables. By a signal we mean any variable that carries some information. Continous signal: x(t) Discrete signal (sequence): x[n]
  • 4.
    3.4 Signals can beanalog or digital. Analog signals can have an infinite number of values in a range; digital signals can have only a limited number of values. Note
  • 5.
    3.5 Figure: Comparison ofanalog and digital signals
  • 6.
    3.6 In data communications,we commonly use periodic analog signals and nonperiodic digital signals. Note
  • 7.
    3.7 PERIODIC ANALOG SIGNALS PERIODICANALOG SIGNALS Periodic analog signals can be classified as Periodic analog signals can be classified as simple simple or or composite composite. A simple periodic analog signal, a . A simple periodic analog signal, a sine wave sine wave, , cannot be decomposed into simpler signals. A composite cannot be decomposed into simpler signals. A composite periodic analog signal is composed of multiple sine periodic analog signal is composed of multiple sine waves. waves. Sine Wave Wavelength Time and Frequency Domain Composite Signals Bandwidth Topics discussed in this section: Topics discussed in this section:
  • 8.
    3.8 Figure A sinewave x(t) = A sin(2Πft+Φ)
  • 9.
    3.9 Properties of aSignal  Peak Amplitude (A) – the highest value/intensity of the signal.  Period (T) – the amount of time (in sec) needed by a signal to complete one cycle.  Frequency (f) – number of cycles (periods) per sec. f=1/T  Phase (Φ) – position of a signal relative to time zero.  Wavelength(λ) – the distance traveled by a wave (signal) in one cycle. λ = 1/f
  • 10.
    3.10 Frequency and periodare the inverse of each other. Note
  • 11.
    3.11 The power weuse at home has a frequency of 60 Hz. The period of this sine wave can be determined as follows: Example 3.3
  • 12.
    3.12 Frequency is therate of change with respect to time. Change in a short span of time means high frequency. Change over a long span of time means low frequency. Note
  • 13.
    3.13 If a signaldoes not change at all, its frequency is zero. If a signal changes instantaneously, its frequency is infinite. Note
  • 14.
    3.14 Phase describes theposition of the waveform relative to time zero. Note
  • 15.
    3.15 Figure Two signalswith the same phase and frequency, but different amplitudes
  • 16.
    3.16 Figure Three sinewaves with the same amplitude and frequency, but different phases
  • 17.
    3.17 A sine waveis offset 1/6 cycle with respect to time 0. What is its phase in degrees and radians? Example Solution We know that 1 complete cycle is 360°. Therefore, 1/6 cycle is
  • 18.
  • 19.
    3.19 Figure The time-domainand frequency-domain plots of a sine wave
  • 20.
    3.20 A complete sinewave in the time domain can be represented by one single spike in the frequency domain. Note
  • 21.
    3.21 The frequency domainis more compact and useful when we are dealing with more than one sine wave. For example, Figure 3.8 shows three sine waves, each with different amplitude and frequency. All can be represented by three spikes in the frequency domain. Example
  • 22.
    3.22 Figure 3.8 Thetime domain and frequency domain of three sine waves
  • 23.
    3.23 A single-frequency sinewave is not useful in data communications; we need to send a composite signal, a signal made of many simple sine waves. Note
  • 24.
    3.24 According to Fourieranalysis, any composite signal is a combination of simple sine waves with different frequencies, amplitudes, and phases. Note
  • 25.
    3.25 If the compositesignal is periodic, the decomposition gives a series of signals with discrete frequencies; if the composite signal is nonperiodic, the decomposition gives a combination of sine waves with continuous frequencies. Note
  • 26.
    3.26 Figure 3.9 showsa periodic composite signal with frequency f. This type of signal is not typical of those found in data communications. We can consider it to be three alarm systems, each with a different frequency. The analysis of this signal can give us a good understanding of how to decompose signals. Example 3.8
  • 27.
    3.27 Figure 3.9 Acomposite periodic signal
  • 28.
    3.28 Figure 3.10 Decompositionof a composite periodic signal in the time and frequency domains
  • 29.
    3.29 Figure 3.11 showsa nonperiodic composite signal. It can be the signal created by a microphone or a telephone set when a word or two is pronounced. In this case, the composite signal cannot be periodic, because that implies that we are repeating the same word or words with exactly the same tone. Example 3.9
  • 30.
    3.30 Figure 3.11 Thetime and frequency domains of a nonperiodic signal
  • 31.
    3.31 The bandwidth ofa composite signal is the difference between the highest and the lowest frequencies contained in that signal. Note
  • 32.
    3.32 Figure 3.12 Thebandwidth of periodic and nonperiodic composite signals
  • 33.
    3.33 If a periodicsignal is decomposed into five sine waves with frequencies of 100, 300, 500, 700, and 900 Hz, what is its bandwidth? Draw the spectrum, assuming all components have a maximum amplitude of 10 V. Solution Let fh be the highest frequency, fl the lowest frequency, and B the bandwidth. Then Example 3.10 The spectrum has only five spikes, at 100, 300, 500, 700, and 900 Hz (see Figure 3.13).
  • 34.
    3.34 Figure 3.13 Thebandwidth for Example 3.10
  • 35.
    3.35 
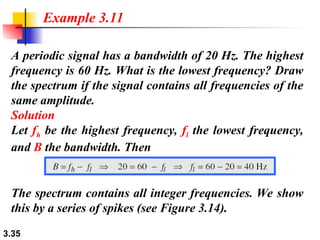
A periodic signalhas a bandwidth of 20 Hz. The highest frequency is 60 Hz. What is the lowest frequency? Draw the spectrum if the signal contains all frequencies of the same amplitude. Solution Let fh be the highest frequency, fl the lowest frequency, and B the bandwidth. Then Example 3.11 The spectrum contains all integer frequencies. We show this by a series of spikes (see Figure 3.14).
  • 36.
    3.36 Figure 3.14 Thebandwidth for Example 3.11
  • 37.
    3.37 A nonperiodic compositesignal has a bandwidth of 200 kHz, with a middle frequency of 140 kHz and peak amplitude of 20 V. The two extreme frequencies have an amplitude of 0. Draw the frequency domain of the signal. Solution The lowest frequency must be at 40 kHz and the highest at 240 kHz. Figure 3.15 shows the frequency domain and the bandwidth. Example 3.12
  • 38.
    3.38 Figure 3.15 Thebandwidth for Example 3.12
  • 39.
    3.39 A digital signalis a composite analog signal with an infinite bandwidth. Note
  • 40.
    3.40 TRANSMISSION IMPAIRMENT TRANSMISSION IMPAIRMENT Signalstravel through transmission media, which are not Signals travel through transmission media, which are not perfect. The imperfection causes signal impairment. This perfect. The imperfection causes signal impairment. This means that the signal at the beginning of the medium is means that the signal at the beginning of the medium is not the same as the signal at the end of the medium. not the same as the signal at the end of the medium. What is sent is not what is received. Three causes of What is sent is not what is received. Three causes of impairment are impairment are attenuation attenuation, , distortion distortion, and , and noise noise. . Attenuation Distortion Noise Topics discussed in this section: Topics discussed in this section:
  • 41.
  • 42.
  • 43.
    3.43 Suppose a signaltravels through a transmission medium and its power is reduced to one-half. This means that P2 is (1/2)P1. In this case, the attenuation (loss of power) can be calculated as Example 3.26 A loss of 3 dB (–3 dB) is equivalent to losing one-half the power.
  • 44.
    3.44 A signal travelsthrough an amplifier, and its power is increased 10 times. This means that P2 = 10P1 . In this case, the amplification (gain of power) can be calculated as Example 3.27
  • 45.
  • 46.
  • 47.
    3.47 The power ofa signal is 10 mW and the power of the noise is 1 μW; what are the values of SNR and SNRdB ? Solution The values of SNR and SNRdB can be calculated as follows: Example 3.31
  • 48.
    3.48 The values ofSNR and SNRdB for a noiseless channel are Example 3.32 We can never achieve this ratio in real life; it is an ideal.
  • 49.
    3.49 Figure 3.30 Twocases of SNR: a high SNR and a low SNR
  • 50.
    3.50 3-5 DATA RATELIMITS 3-5 DATA RATE LIMITS A very important consideration in data communications A very important consideration in data communications is how fast we can send data, in bits per second, over a is how fast we can send data, in bits per second, over a channel. Data rate depends on three factors: channel. Data rate depends on three factors: 1. 1. The bandwidth available The bandwidth available 2. 2. The level of the signals we use The level of the signals we use 3 3. The quality of the channel (the level of noise) . The quality of the channel (the level of noise) Noiseless Channel: Nyquist Bit Rate Noisy Channel: Shannon Capacity Using Both Limits Topics discussed in this section: Topics discussed in this section:
  • 51.
    3.51 Increasing the levelsof a signal may reduce the reliability of the system. Note
  • 52.
    3.52 Bit rate =2X BX log2L Where B is the bandwidth, L is the number of signal levels used to represent data Noiseless Channel and Nyquist theorem
  • 53.
    3.53 Consider a noiselesschannel with a bandwidth of 3000 Hz transmitting a signal with two signal levels. The maximum bit rate can be calculated as Example 3.34
  • 54.
    3.54 Consider the samenoiseless channel transmitting a signal with four signal levels (for each level, we send 2 bits). The maximum bit rate can be calculated as Example 3.35
  • 55.
    3.55 We need tosend 265 kbps over a noiseless channel with a bandwidth of 20 kHz. How many signal levels do we need? Solution We can use the Nyquist formula as shown: Example 3.36 Since this result is not a power of 2, we need to either increase the number of levels or reduce the bit rate. If we have 128 levels, the bit rate is 280 kbps. If we have 64 levels, the bit rate is 240 kbps.
  • 56.
    3.56 Consider an extremelynoisy channel in which the value of the signal- to-noise ratio is almost zero. For noisy channel the capacity C (highest data rate) is calculated as: This means that the capacity of this channel is zero regardless of the bandwidth. In other words, we cannot receive any data through this channel. Noisy Channel and Shannon Capacity
  • 57.
    3.57 We can calculatethe theoretical highest bit rate of a regular telephone line. A telephone line normally has a bandwidth of 3000. The signal-to-noise ratio is usually 3162. For this channel the capacity is calculated as Example 3.38 This means that the highest bit rate for a telephone line is 34.860 kbps. If we want to send data faster than this, we can either increase the bandwidth of the line or improve the signal-to-noise ratio.
  • 58.
    3.58 The signal-to-noise ratiois often given in decibels. Assume that SNRdB = 36 and the channel bandwidth is 2 MHz. The theoretical channel capacity can be calculated as Example 3.39
  • 59.
    3.59 For practical purposes,when the SNR is very high, we can assume that SNR + 1 is almost the same as SNR. In these cases, the theoretical channel capacity can be simplified to Example 3.40 For example, we can calculate the theoretical capacity of the previous example as
  • 60.
    3.60 We have achannel with a 1-MHz bandwidth. The SNR for this channel is 63. What are the appropriate bit rate and signal level? Solution First, we use the Shannon formula to find the upper limit. Example 3.41
  • 61.
    3.61 The Shannon formulagives us 6 Mbps, the upper limit. For better performance we choose something lower, 4 Mbps, for example. Then we use the Nyquist formula to find the number of signal levels. Example 3.41 (continued)
  • 62.
    3.62 The Shannon capacitygives us the upper limit; the Nyquist formula tells us how many signal levels we need. Note