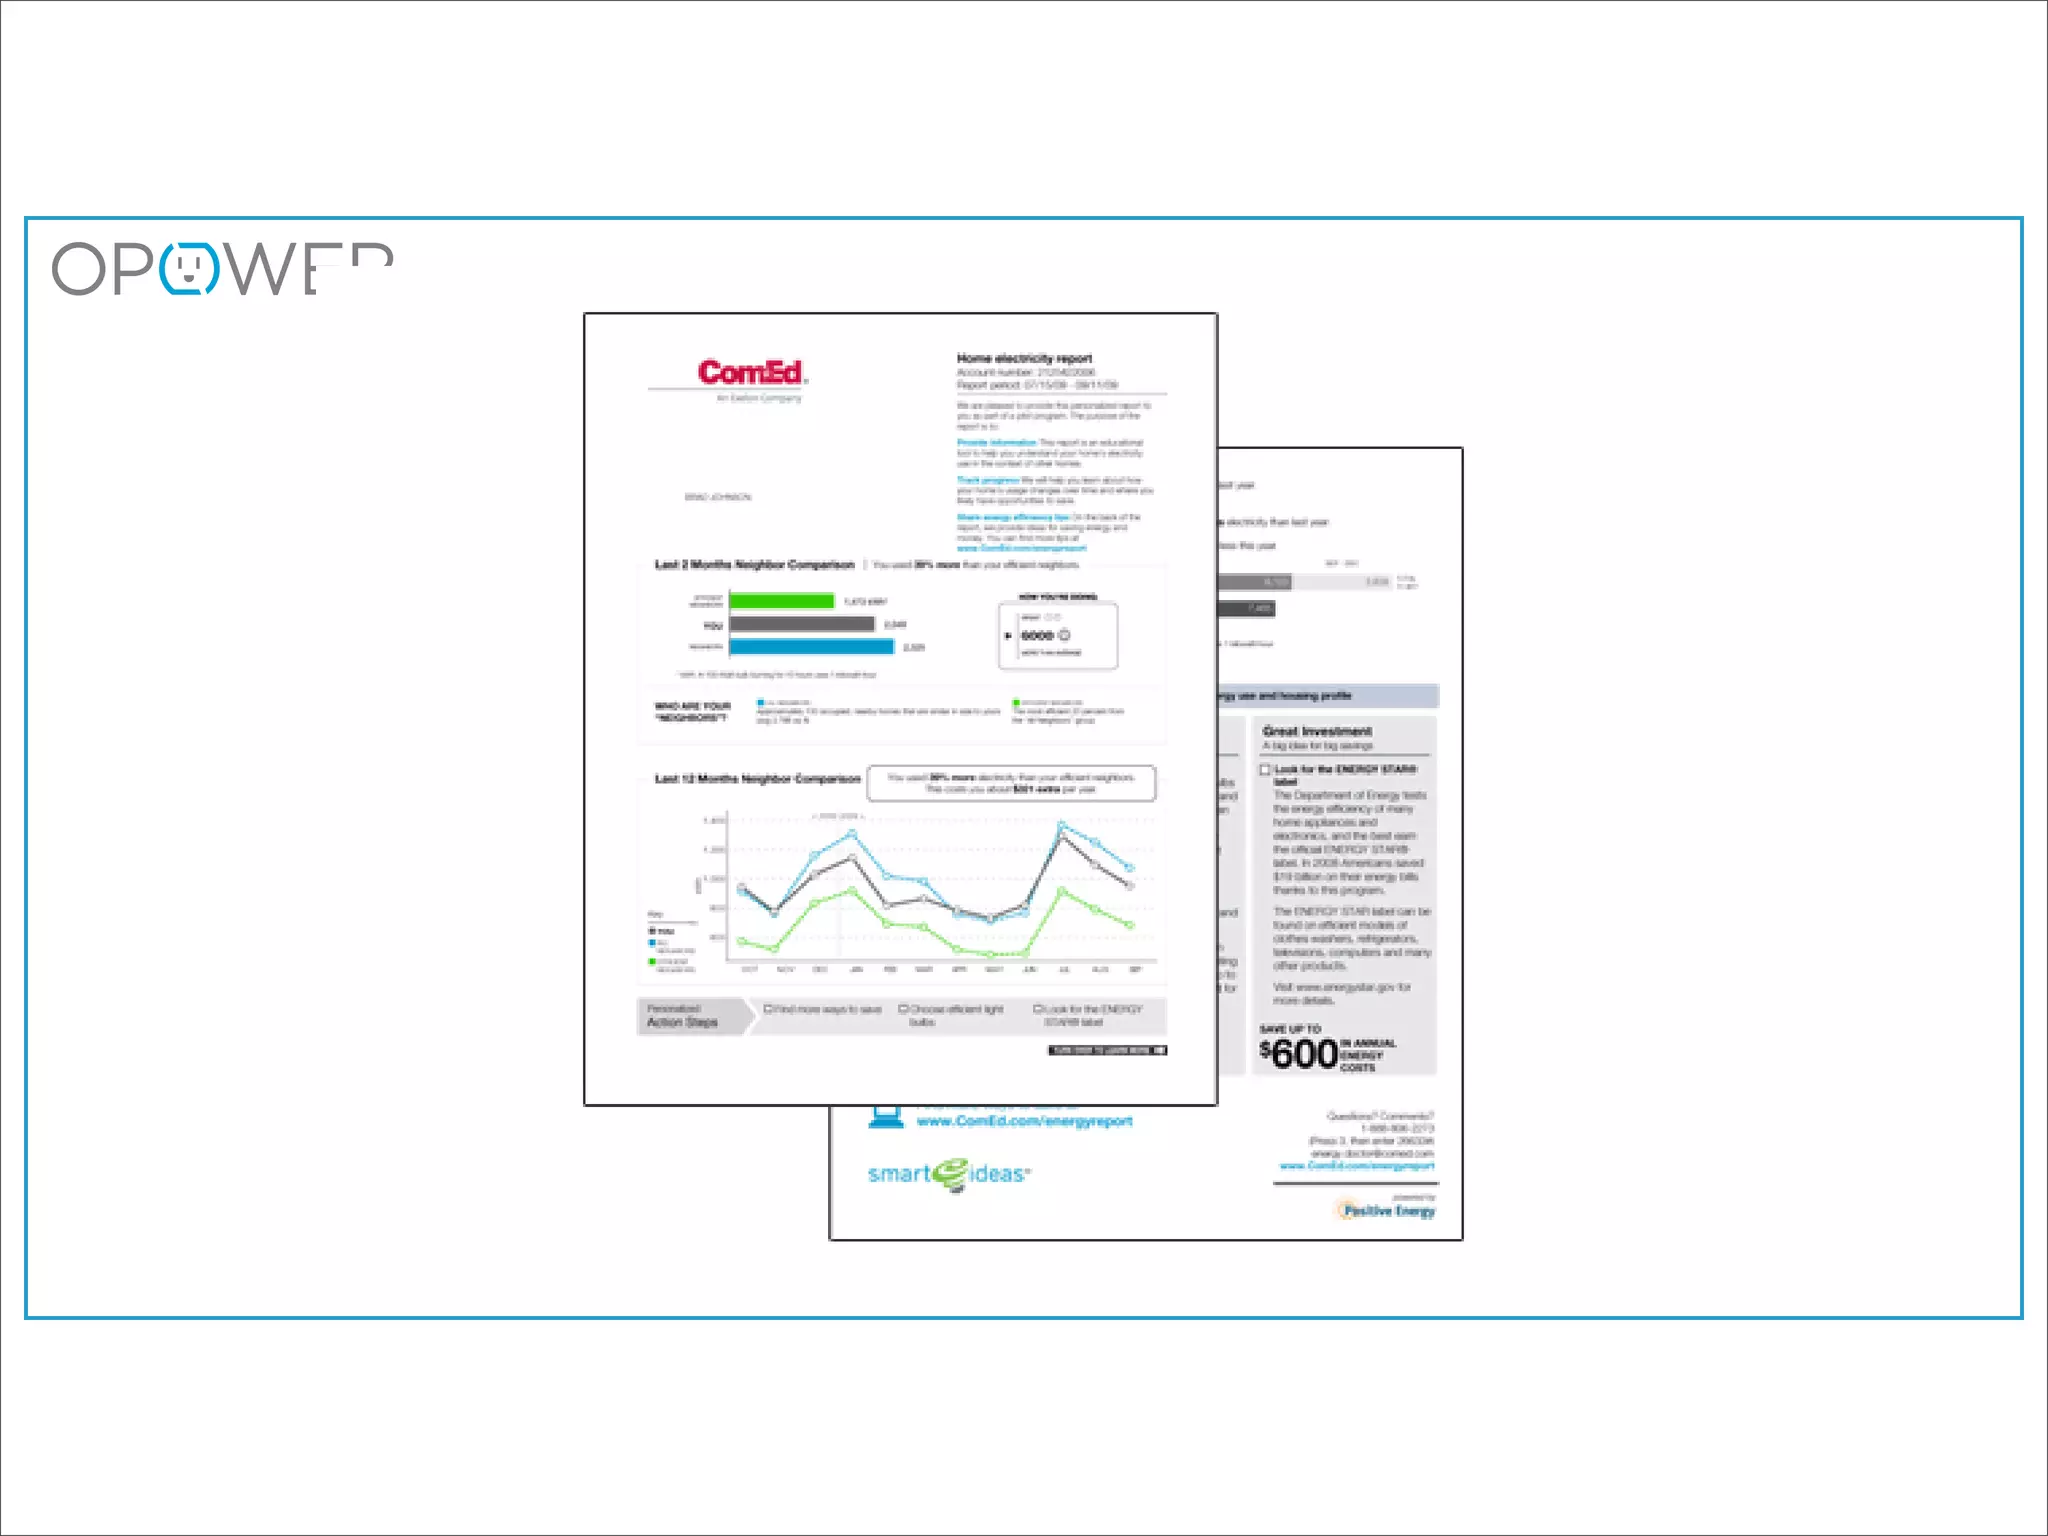
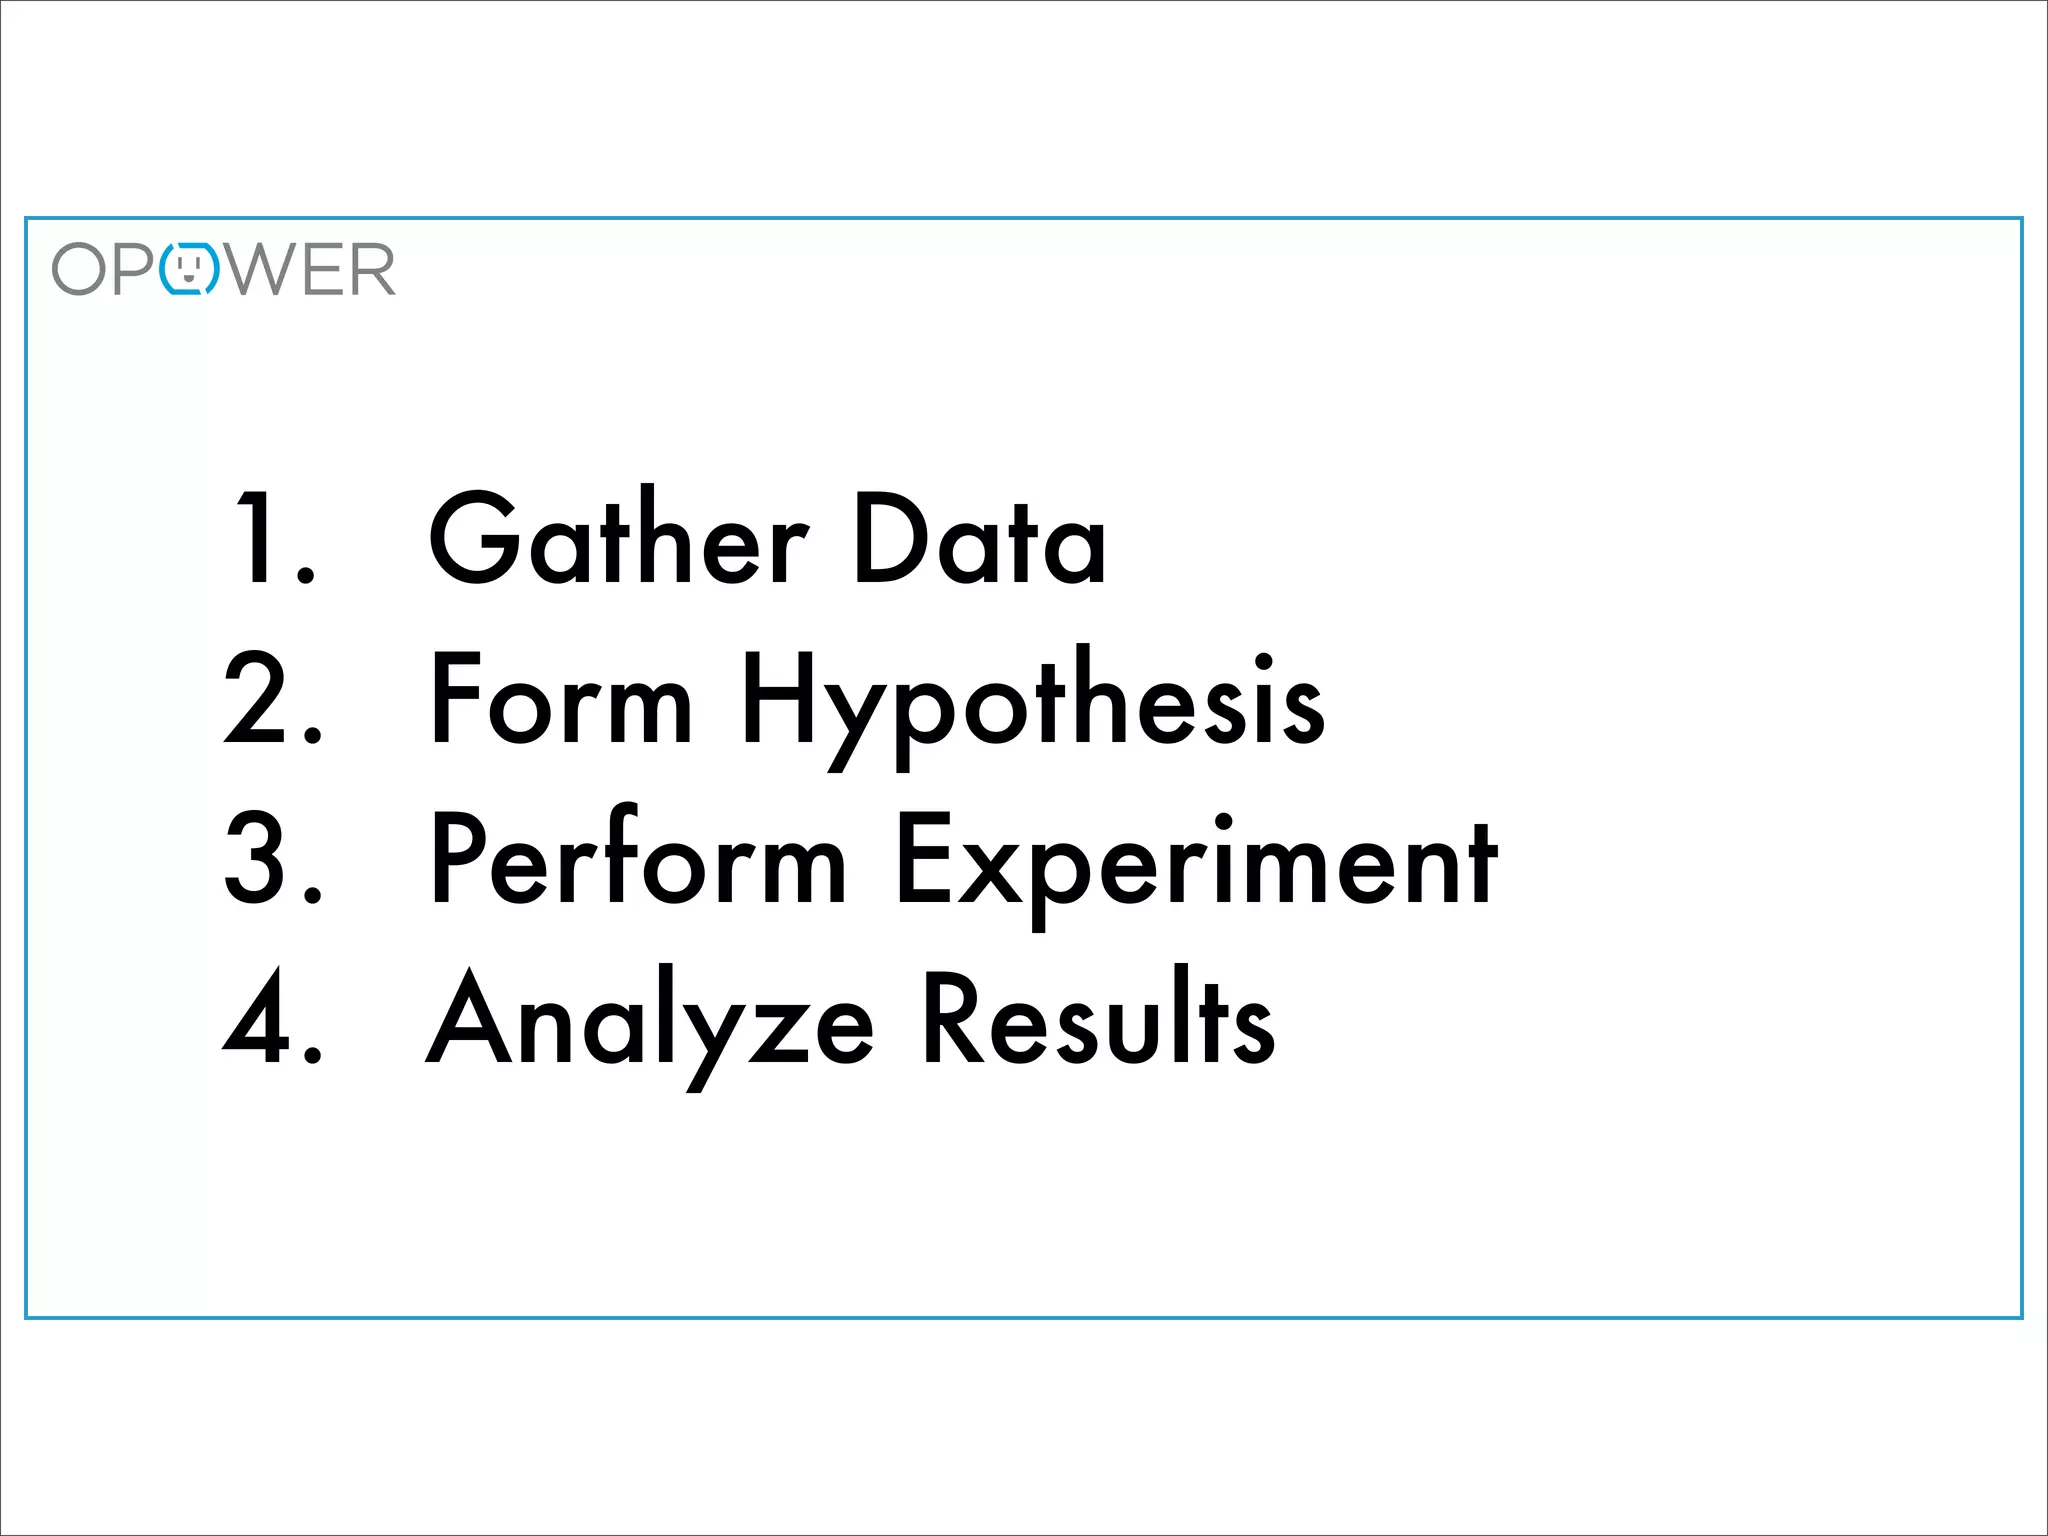
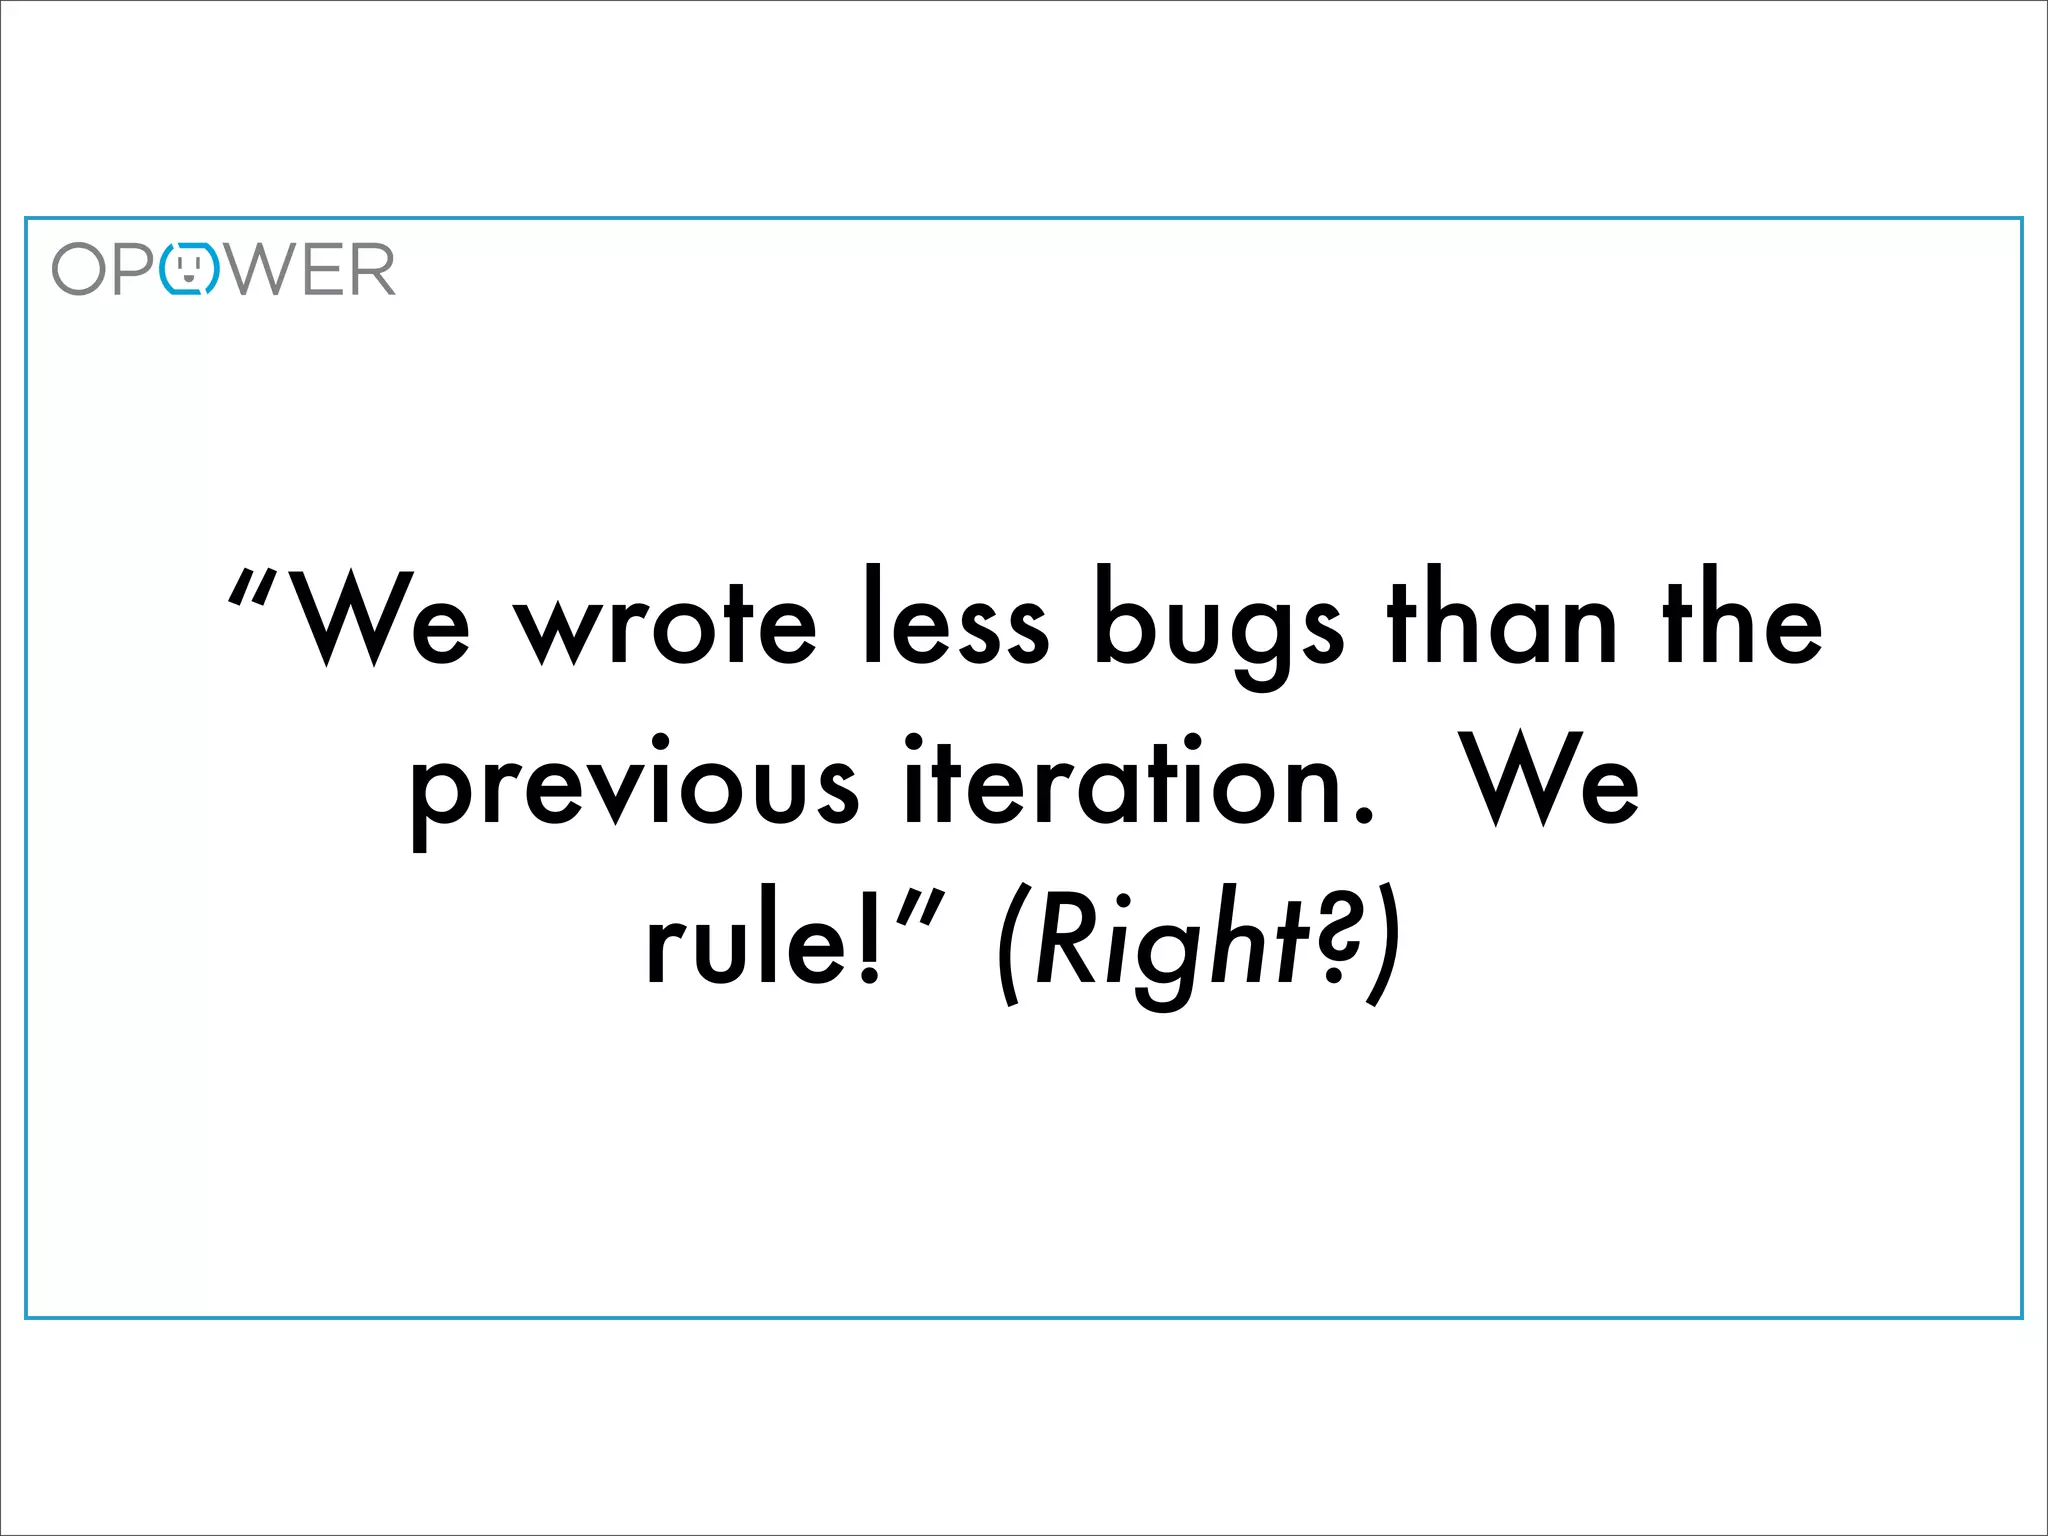
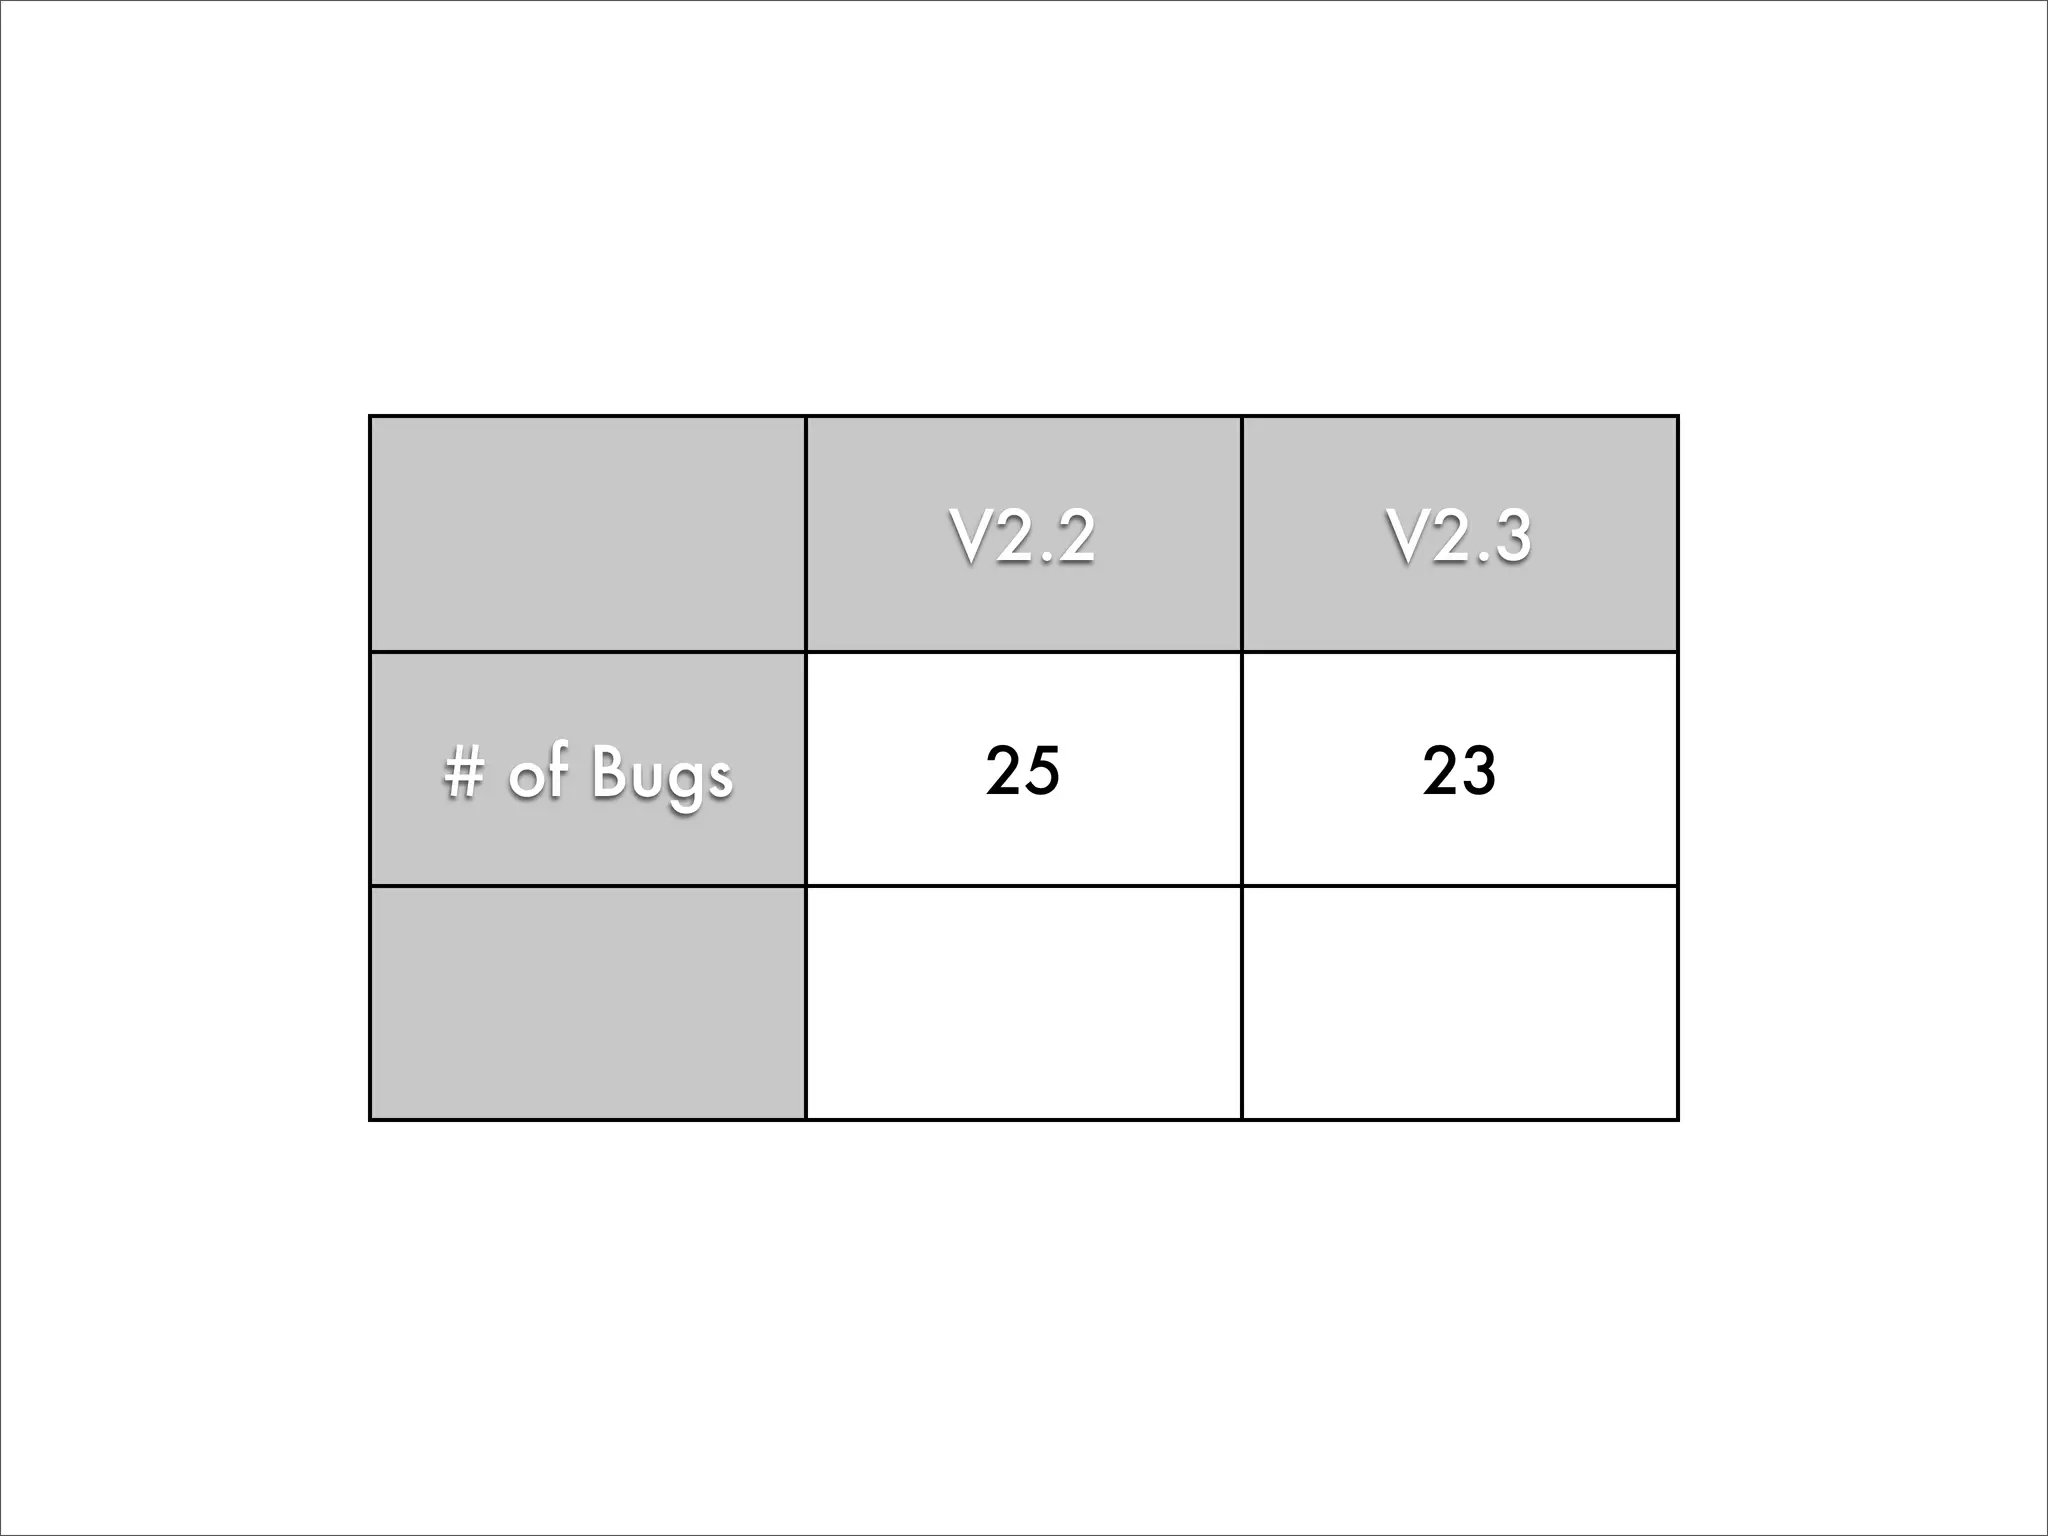
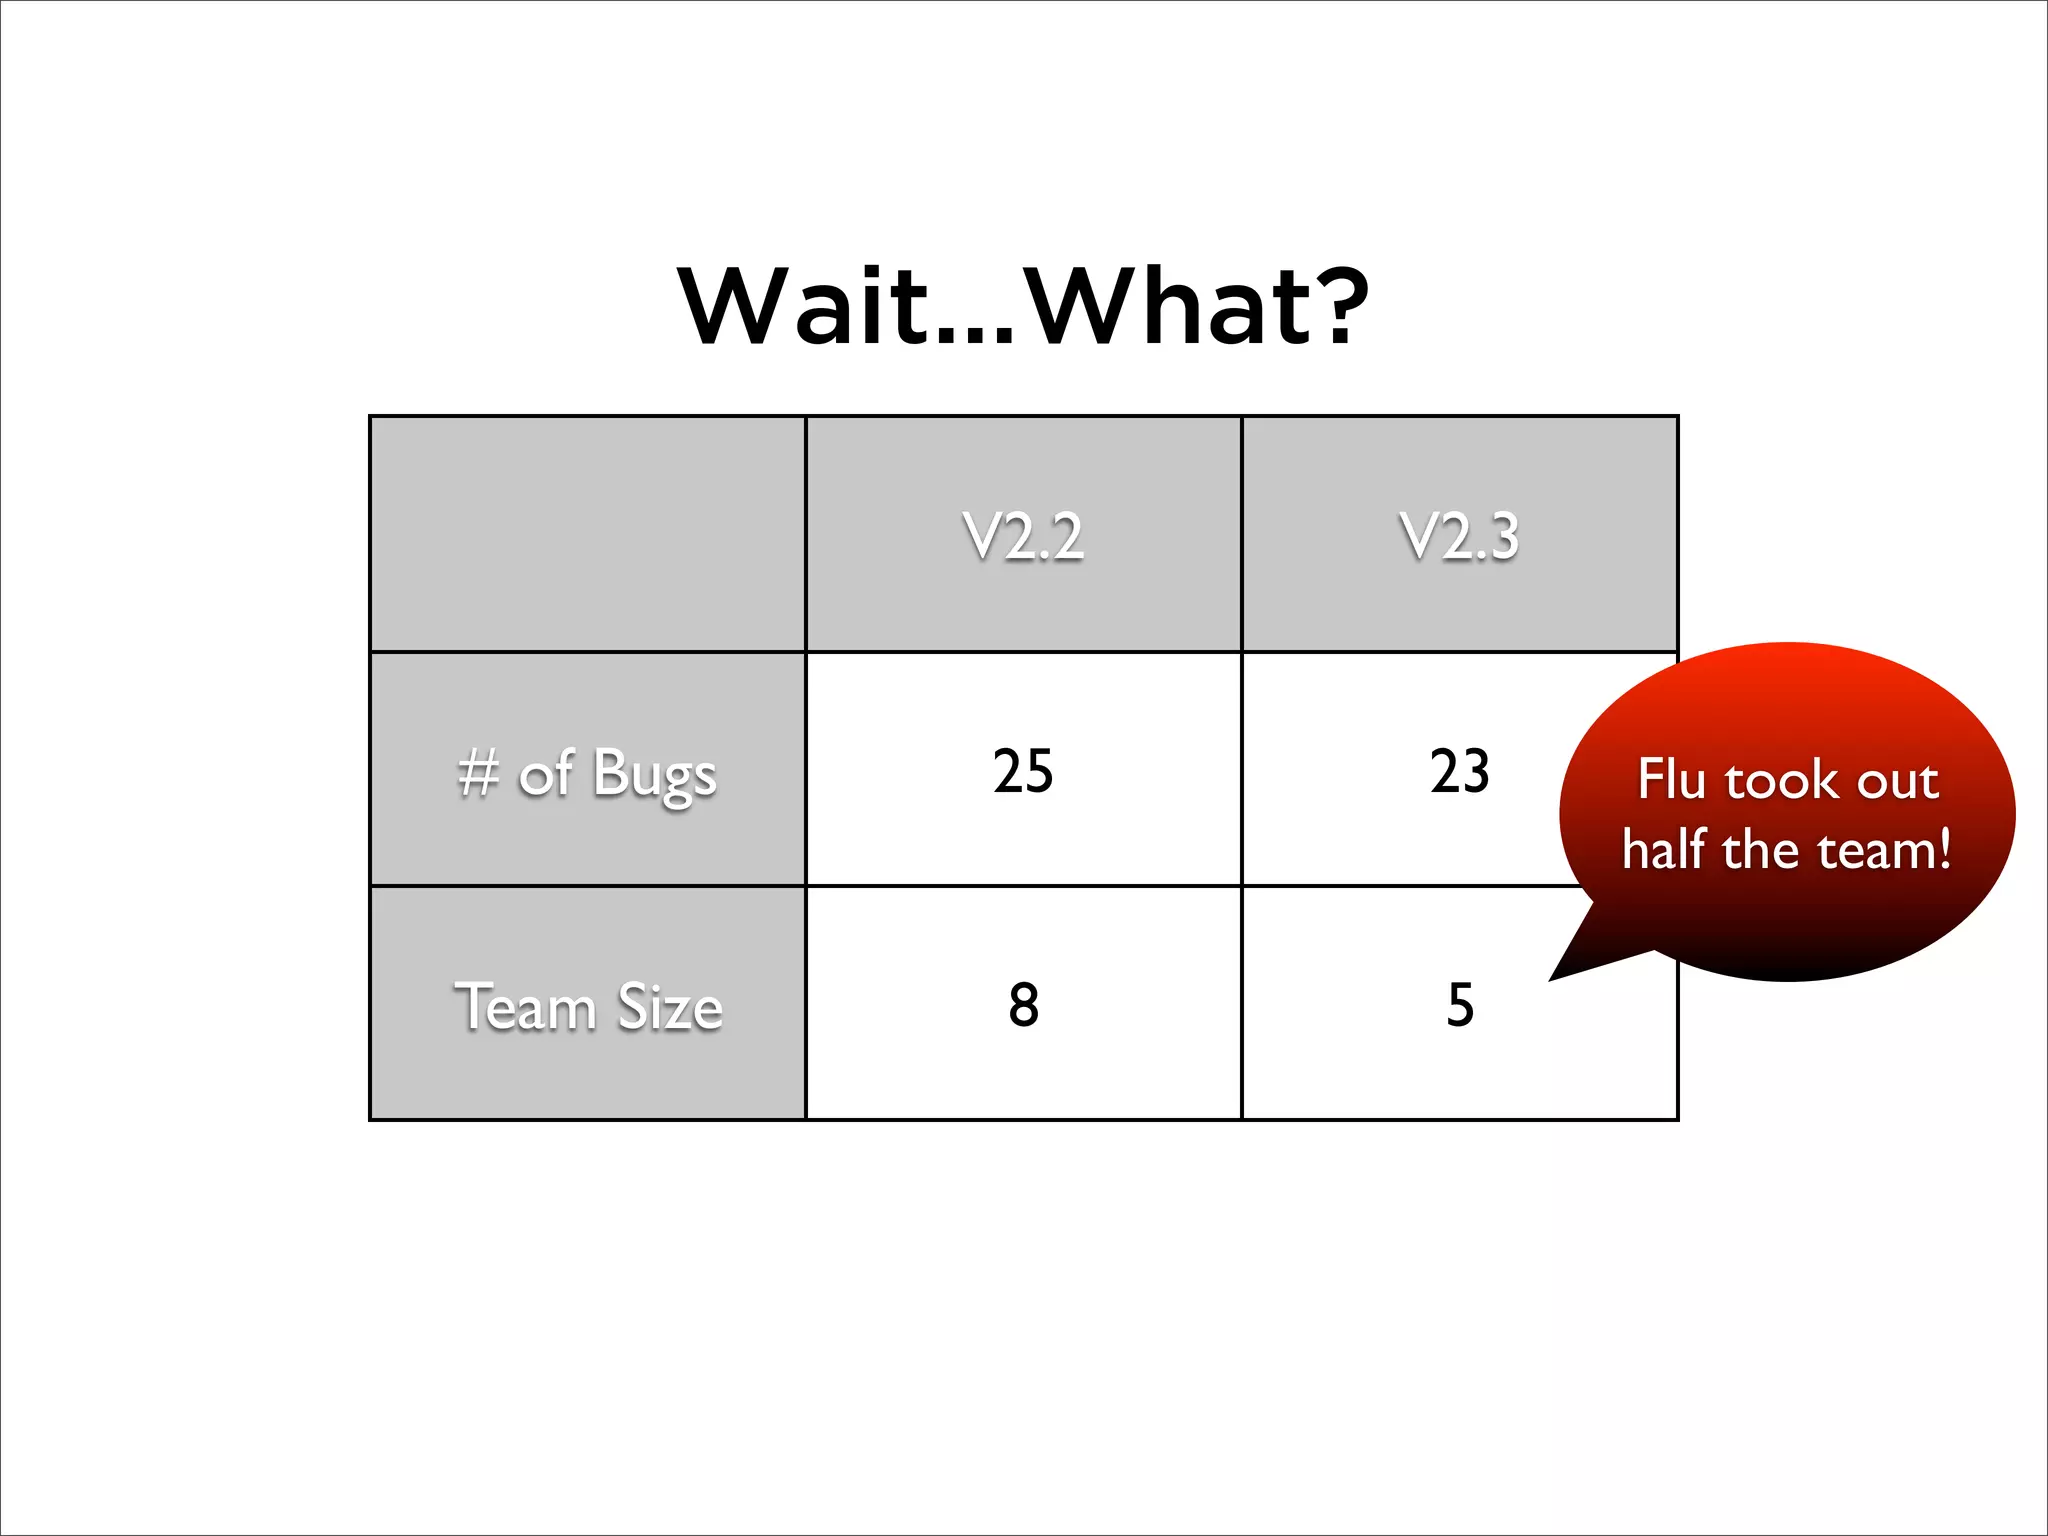
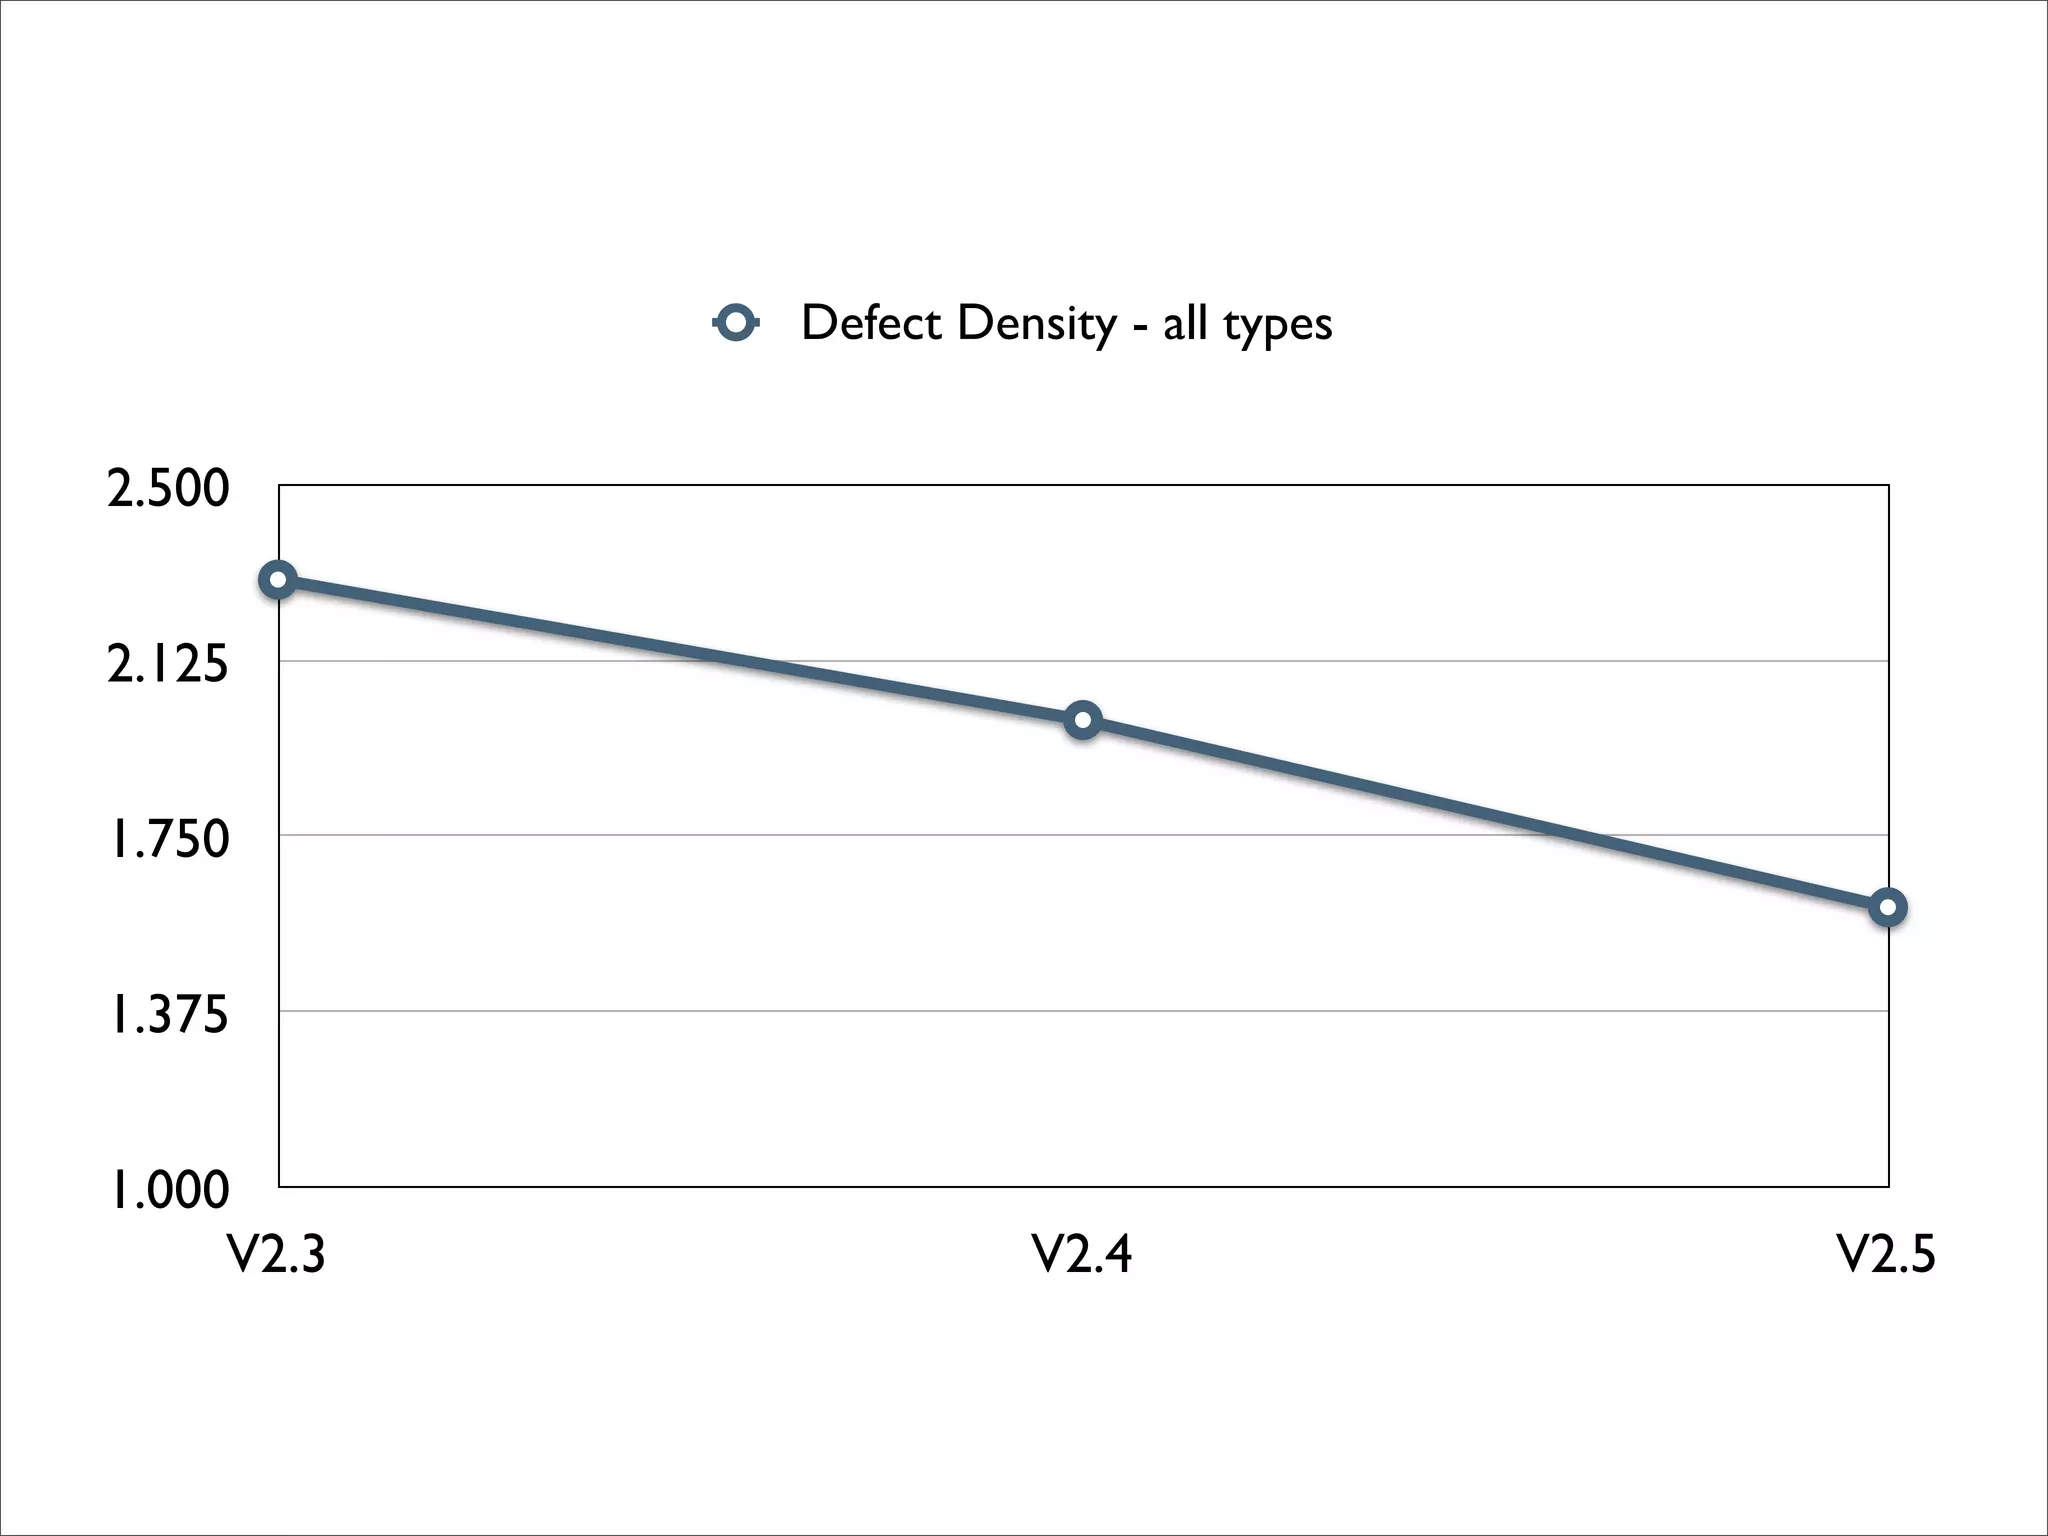
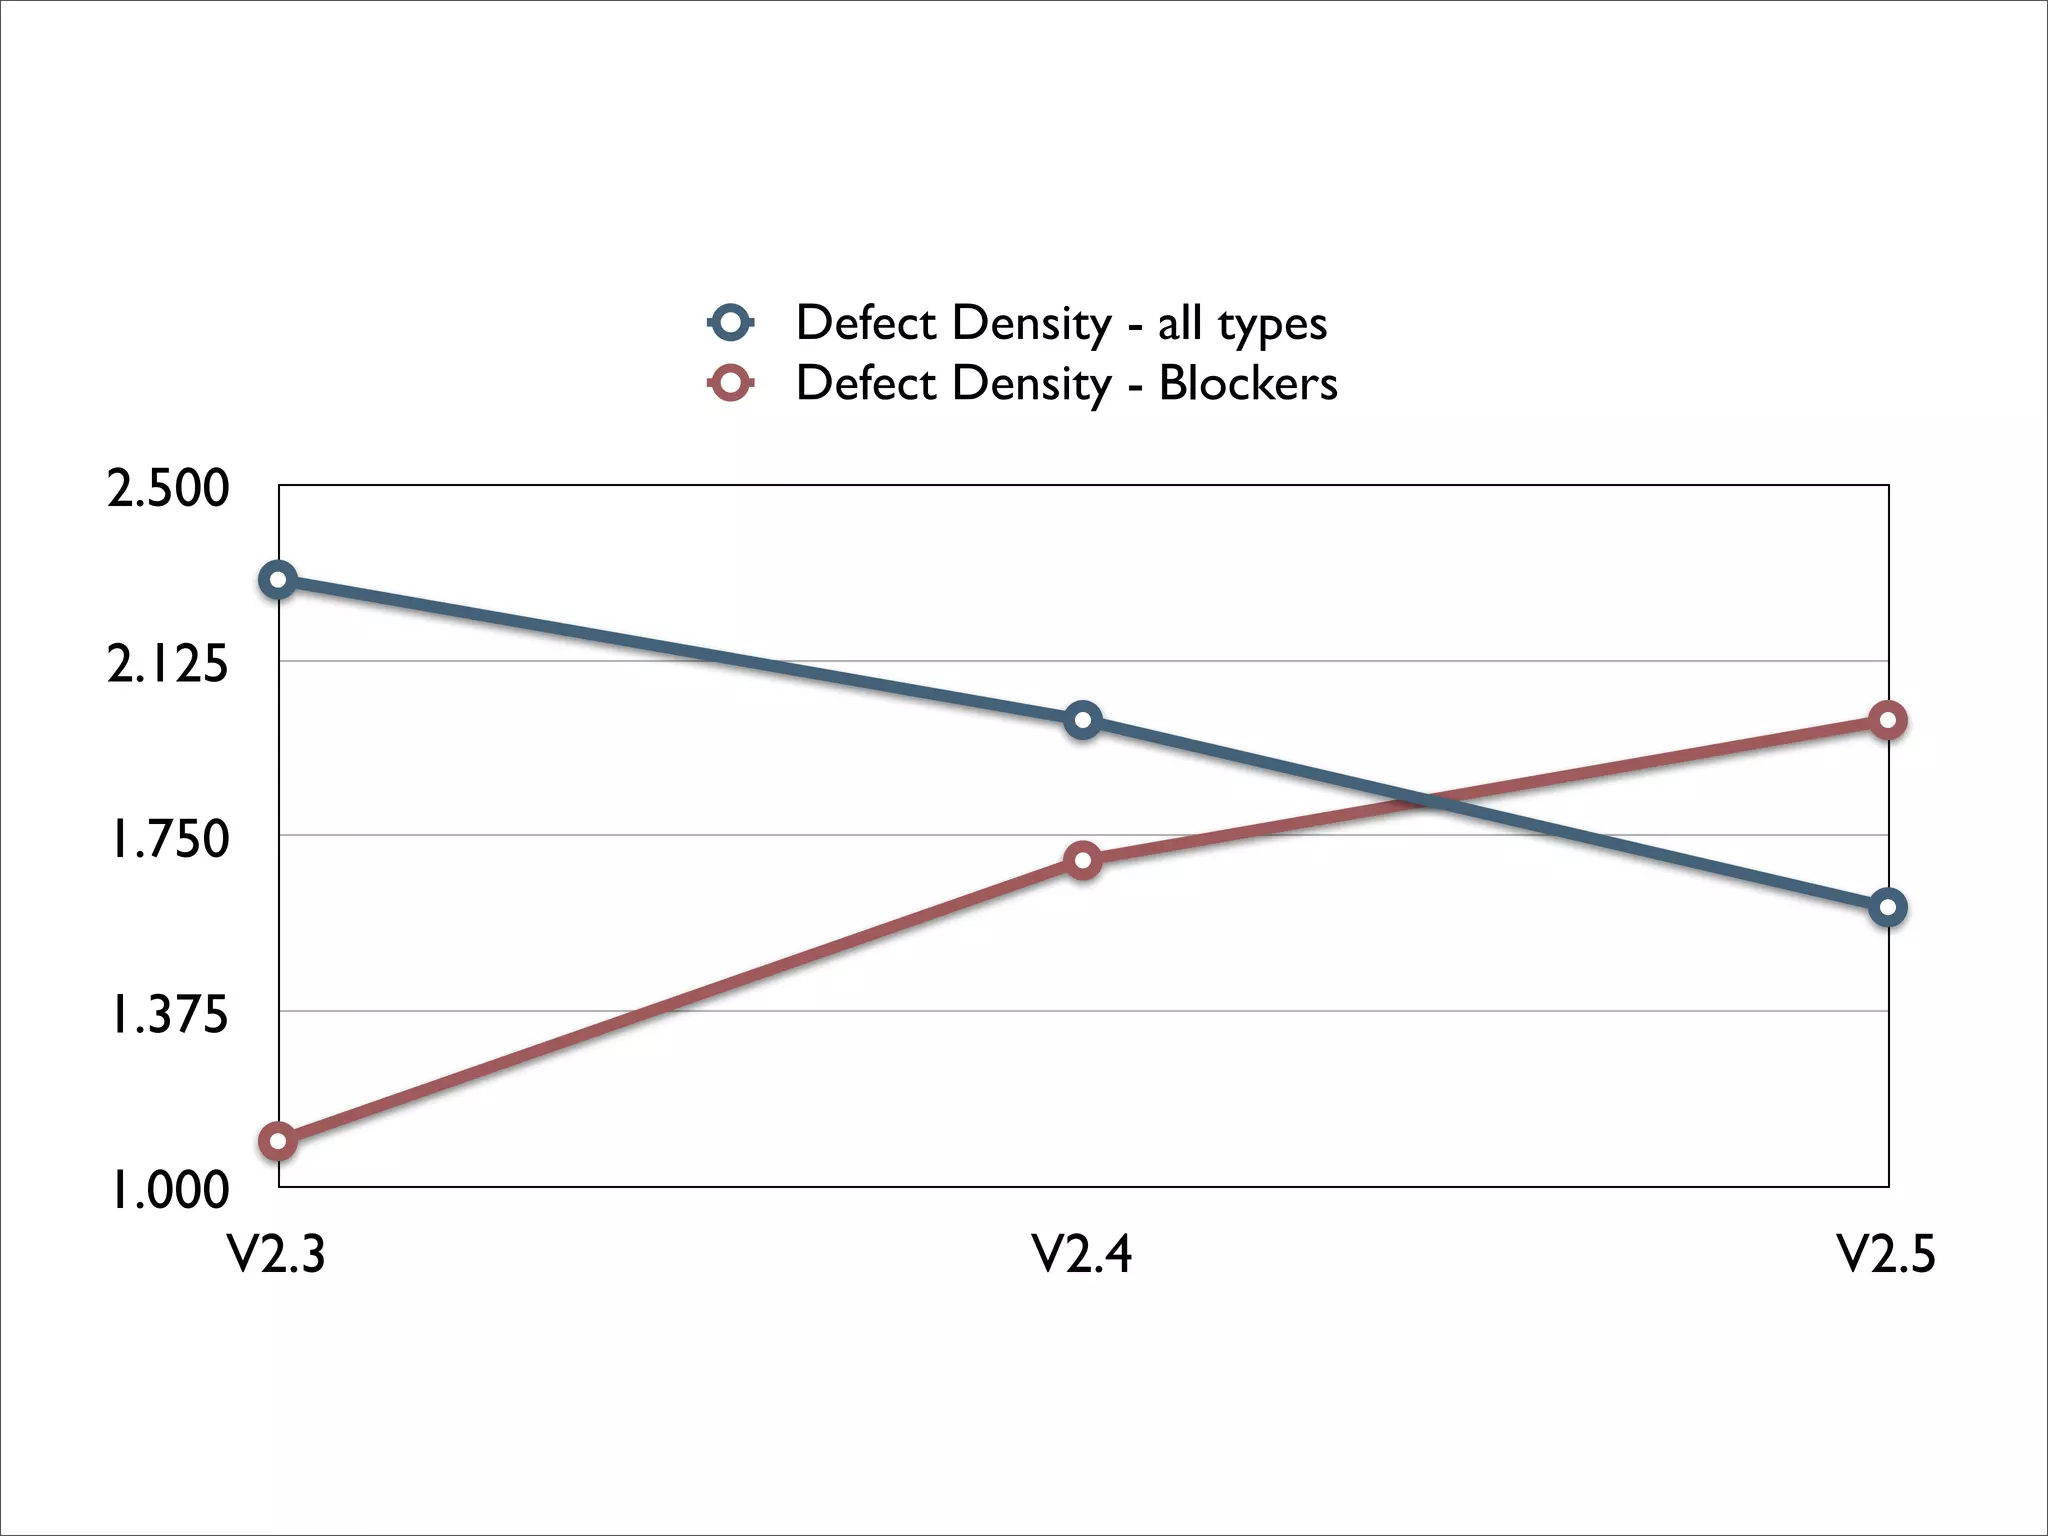
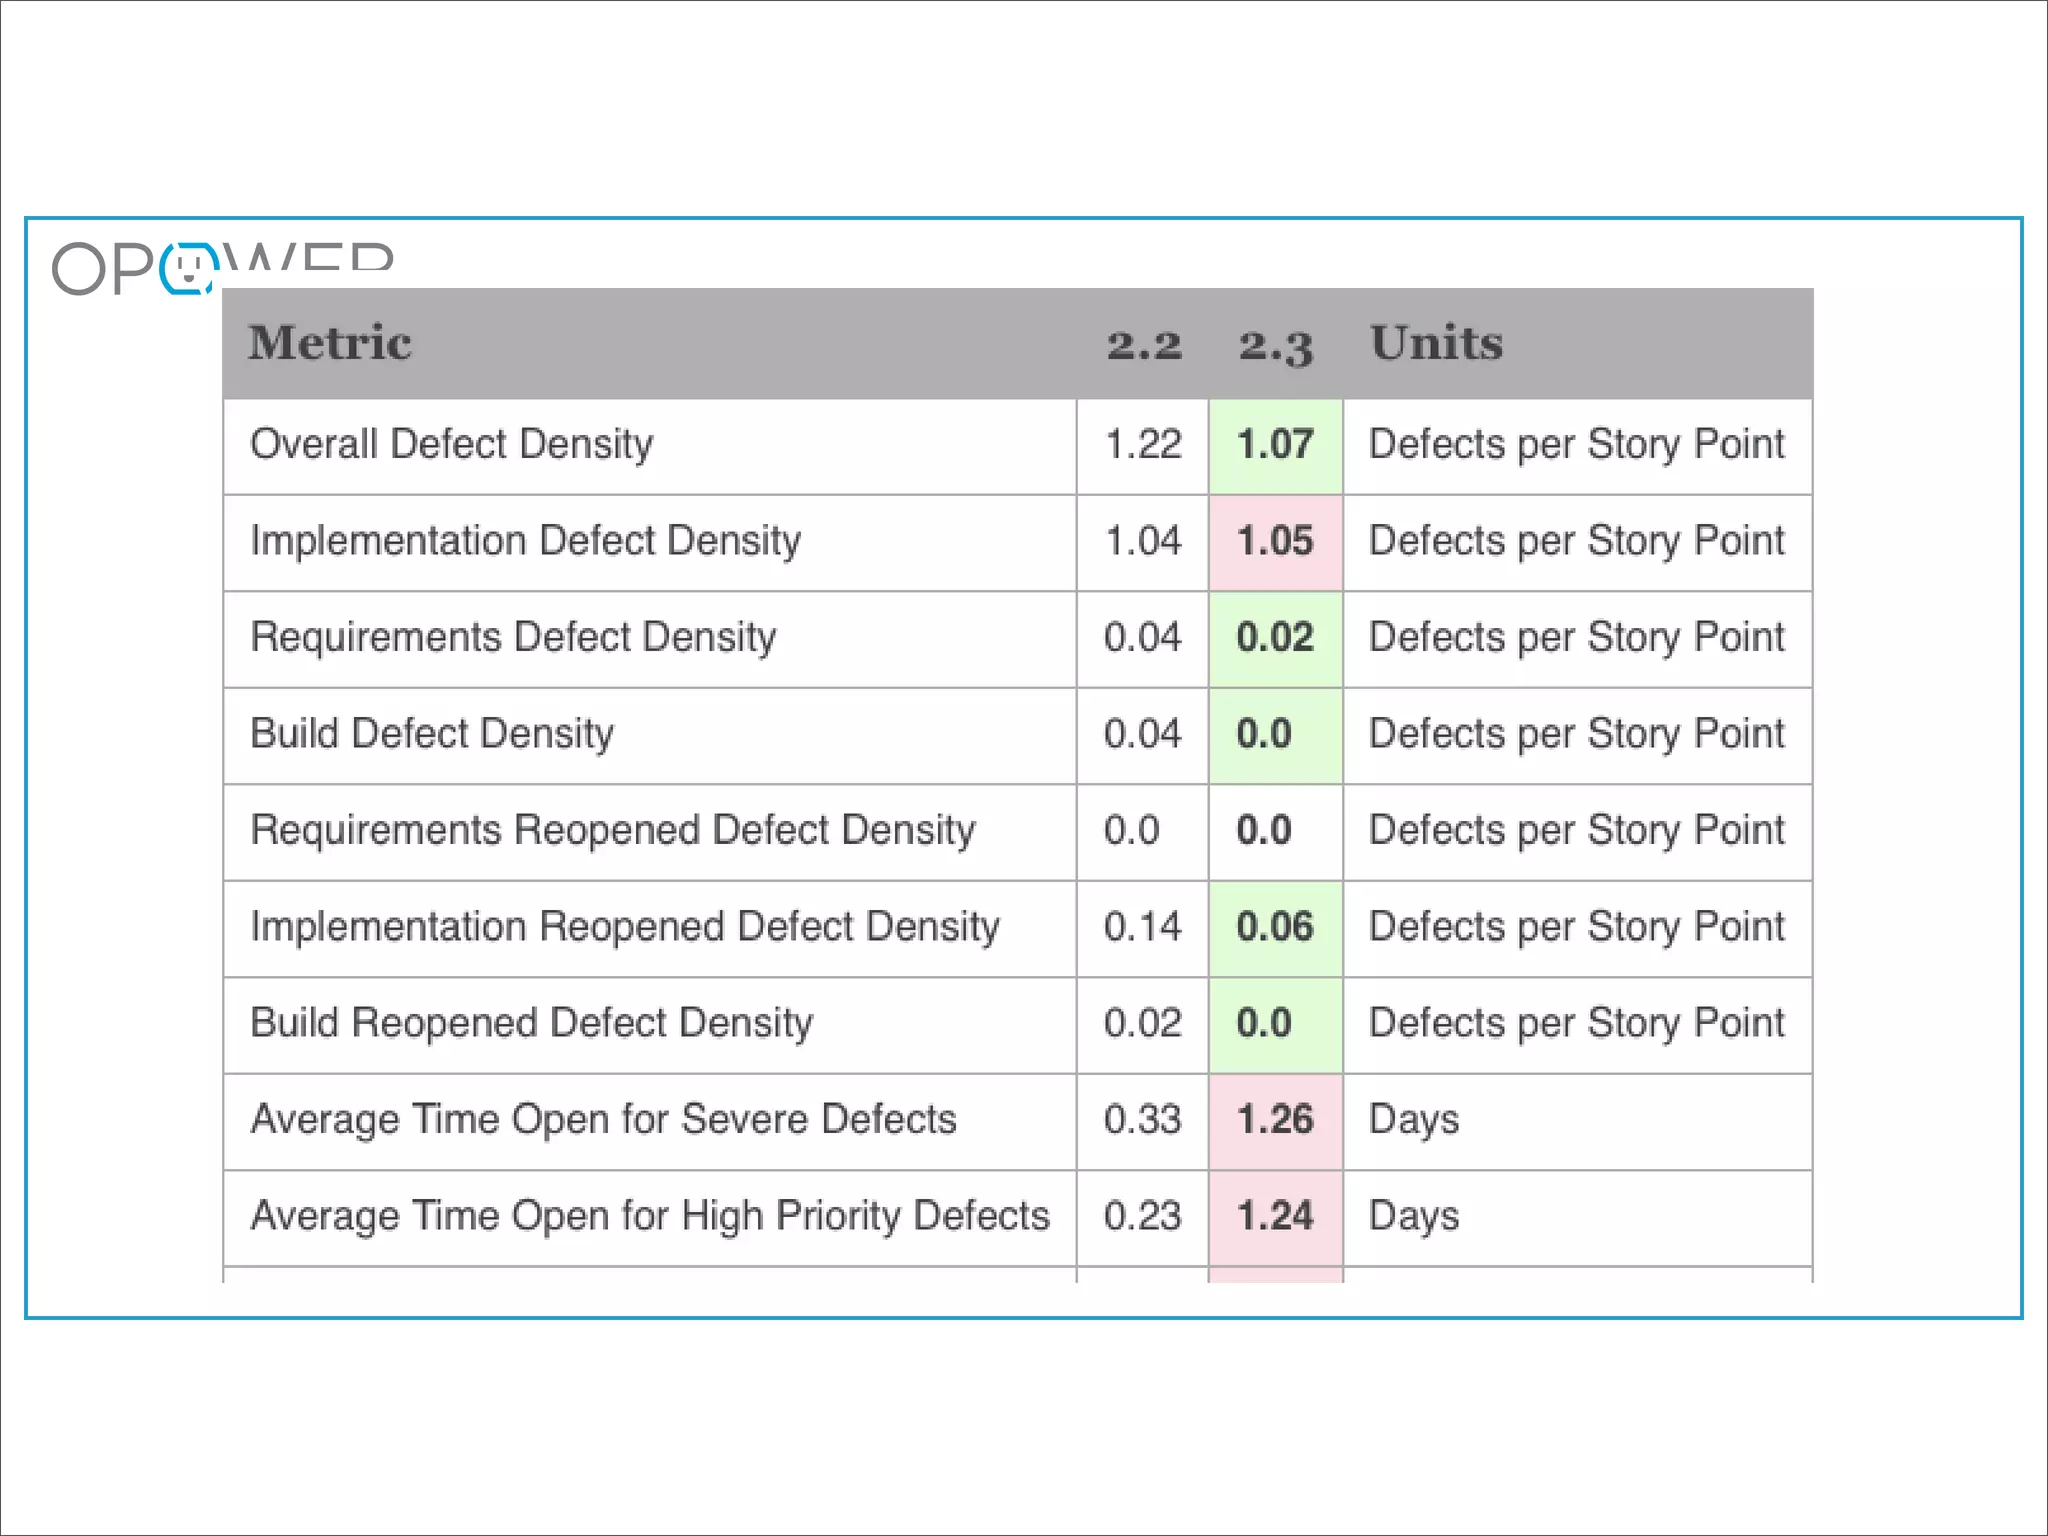
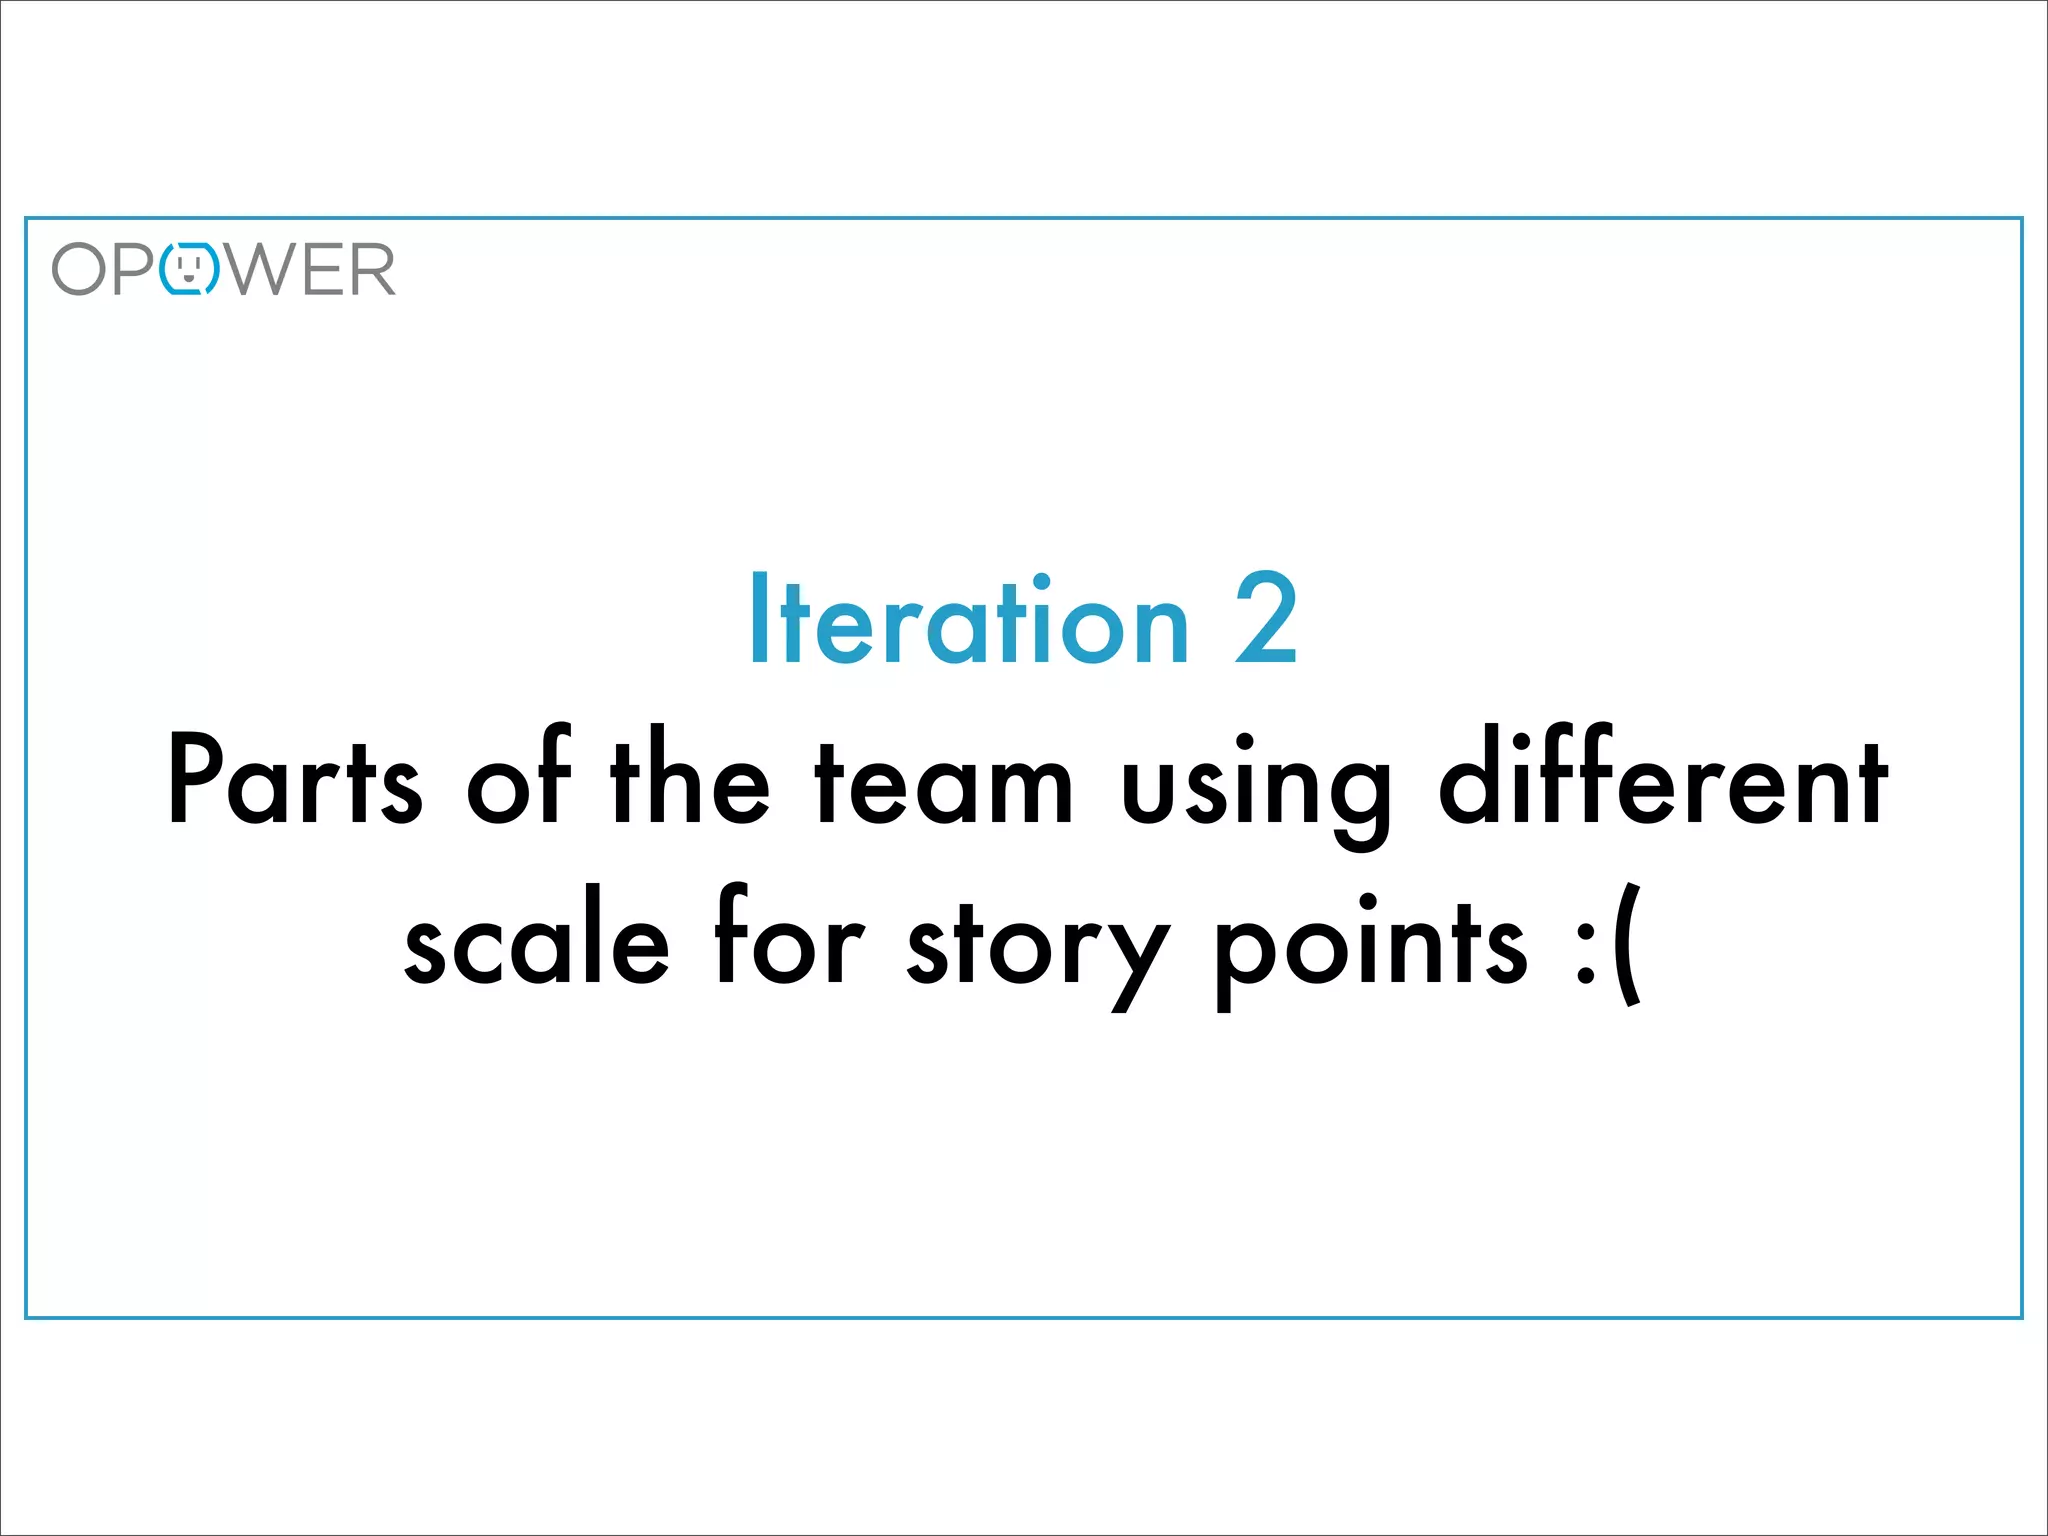
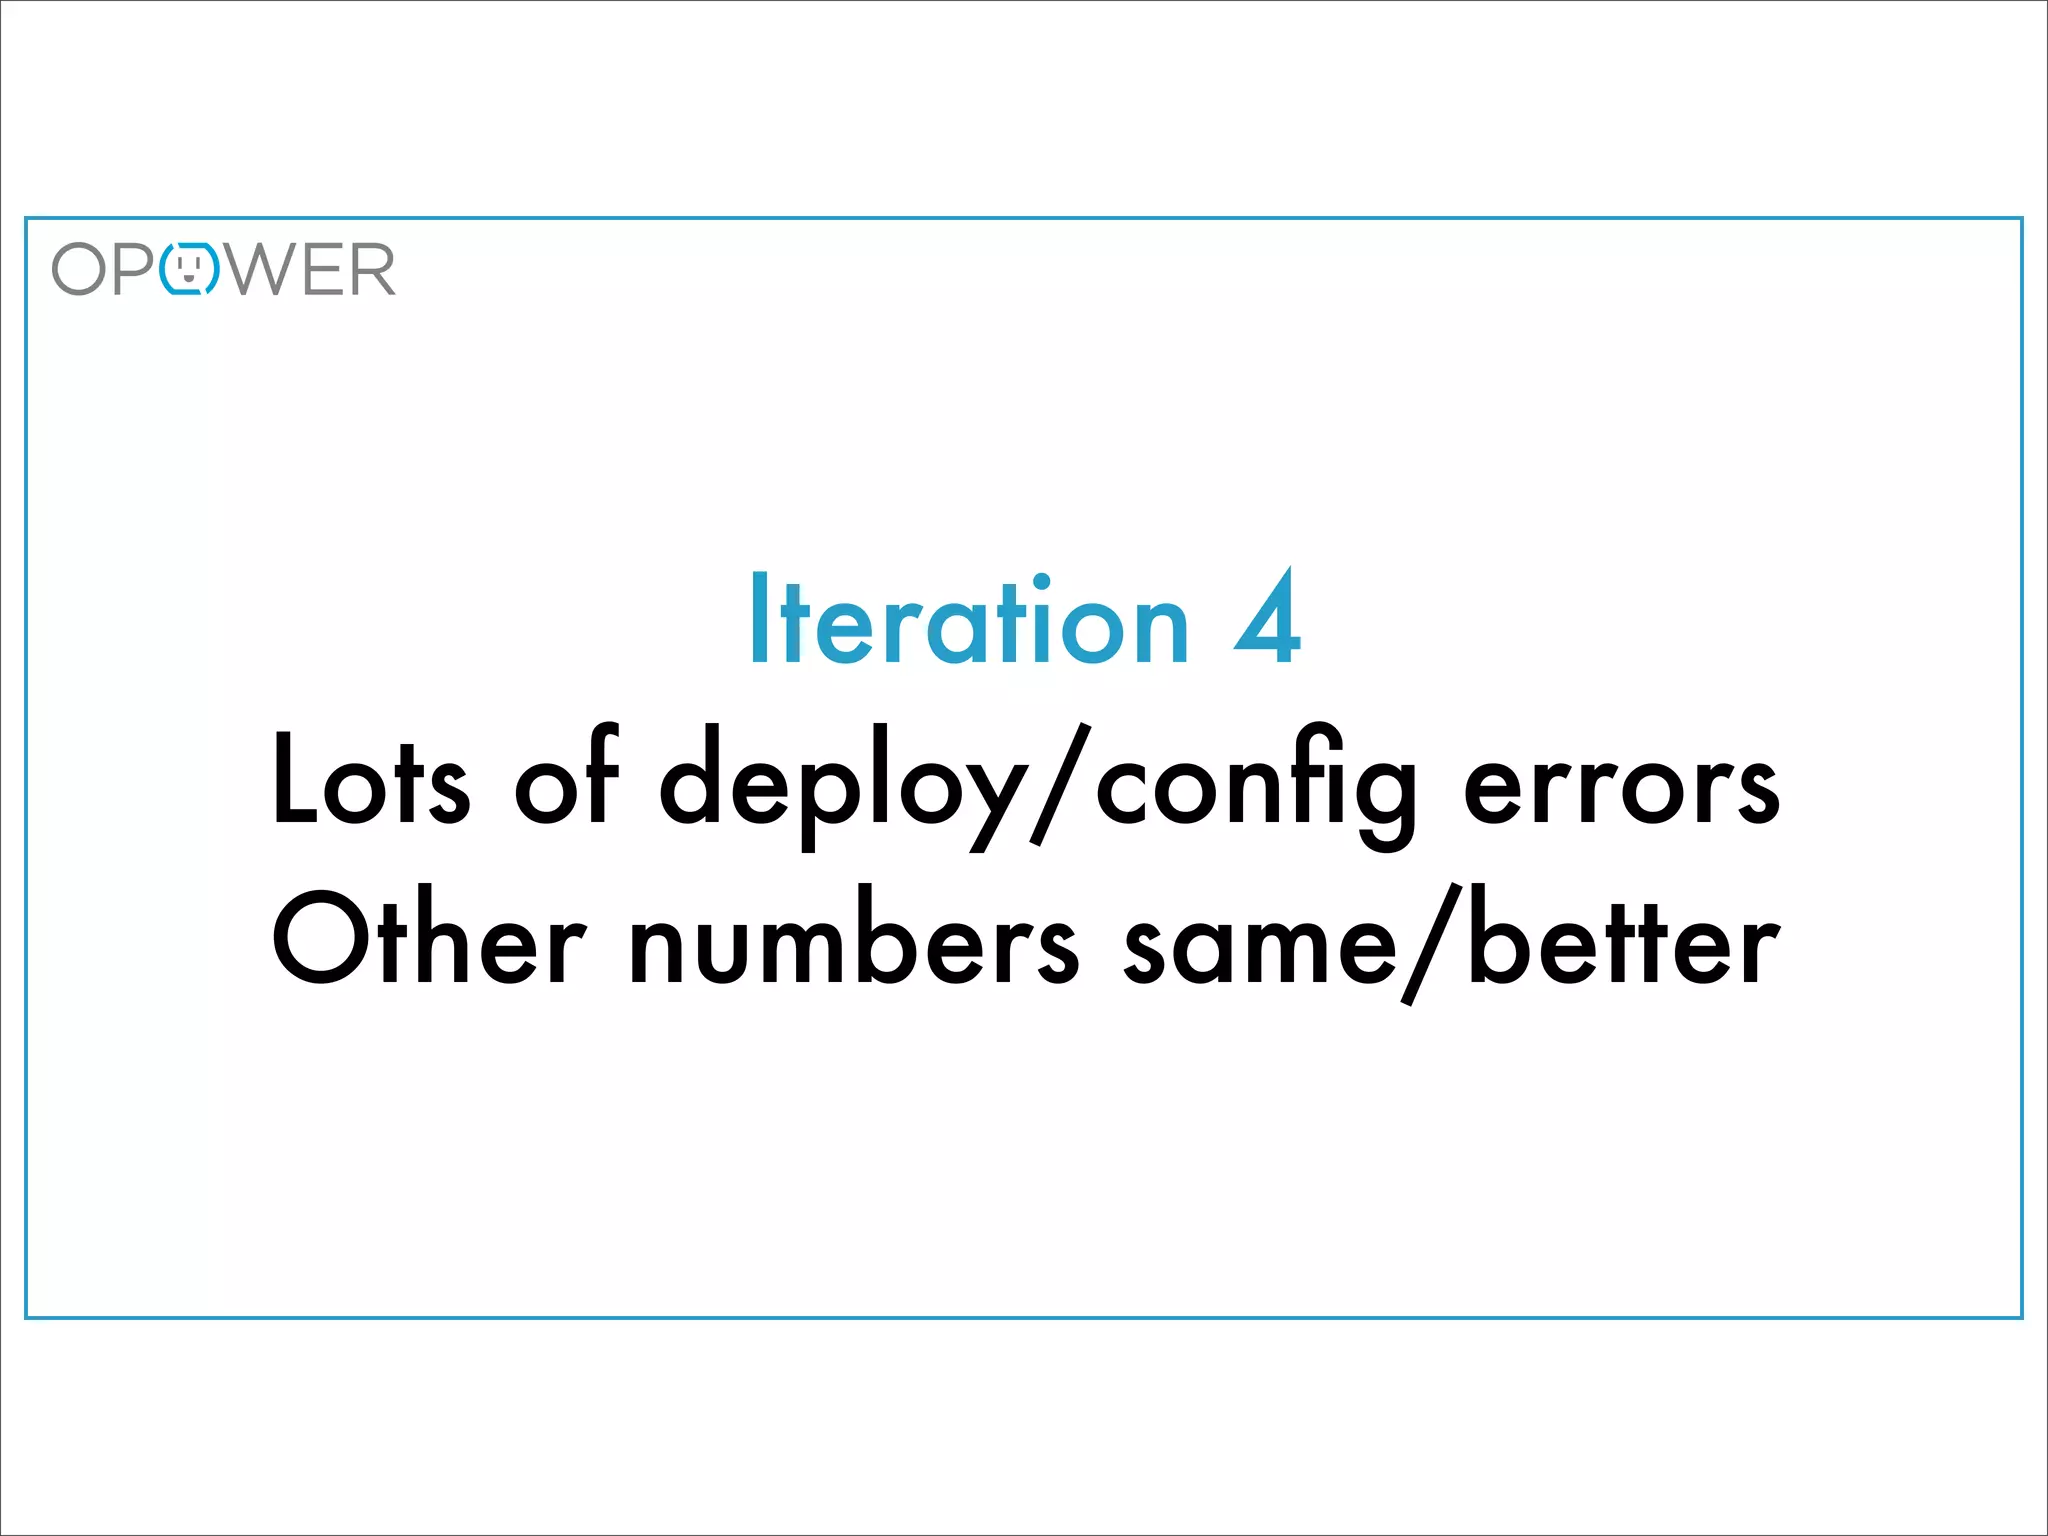
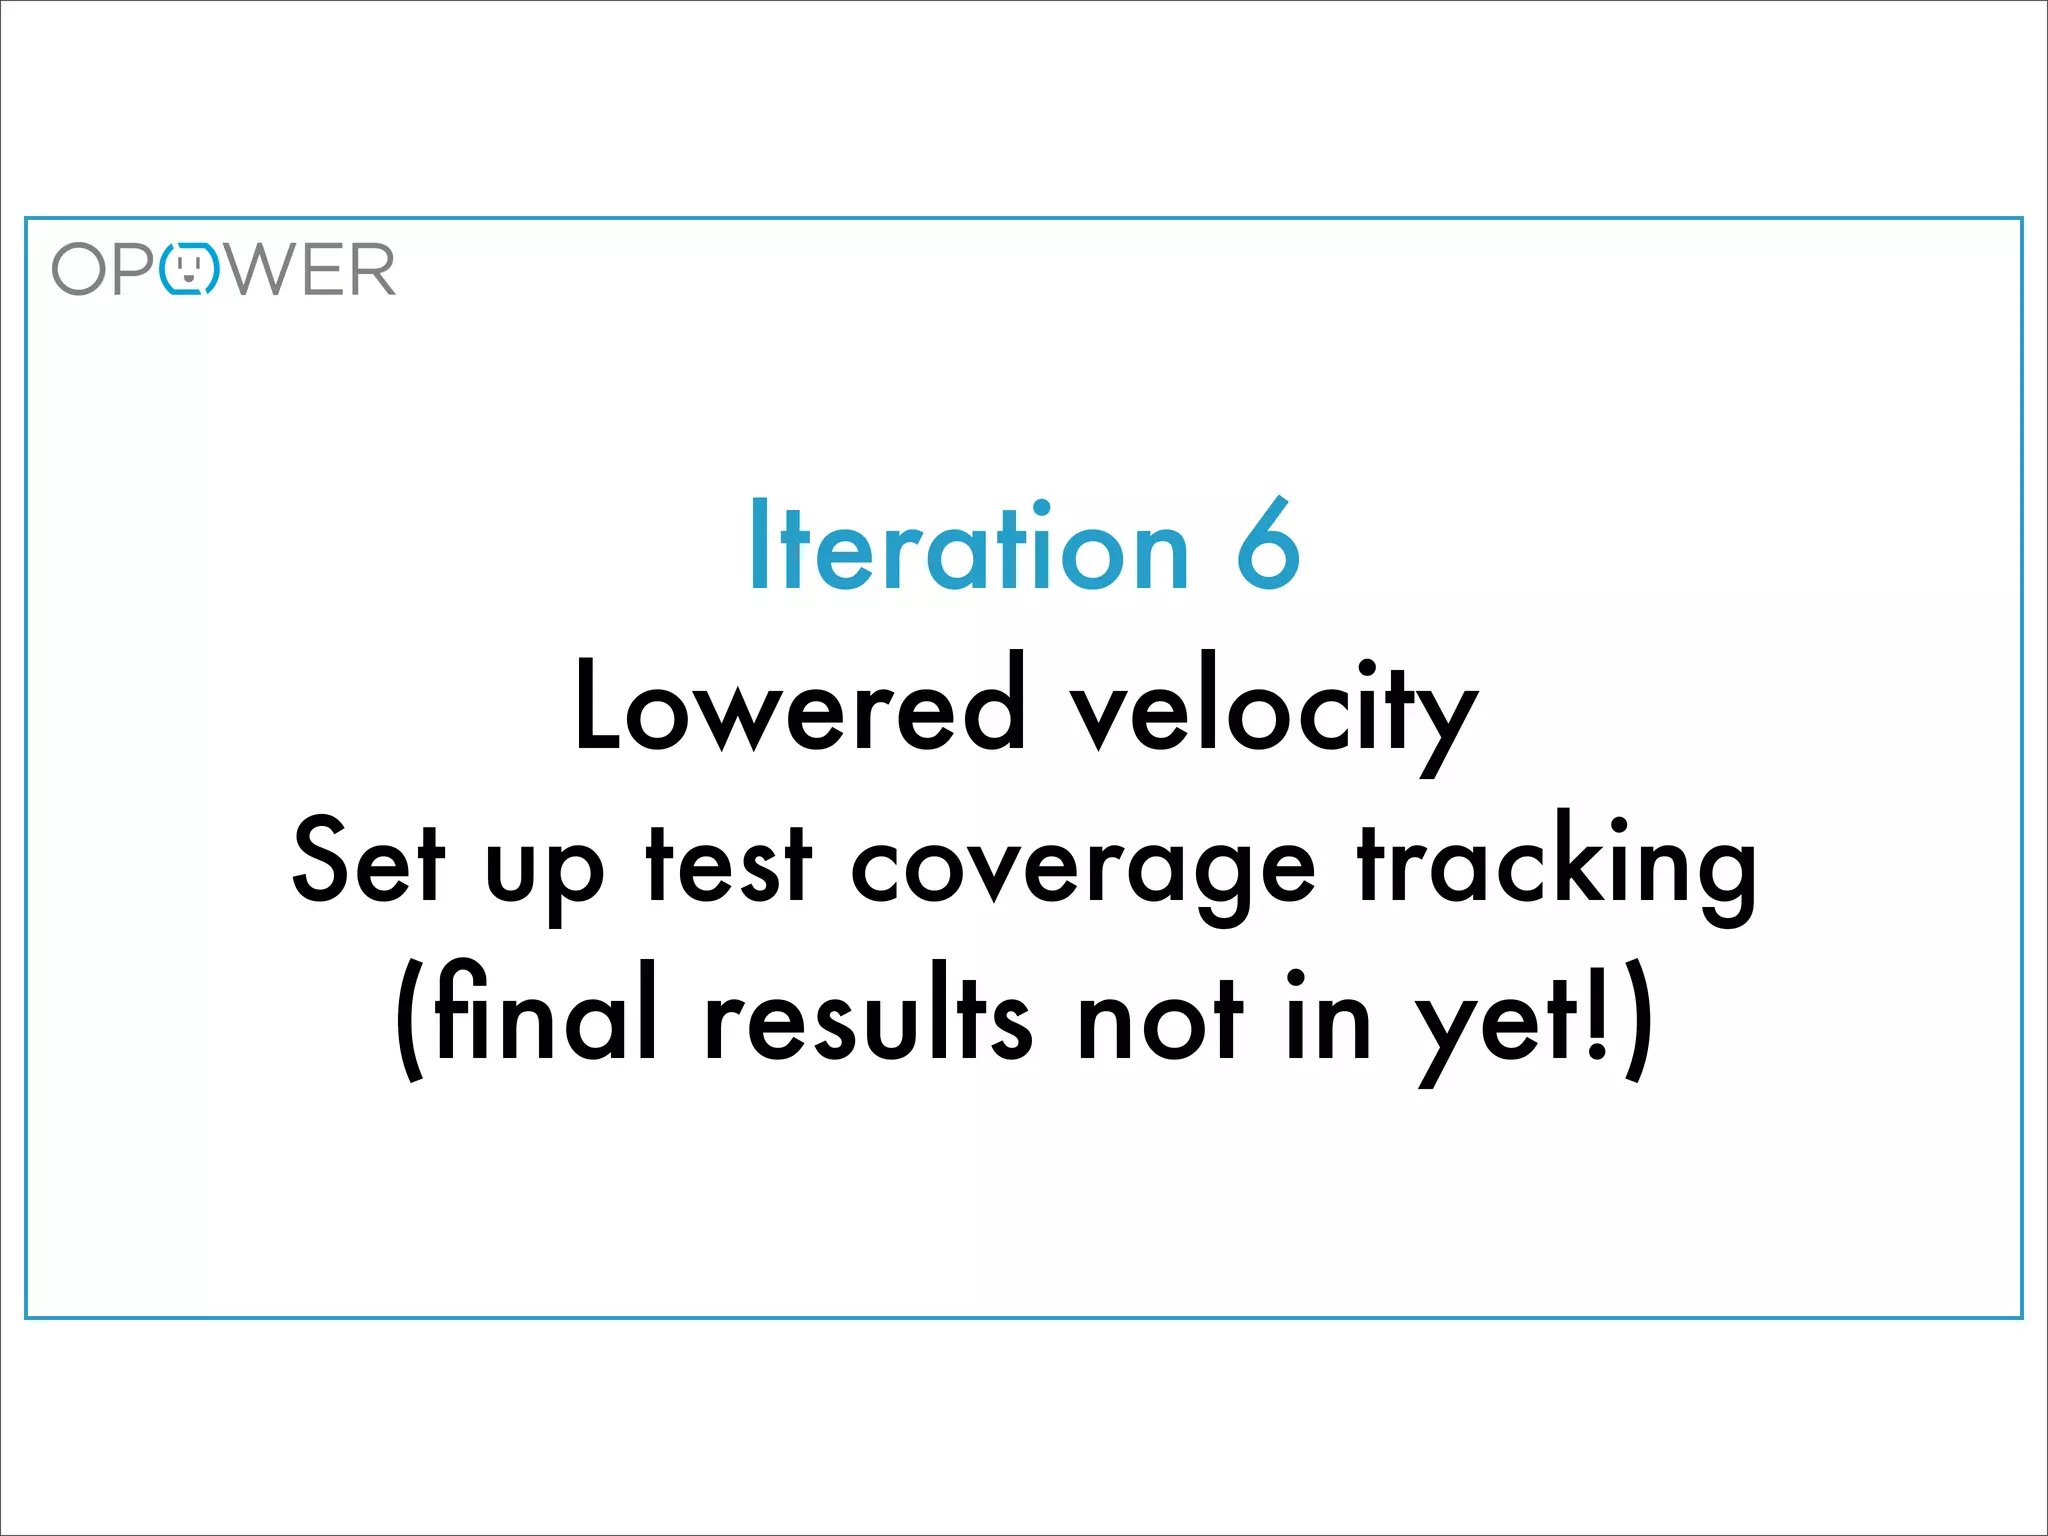
The document discusses improving agile processes by proposing a methodical approach to metric analysis and experimentation. It highlights the importance of identifying problem areas, hypothesizing solutions, conducting experiments, and analyzing results to enhance agile practices like test coverage and pair programming. The author's real-world example illustrates the iterative process of measuring and adapting practices to reduce defects while tracking progress over time.


![[Scrum Breakfast] How to apply Lean and Kanban in your business - Speaker: Ph...](https://cdn.slidesharecdn.com/ss_thumbnails/leanthinkingkanbanphuongbui-160426030408-thumbnail.jpg?width=640&height=640&fit=bounds)


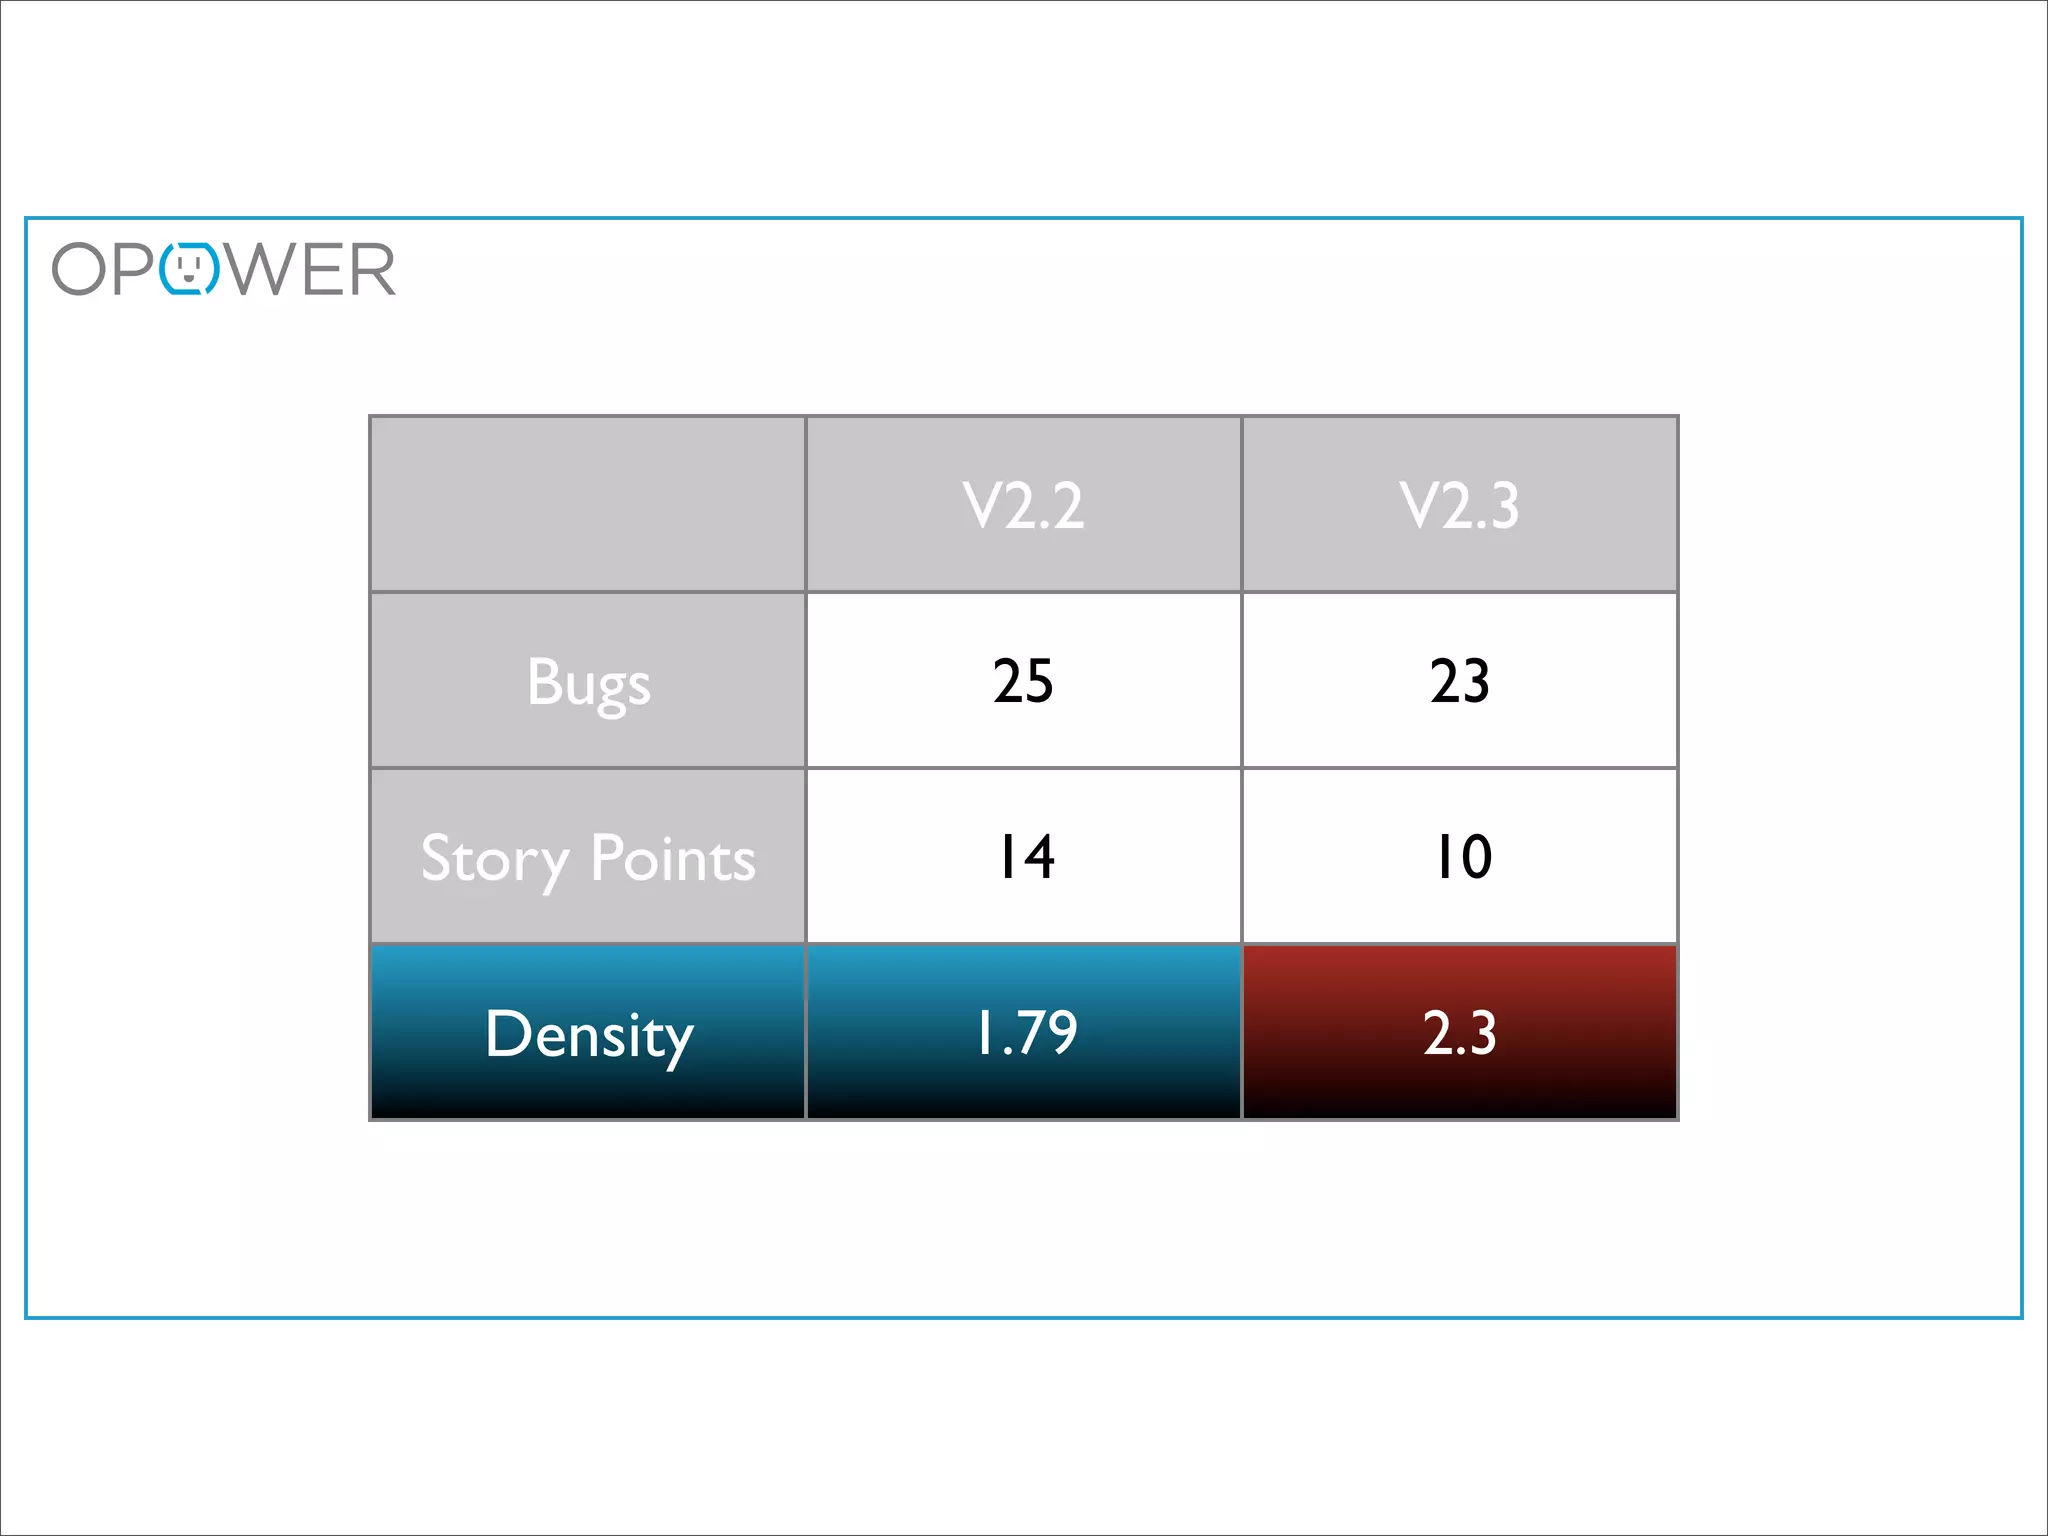
![[HCM Scrum Breakfast] Agile estimation - Story points](https://cdn.slidesharecdn.com/ss_thumbnails/storypointsestimations-160827052054-thumbnail.jpg?width=640&height=640&fit=bounds)