Corneal topography and wavefront imaging
•
7 likes•1,959 views

Ophthalmology Yanoff - C. 4.2 Corneal Topography and Wavefront Imaging

Recommended
More Related Content
What's hot
What's hot (20)
Viewers also liked
Viewers also liked (11)
Similar to Corneal topography and wavefront imaging
Similar to Corneal topography and wavefront imaging (20)
More from Socrates Narvaez
More from Socrates Narvaez (20)
Recently uploaded
Recently uploaded (20)
Corneal topography and wavefront imaging
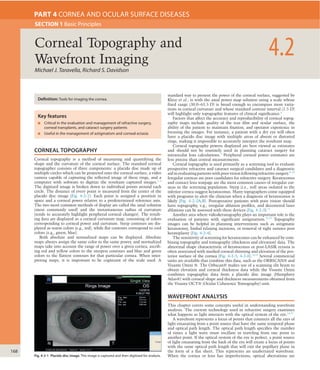
- 1. 168 CORNEAL TOPOGRAPHY Corneal topography is a method of measuring and quantifying the shape and the curvature of the corneal surface. The standard corneal topographer consists of three components: a placido disc made up of multiple circles which can be projected onto the corneal surface, a video camera capable of capturing the reflected image of these rings, and a computer with software to digitize the resultant captured images.1–3 The digitized image is broken down to individual points around each circle. The distance of every point is measured from the center of the placido disc image (Fig. 4-2-1). Each point is assigned a position in space and a corneal power relative to a predetermined reference axis. The two most common methods of display are called the axial solution (most commonly used) and the instantaneous radius of curvature (tends to accurately highlight peripheral corneal changes). The result- ing data are displayed as a corneal curvature map, consisting of colors corresponding to corneal power and curvature. Steep contours are dis- played as warm colors (e.g., red), while flat contours correspond to cool colors (e.g., green, blue). Both absolute and normalized maps can be displayed. Absolute maps always assign the same color to the same power, and normalized maps take into account the range of power over a given cornea, ascrib- ing red and yellow colors to the steepest contours and blue and green colors to the flattest contours for that particular cornea. When inter- preting maps, it is important to be cognizant of the scale used. A standard way to present the power of the corneal surface, suggested by Klyce et al., is with the axial power map solution using a scale whose fixed range (30.0–65.5 D) is broad enough to encompass most varia- tions in corneal curvature and whose standard contour interval (1.5 D) will highlight only topographic features of clinical significance.4 Factors that affect the accuracy and reproducibility of corneal topog- raphy maps include quality of the tear film and ocular surface, the ability of the patient to maintain fixation, and operator experience in focusing the images. For instance, a patient with a dry eye will often have a placido disc image with multiple areas of absent or distorted rings, making it impossible to accurately interpret the resultant map. Corneal topography powers displayed are best viewed as estimates and should not be routinely used in planning cataract surgery for intraocular lens calculations.5 Peripheral corneal power estimates are less precise than central measurements. Corneal topography is used primarily as a screening tool to evaluate prospective refractive and cataract surgical candidates and a diagnostic aid in evaluating patients with poor vision following refractive surgery.6–10 Irregular corneas are poor candidates for refractive surgery. Keratoconus and contact lens warpage are the most common causes of irregular cor- neas in the screening population. Steep (i.e., red) areas isolated to the inferior cornea suggest keratoconus. Many topographers come equipped with programs to alert the clinician when a diagnosis of keratoconus is likely (Fig. 4-2-2A,B). Postoperative patients with poor vision should have topography, e.g., irregular ablation profiles, and decentered laser ablations can be assessed with these devices (Fig. 4-2-3).11 Another area where videokeratography plays an important role is the evaluation of patients with significant astigmatism.12,13 Topography images can be helpful in planning interventions such as astigmatic keratotomy, limbal relaxing incisions, or removal of tight sutures post keratoplasty (Fig. 4-2-4). The sensitivity of screening for keratoconus can be enhanced by com- bining topography and tomography (thickness and elevation) data. The abnormal shape characteristic of keratoconus or post-LASIK ectasia is often associated with marked corneal thinning and elevation of the pos- terior surface of the cornea (Fig. 4-2-5, 4-2-6).14,15 Several commercial units are available that combine this data, such as the ORBSCAN® and Visante Omni ®. The Orbscan® makes use of a scanning slit beam to obtain elevation and corneal thickness data while the Visante Omni combines topographic data from a placido disc image (Humphrey Atlas®) with corneal shape and thickness measurements obtained from the Visante OCT® (Ocular Coherence Tomography) unit. WAVEFRONT ANALYSIS This chapter covers some concepts useful in understanding wavefront analysis. The current technology used in refractive surgery examines what happens as light interacts with the optical system of the eye.16,17 A wavefront represents a locus of points that connects all the rays of light emanating from a point source that have the same temporal phase and optical path length. The optical path length specifies the number of times a light wave must oscillate in traveling from one point to another point. If the optical system of the eye is perfect, a point source of light emanating from the back of the eye will create a locus of points with the same optical path length that will exit the pupillary plane in the form of a flat sheet. This represents an unaberrated wavefront. When the cornea or lens has imperfections, optical aberrations are Michael J. Taravella, Richard S. Davidson 4.2Corneal Topography and Wavefront Imaging SECTION 1 Basic Principles PART 4 CORNEA AND OCULAR SURFACE DISEASES Definition: Tools for imaging the cornea. Key features ■ Critical in the evaluation and management of refractive surgery, corneal transplants, and cataract surgery patients ■ Useful in the management of astigmatism and corneal ectasia Fig. 4-2-1 Placido disc image. This image is captured and then digitized for analysis.
- 2. CornealTopographyandWavefrontImaging 4.2 169 Fig. 4-2-2 (A) Keratoconus suspect. Note the bright orange–red area of the map. This represents increased corneal curvature and steepness in the inferior part of the cornea. (B) Contact lens induced inferior corneal changes mimicking keratoconus. Once contact lens wear is stopped, this type of pattern may“normalize”in weeks to months. A B Fig. 4-2-3 Decentered laser ablation pattern. The circular area of blue represents corneal flattening induced by the laser. The pupil is outlined with a black circle. Patients with decentered ablations may have poor vision and be bothered by night vision problems such as glare or ghosting of images. Fig. 4-2-4 Symmetric bowtie pattern typical of high astigmatism.
- 3. 4 170 CORNEAANDOCULARSURFACEDISEASES Fig. 4-2-5 Orbscan quad map of a patient following LASIK. The postop maps are typical for ectasia. The posterior float shows very abnormal elevation of the posterior corneal surface compared to a best-fit sphere. The pachymetry map is notable for corneal thinning in the same area as seen in the posterior float. Fig. 4-2-6 Visante Omni® display of a keratoconus suspect. The top three maps represent the axial power solution for topography, pachymetry and anterior corneal elevation. The bottom three maps represent instantaneous curvature, relative pachymetry, and posterior curvature elevation. Note how the instantaneous curvature map highlights steepening of the peripheral cornea better than the axial solution. This area of the cornea is also thinner than normal (relative pachymetry) and is associated with a corresponding elevation of the posterior cornea. created, causing the wavefront to exit the eye as curved or bent sheets of light. The wavefront aberration of the eye is the difference between the actual wavefront and the ideal flat wavefront. The surface of the wavefront can be characterized by measuring the slope of light rays running perpendicular to it from selected points. This is the basic principle behind the Hartmann–Shack devices com- monly used to measure the wavefront. Wavefronts exiting the pupil plane are allowed to interact with a microlenslet array. If the wavefront is a perfect flat sheet, it will form a perfect lattice of point images cor- responding to the optical axis of each lenslet (Fig. 4-2-7). If the wave- front is aberrated, the local slope of the wavefront will be different for each lenslet and result in a displaced spot on the grid as compared to the ideal. The displacement in location from the actual spot versus the ideal represents a measure of the shape of the wavefront. Once the wavefront image is captured, it can be analyzed. One method of wavefront analysis and classification is to consider each wavefront map to be the weighted sum of fundamental shapes. Zernike and Fourier transforms are polynomial equations that have been adapt- ed for this purpose. Zernike polynomials have proven especially useful since they contain radial components and the shape of the wavefront follows that of the pupil, which is circular. Fourier transforms, however, may prove to be more robust and allow mathematical description of the wavefront with less smoothing effect and greater fidelity.18–20 Illustra- tions of the basic Zernike shapes are shown in Fig. 4-2-8.
- 4. CornealTopographyandWavefrontImaging 4.2 171 Fig. 4-2-7 Schematic of Hartman–Shack device used to capture wavefront data. (Courtesy of AMOVISX.)HARTMANN SHACK outgoing wave CCD camera CCD image lenslet array Fig. 4-2-8 The fundamental Zernike shapes. Complex wavefront maps can be deconstructed to determine the individual contribution of these shapes. Spherical aberration is a fourth-order term and is represented by the central figure in row 4. Coma is a third-order term and is represented by the two central figures in row 3. Fig. 4-2-9 Spherical abberration. SPHERICAL ABBERRATION Fm= marginal focal point FP= paraxial focal point Fm FP The term higher-order optical aberration is replacing the older term irregular astigmatism as wavefront analysis has become more accepted. Lower-order aberrations, such as sphere and cylinder, require lower-order mathematical terms within the polynomial expansion to characterize them and are commonly referred to as second-order aberrations. The most important higher-order terms are spherical aberration (a fourth-order term) and coma (a third-order term). Fortunately, spherical aberration is relatively easy to understand. Light rays entering the central area of a lens are bent less and come to a sharp focus at the focal point of a lens system. Peripheral light rays, however, tend to be bent more by the edge of a given lens system so that in a plus lens, the light rays are focused in front of the normal focal point of the lens and secondary images are created. Many lens systems incorporate an aspheric grind, so that the periphery of the lens system gradually tapers and refracts or bends light to a lesser degree than if this optical adaptation was not included (Fig. 4-2-9). Unlike corneal topography, which measures the shape of the cornea, wavefront technology represents a snapshot of the entire optical system of the eye. It can be affected by pupil size, vitreous or lens opacities, and the quality of the tear film.
- 5. 4 172 CORNEAANDOCULARSURFACEDISEASES Fig. 4-2-10 Normal wavefront map. The left side of the map shows total aberrations including nearsightedness and astigmatism. The right side represents higher-order optical aberrations only. Fig. 4-2-11 Wavefront map of a patient with post-LASIK night vision problems. The patient complaints are most likely due to spherical aberration. Wavefront maps are commonly displayed as two-dimensional maps. The color green indicates minimal wavefront distortion from the ideal, while blue is characteristic of myopic wavefronts and red is character- istic of hyperopic wavefront errors. Like topography, wavefront maps are a two-dimensional attempt to display a complex three-dimensional shape. A normal wavefront is displayed in Fig. 4-2-10. The Root Mean Square (or RMS) value is a useful way of quantifying the wavefront error and comparing it to normal. This number can be calculated for the wavefront as a whole or as individual components of the wavefront when it is deconstructed into individual Zernicke terms. The RMS value is calculated in microns. Although normal values have not been published for all aberrations, RMS values approaching 1.0 for individual aberrations are considered abnormal. Wavefront technology has come to the forefront in laser vision cor- rection for refractive errors. Traditional, or non-custom laser ablation patterns tend to induce spherical aberration; the higher the degree of correction, the greater the induction of this optical error (Fig. 4-2-11). During the day, the pupil size tends to limit the effect of spherical aberration, since peripheral light rays are blocked. At night, as the pupil enlarges in dark or scotopic conditions, these light rays enter the eye and can create a blurred focal point and secondary images. Such aber- rations are thought to be one of the leading causes of night vision symptoms and poor quality vision in low light, when the pupil is dilated.21–24 Custom laser treatments incorporate a specific wavefront-designed algorithm to help limit the induction of spherical aberration (see Chapter 3.6).25,26 SUMMARY In summary, corneal topography and wavefront analysis are important tools for the ophthalmologist involved in cornea and lens-based refrac- tive surgery. A basic understanding of both modalities is essential for screening patients, avoiding serious complications, and maximizing outcomes.27,28 KEY REFERENCES Cairns G, McGhee, Charles NJ. Orbscan computerized topography: Attributes, applications, and limitations. J Cataract Refract Surg 2005;31:206–20. Klyce SD. Wavefront analysis. Focal Points 2005;23(10). Maguire, LJ. Computerized corneal analysis. Focal Points 1996;14(5). McCormick GJ, Porter J, Cox IG, et al. Higher-order aberrations in eyes with irregular corneas after laser refractive surgery. Ophthalmology 2005;112:1699–709. Petrauskas J. Reinventing refraction with wavefront technology. EyeNet 2000;4:33–5. Pop M, Payette Y. Risk factors for night vision complaints after LASIK for myopia. Ophthalmology 2004;111:3–10. Rabinowitz YS, McDonnell PJ. Computer-assisted corneal topography in keratoconus. Refract Corneal Surg 1989;5:400. Smolek MK, Klyce SD, Hovis JK. The Universal Standard Scale: proposed improvements to the American National Standards (ANSI) scale for corneal topography. Ophthalmology 2002;109:361–9. Wilson SE, Klyce SD. Screening for corneal topographic abnormalities before refractive surgery. Ophthalmology 1994;101:147–52. Wilson SE, Lin DT, Klyce SD, et al. Topographic changes in contact lens-induced corneal warpage. Ophthalmology 1990;97:734. Access the complete reference list online at
- 6. CornealTopographyandWavefrontImaging 4.2 172.e1 REFERENCES 1. Maguire, LJ. Computerized corneal analysis. Focal Points 1996;14 (5). 2. Maquire LJ, Singer DE, Klyce SD. Graphic presentation of computer-analyzed keratoscope photographs. Arch Ophthalmol 1987;105:221–30. 3. Wilson SE, Klyce SD. Quantitative descriptors of corneal topography: a clinical study. Arch Ophthalmol 1991;109:349–53. 4. Smolek MK, Klyce SD, Hovis JK. The Universal Standard Scale: proposed improvements to the American National Standards (ANSI) scale for corneal topography. Ophthalmology 2002;109:361–9. 5. Koch DD, Wakil JS, Samuleson SW, et al. Comparison of the accuracy and reproducibility of the keratometer and the EyeSys Corneal Analysis System Model I. J Cataract Refract Surg 1992;18:342–7. 6. Wilson SE, Klyce SD. Screening for corneal topographic abnormalities before refractive surgery. Ophthalmology 1994;101; 147–52. 7. Smolek MK, Klyce SD, Maeda N. Keratoconus and contact lens-induced corneal warpage analysis using the keratomorphic diagram. Invest Ophthal Vis Sci 1994;35:4192–204. 8. Wilson SE, Lin DT, Klyce, SD, et al. Topographic changes in contact lens-induced corneal warpage. Ophthalmology 1990;97:734. 9. Maeda N, Klyce SD, Smolek MK, et al. Automated keratoconus screening with corneal topography analysis. Invest Ophthalmol Vis Sci. 1994. 35:2749–57. 10. Rabinowitz YS, McDonnell PJ. Computer-assisted corneal topography in keratoconus. Refract Corneal Surg 1989;5:400. 11. Cavanaugh TB, Durrie DS, Riedel SM, et al. Centration of excimer laser photorefractive keratectomy relative to the pupil. J Cataract Refract Surg 1993;(Suppl 19):144. 12. Harris DJ Jr, Waring GO III, Burk LI. Keratography as a guide to selective suture removal for the reduction of astigmatism after penetrating keratoplasty. Ophthalmology 1989;96: 1597–607. 13. Frangieh GT, Kwitko, MD, McDonnell PJ. Prospective corneal topographic analysis in surgery for postkeratoplasty astigmatism. Arch Opthalmol 1991;109:506–10. 14. Cairns G, McGhee, Charles NJ. Orbscan computerized topography: attributes, applications, and limitations. J Cataract Refract Surg 2005;31:206–20. 15. Rao SN, Raviv T, Majmudar PA, et al. Role of Orbscan II in screening keratoconus suspects before refractive corneal surgery. Ophthalmology 2002;109:1642–6. 16. Petrauskas J. Reinventing refraction with wave front technology. EyeNet 2000;4:33–5. 17. Chalita MR, Finkenthal J, Xu M. LADARWave wavefront measurement in normal eyes. J Refract Surg 2004;20:132–8. 18. Thibos LN, Applegate RA. Assessment of optical quality. In: Customized corneal ablation: the quest for supervision. Thorofare, NJ: Slack, Inc.; 2001. p. 67–78. 19. Smolek MK, Klyce SD. Goodness-of-prediction of Zernike polynomial fitting to corneal surfaces. J Cataract Refract Surg 2005;31:2350–5. 20. Klyce SD, Karon MD, Smolek MK. Advantages and disadvantages of the Zernike expansion for representing wave aberration of the normal and aberrated eye. J Refract Surg 2004;2:S494–4. 21. Pop M, Payette Y. Risk factors for night vision complaints after LASIK for myopia. Ophthalmology 2004;111:3–10. 22. Yamane N, Miyata K, Samejima T, et al. Ocular higher-order aberrations and contrast sensitivity after conventional laser in situ keratomileusis. Invest Ophthalmol Vis Sci 2004;45:3986–90. 23. Kohnen T, Mahmoud K, Buhren J. Comparison of corneal higher-order aberrations induced by myopic and hyperopic LASIK. Ophthalmology 2005;112:1692. 24. McCormick GJ, Porter J, Cox IG, et al. Higher-order aberrations in eyes with irregular corneas after laser refractive surgery. Ophthalmology 2005;112:1699–709. 25. Klyce SD. Wavefront analysis. Focal Points 2005;23(10). 26. Gianco RM, Rocha KM, Santhiago MR, et al. Applications of wavefront technology. J Cat Refract Surg 2012;38:1671–83. 27. Rao SK, Padmanabhan P. Understanding corneal topography. Curr Opin Ophthalmol 2000;11:248–59. 28. Belin MW, Khachikian SS. An introduction to understanding elevation based topography: how elevation data are displayed – a review. Clin Exp Ophthalmol 2009;37:14–9.