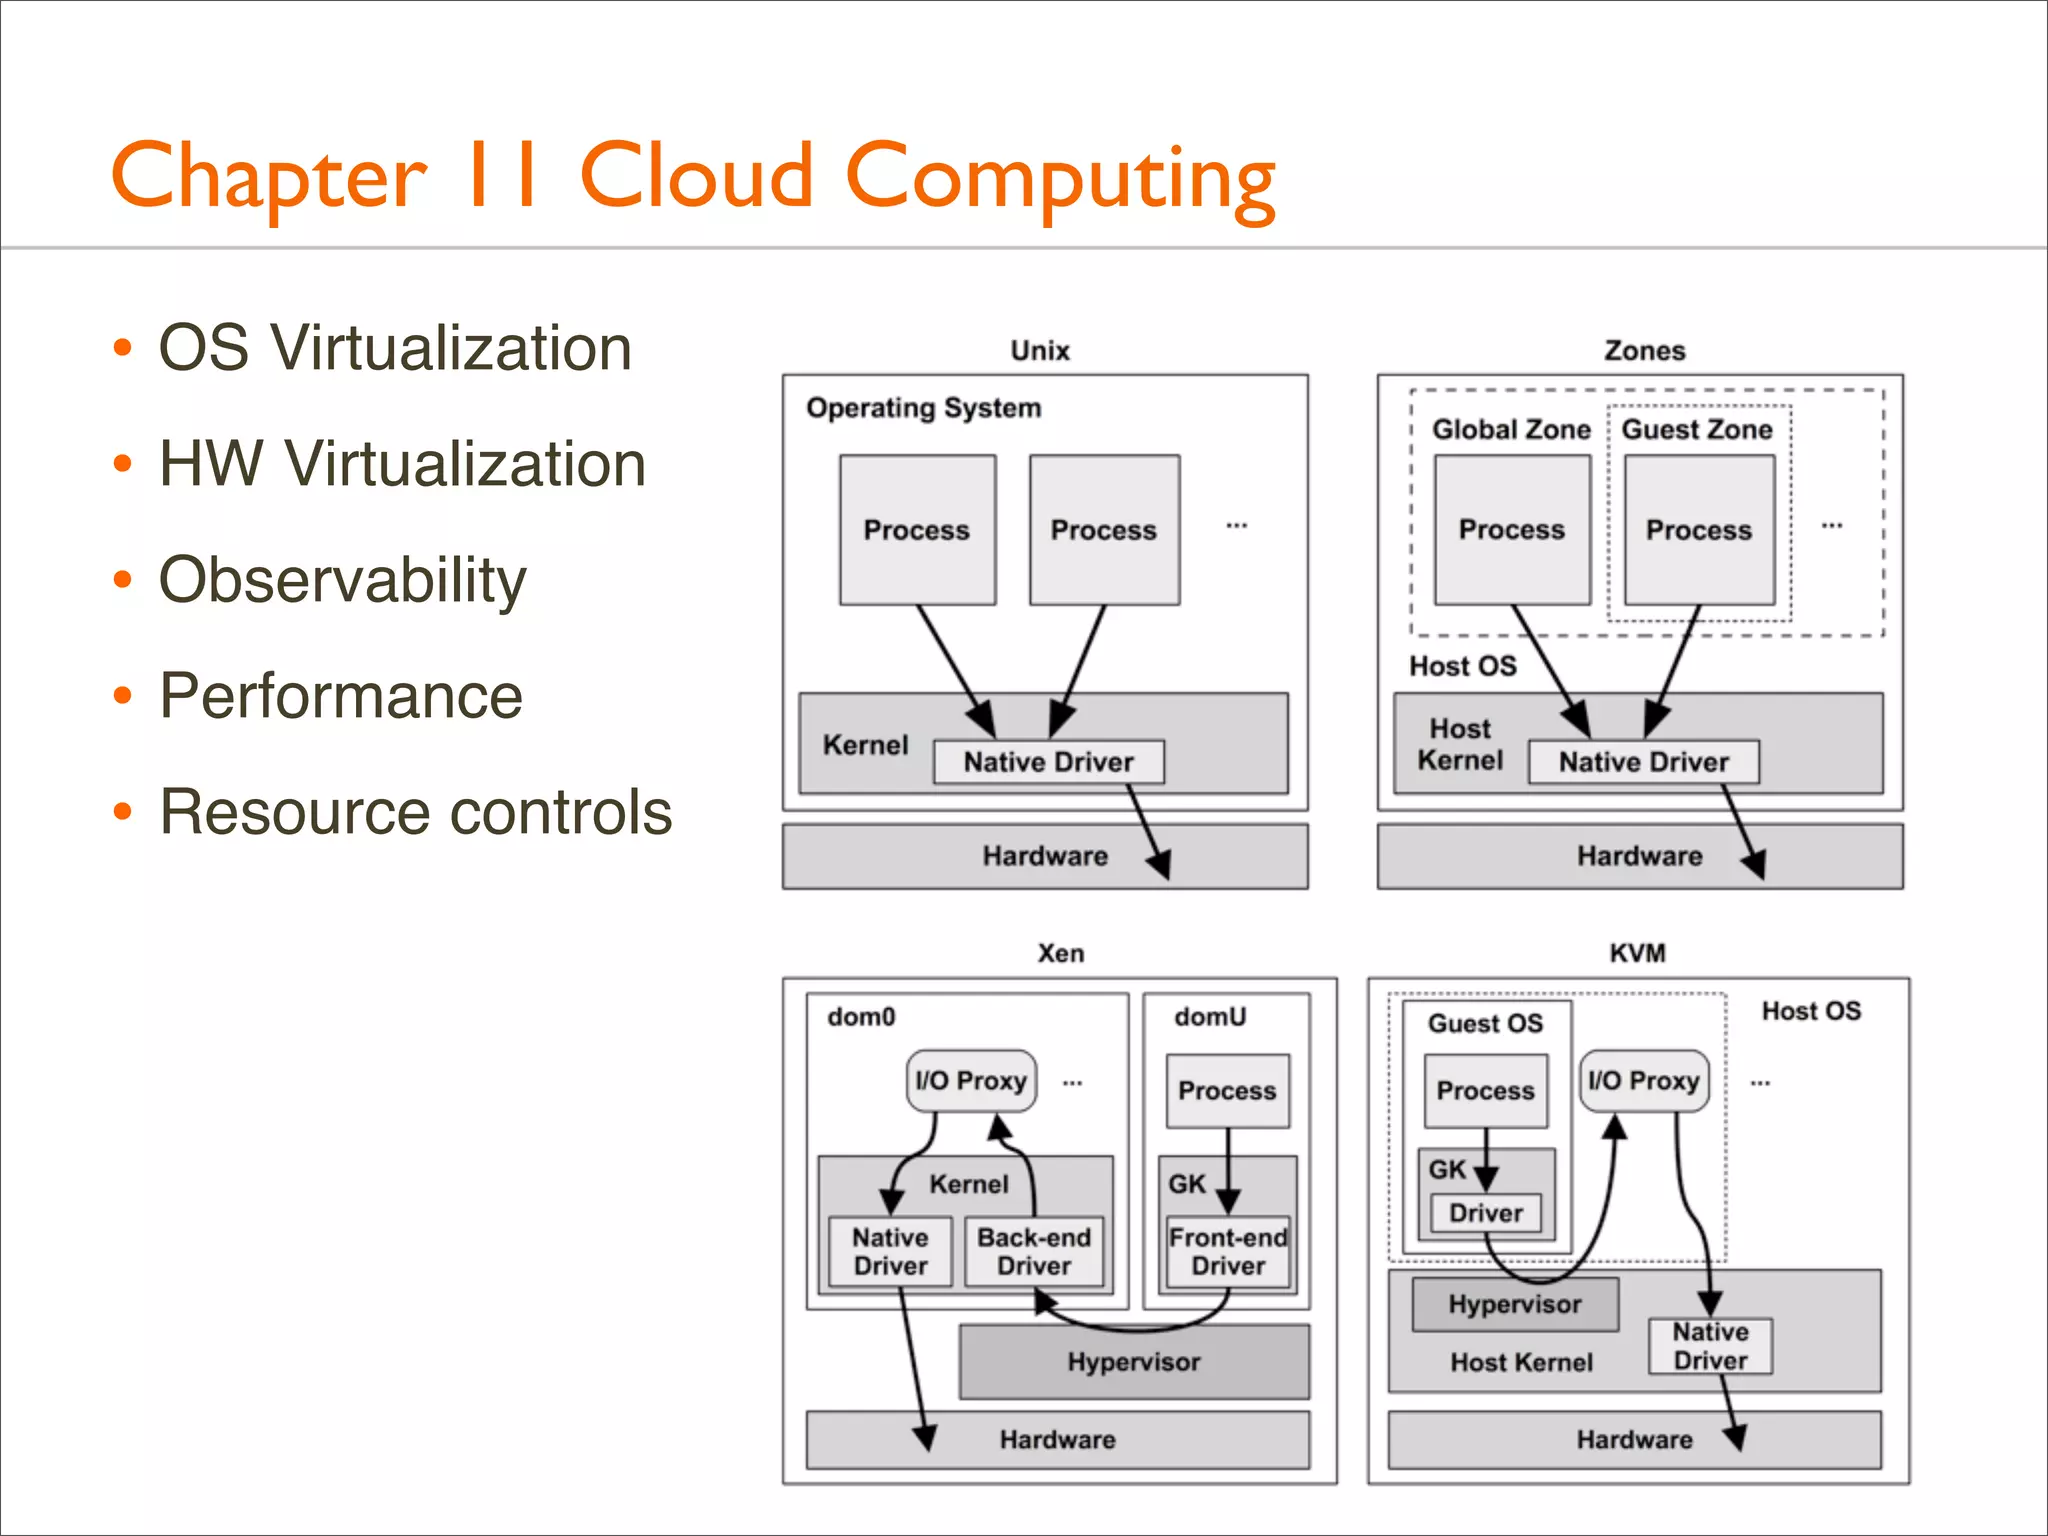
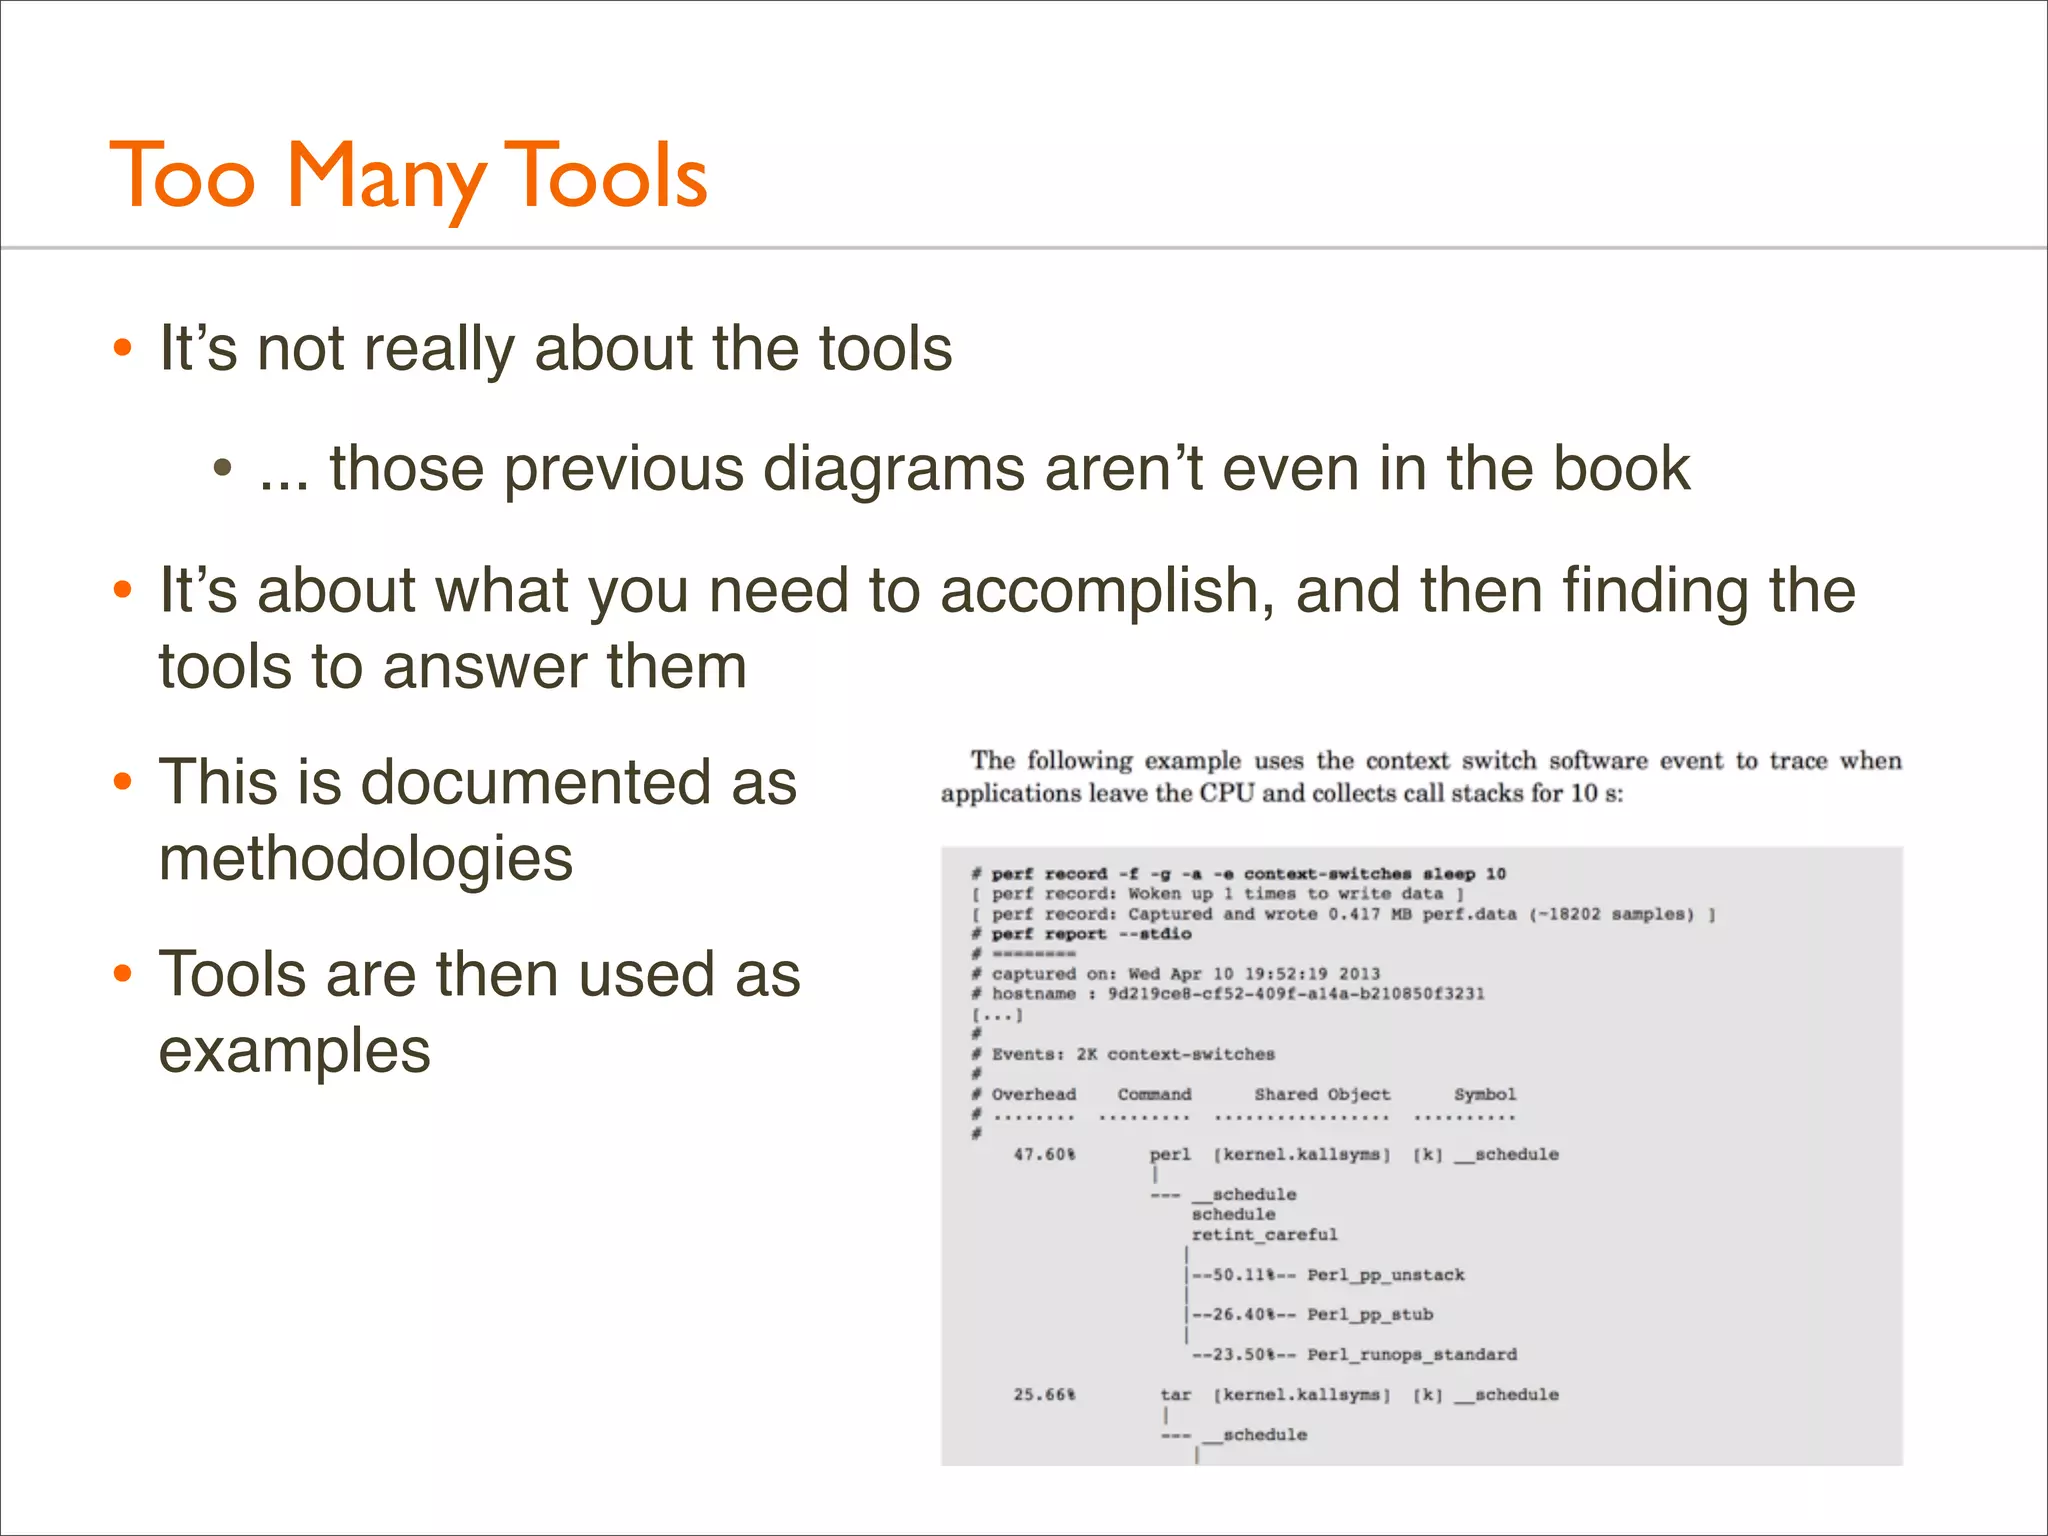
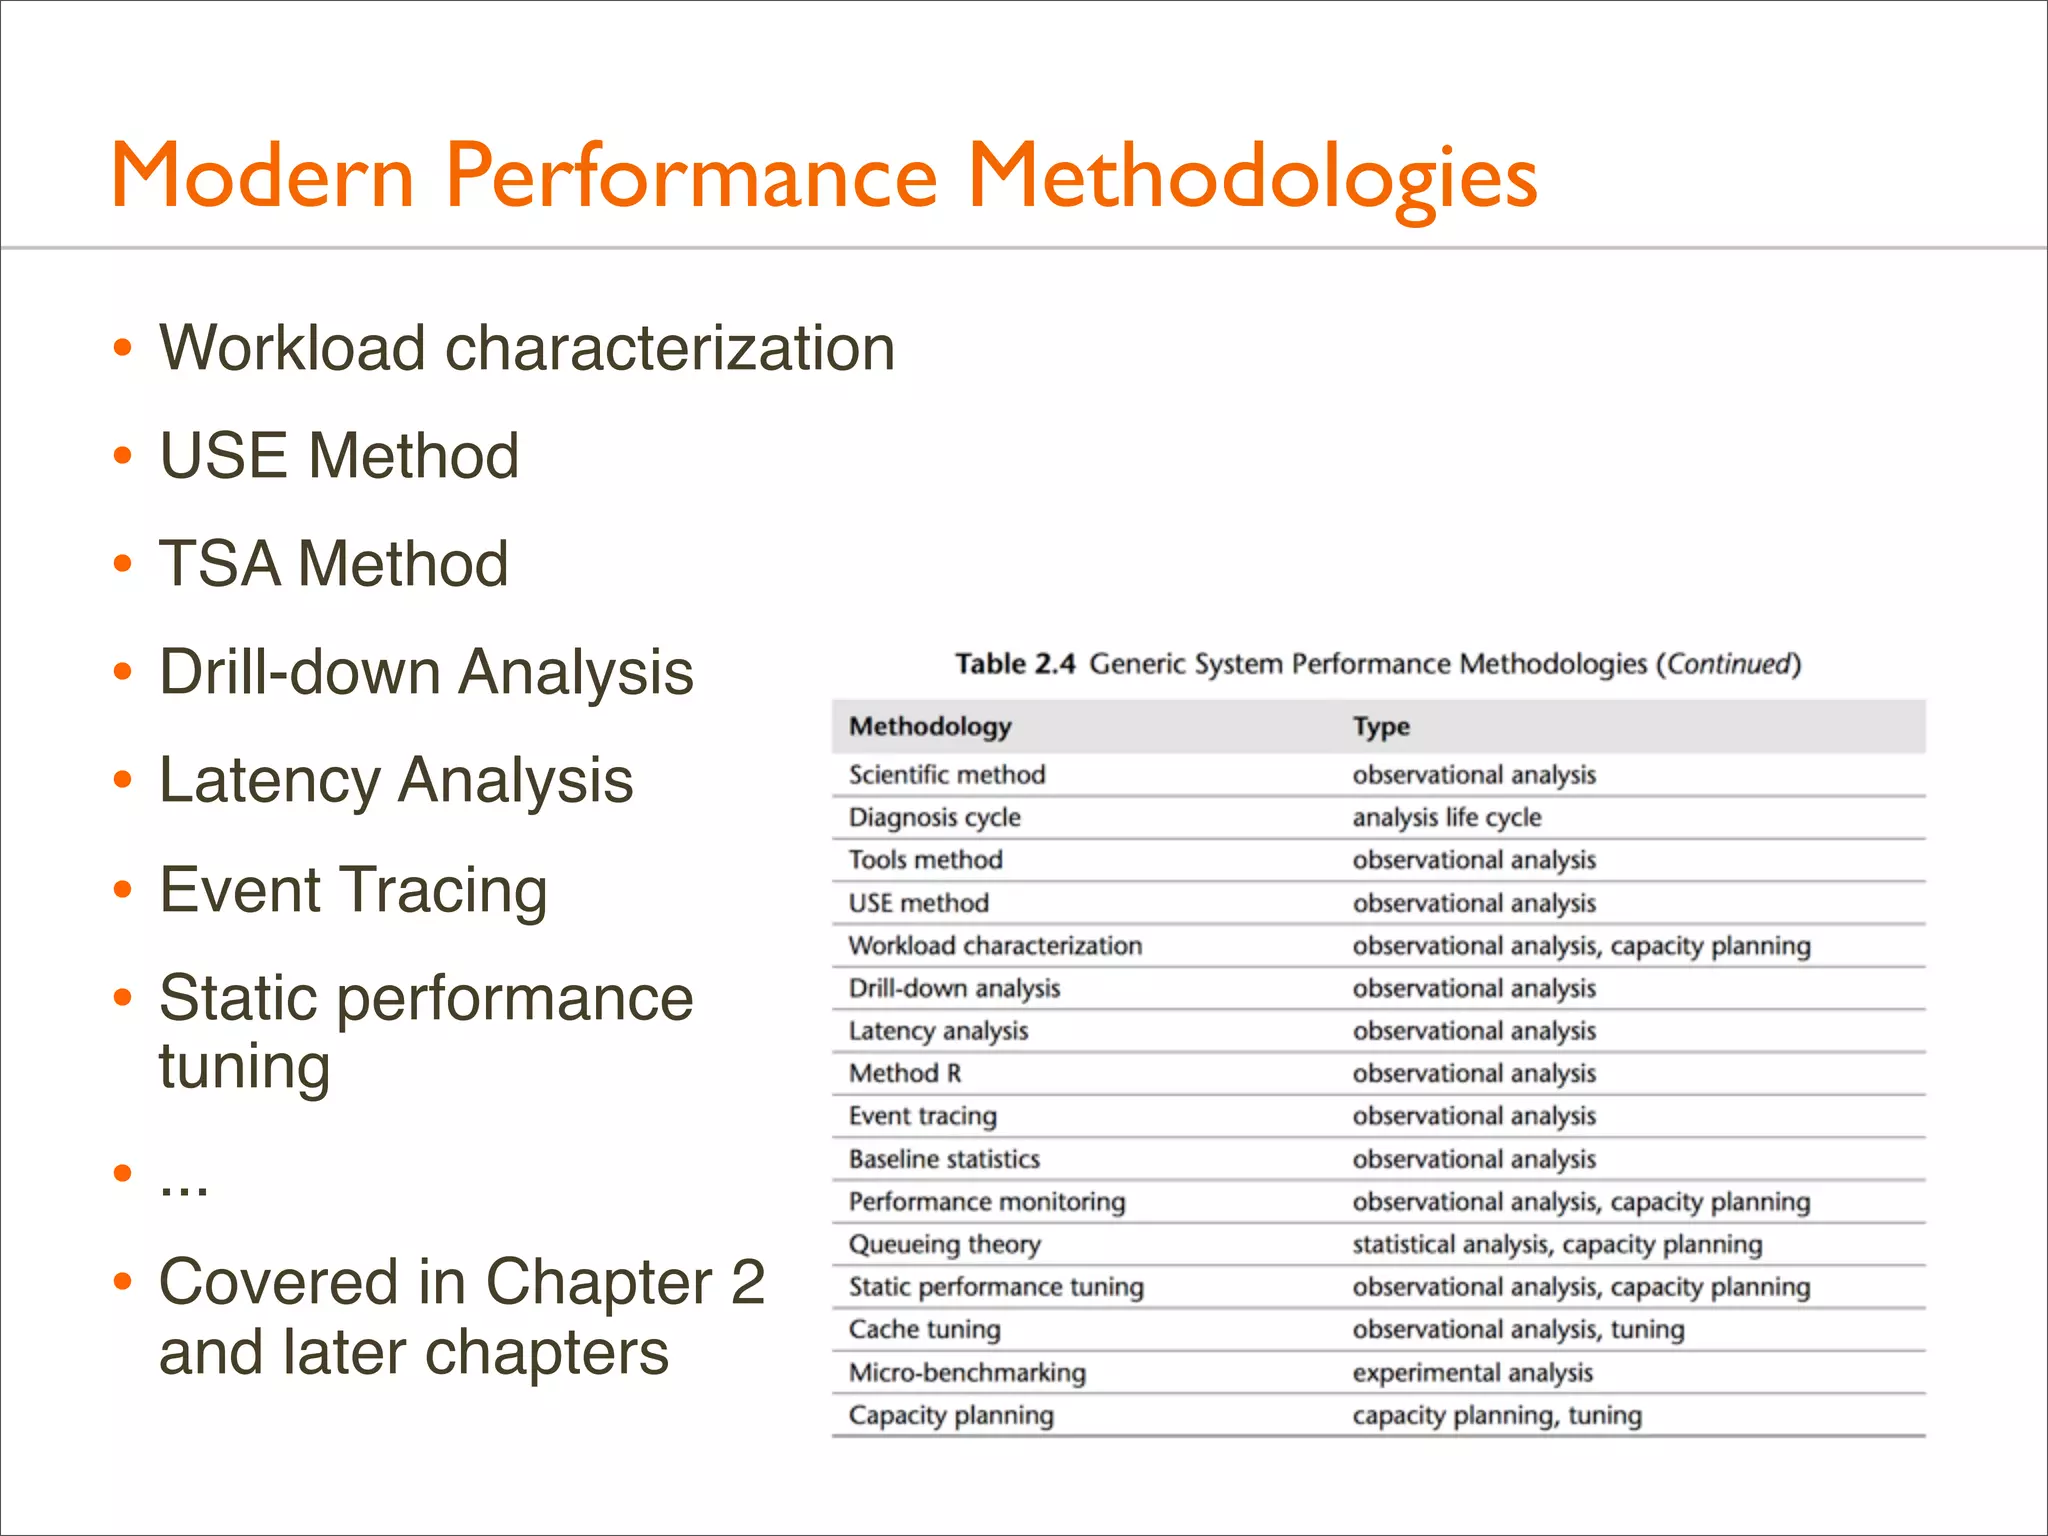
Download as PDF, PPTX
![1990’s Systems Performance
* Proprietary Unix, closed source, static tools
$ vmstat 1
kthr
memory
r b w
swap free re
0 0 0 8475356 565176 2
1 0 0 7983772 119164 0
0 0 0 8046208 181600 0
[...]
*
*
*
*
*
mf
8
0
0
page
disk
faults
cpu
pi po fr de sr cd cd s0 s5
in
sy
cs us sy id
0 0 0 0 1 0 0 -0 13 378 101 142 0 0 99
0 0 0 0 0 224 0 0 0 1175 5654 1196 1 15 84
0 0 0 0 0 322 0 0 0 1473 6931 1360 1 7 92
Limited metrics and documentation
Some perf issues could not be solved
Analysis methodology constrained by tools
Perf experts used inference and experimentation
Literature is still around](https://image.slidesharecdn.com/systemsperformancebookbaylisa-131017231159-phpapp01/75/Systems-Performance-Enterprise-and-the-Cloud-16-2048.jpg)
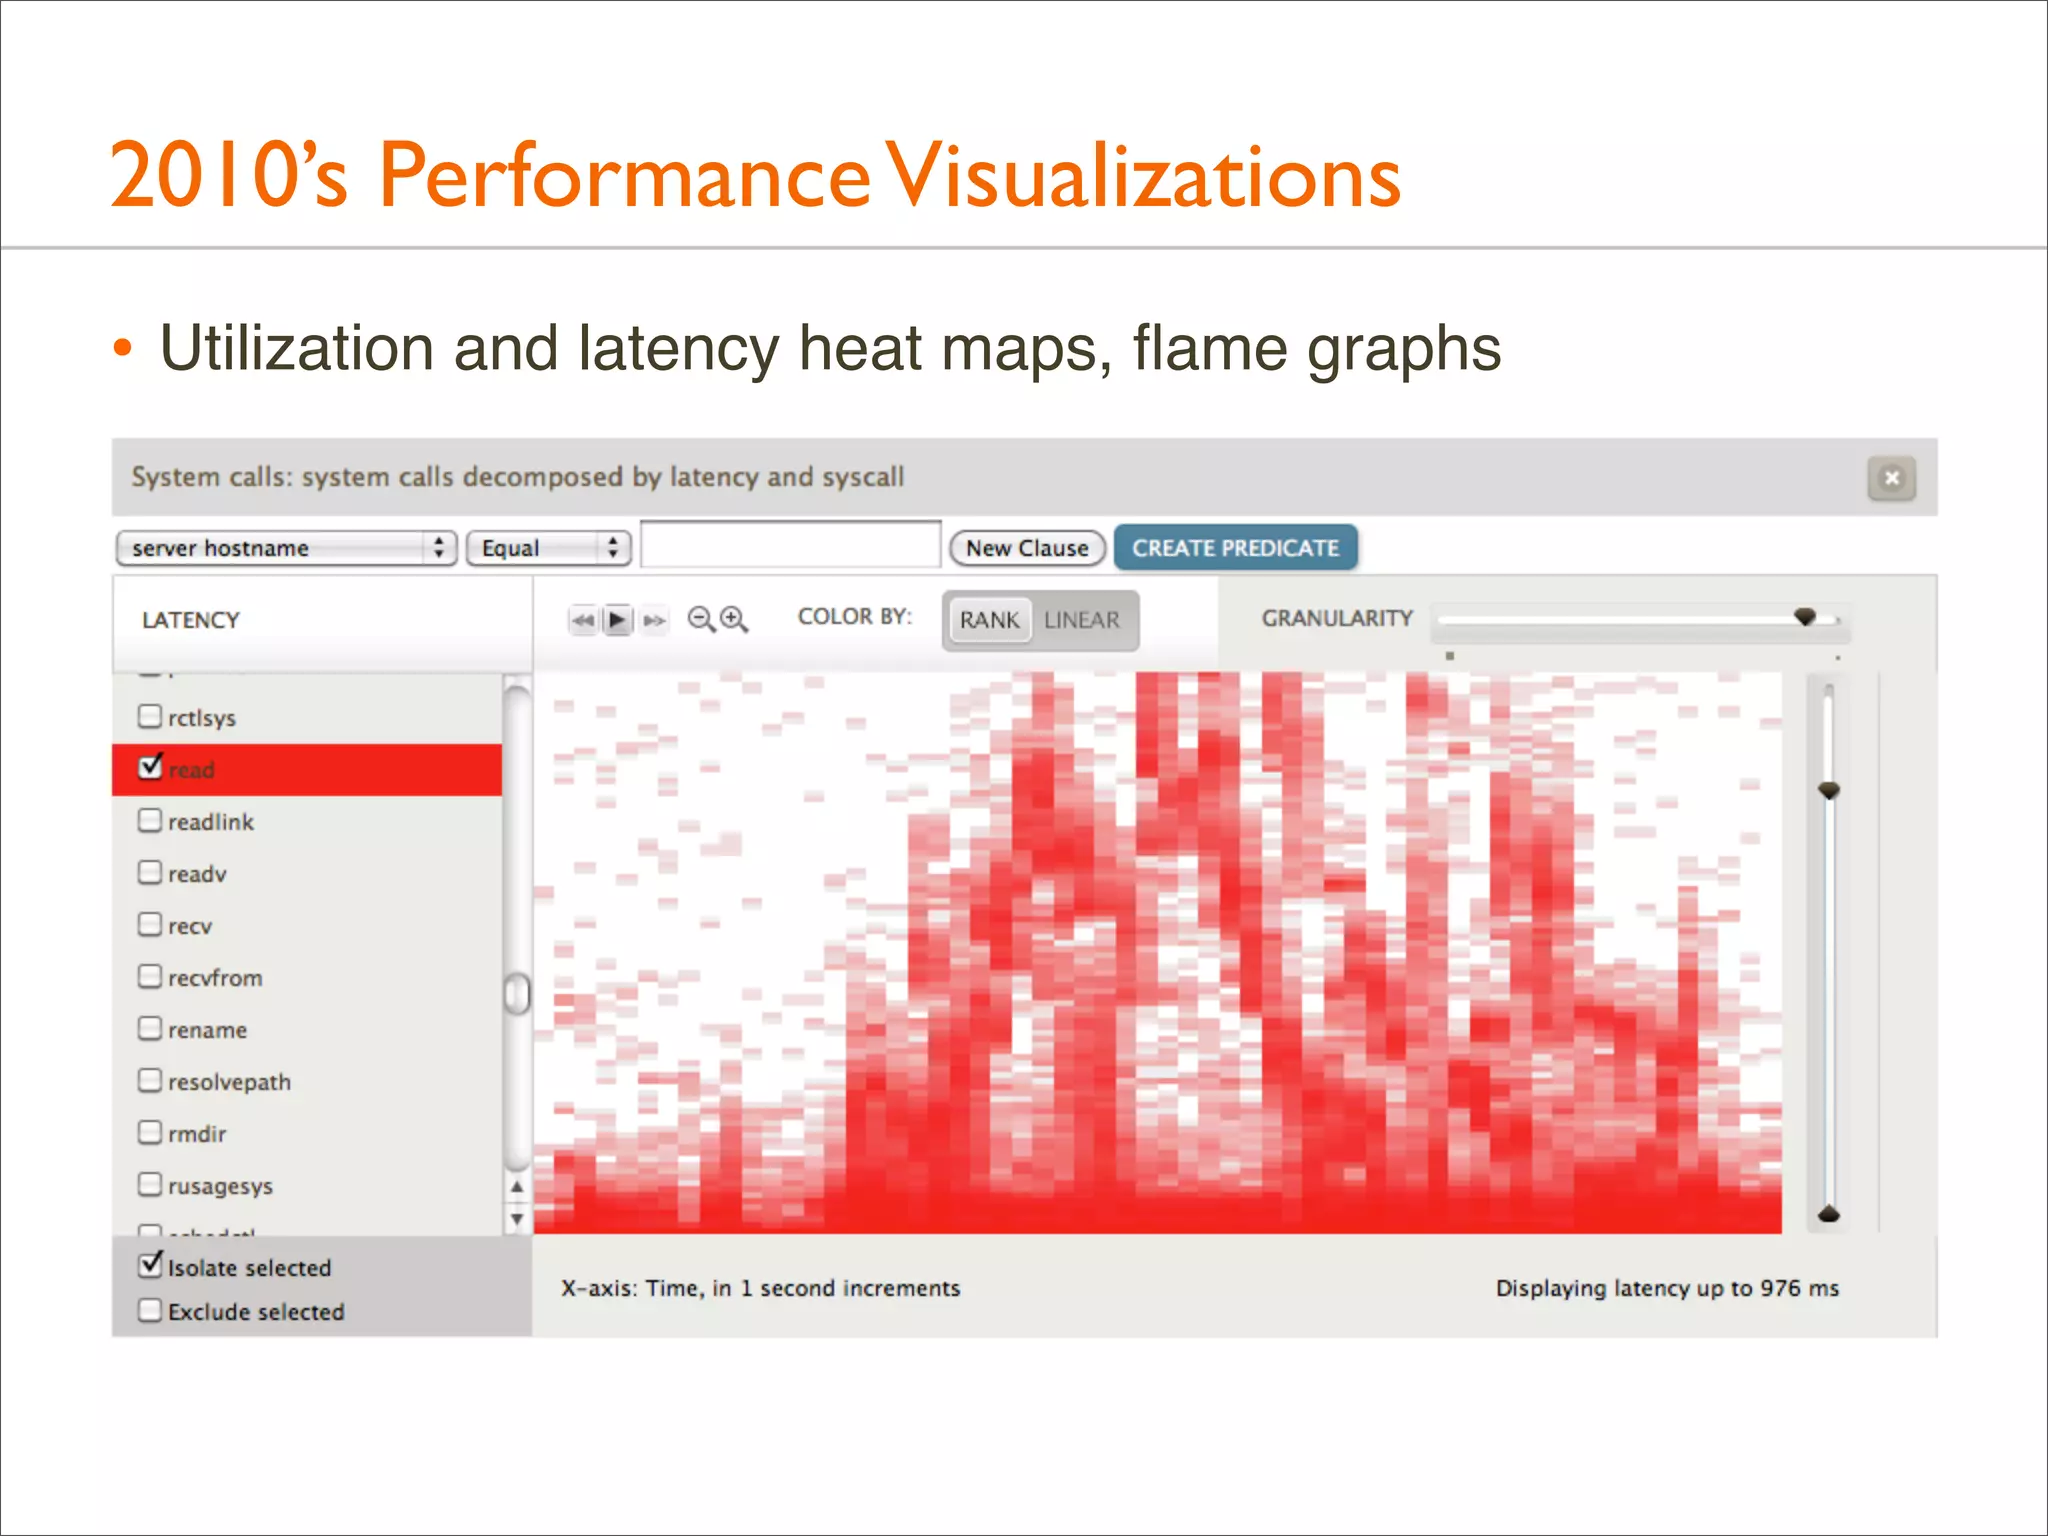
![1990’s Performance Visualizations
Text-based and line graphs
$ iostat -x 1
device
sd0
sd5
sd12
sd12
sd13
sd14
sd15
sd16
nfs6
[...]
r/s
0.0
0.0
0.0
0.0
0.0
0.0
0.0
0.0
0.0
extended device statistics
w/s
kr/s
kw/s wait actv
0.1
5.2
3.9 0.0 0.0
0.0
0.0
0.0 0.0 0.0
0.2
0.2
1.1 0.0 0.0
0.0
0.0
0.0 0.0 0.0
0.0
0.0
0.0 0.0 0.0
0.0
0.0
0.0 0.0 0.0
0.0
0.0
0.0 0.0 0.0
0.0
0.0
0.0 0.0 0.0
0.0
0.0
0.0 0.0 0.0
svc_t
69.8
1.1
3.1
0.0
0.0
1.9
0.0
0.0
0.0
%w
0
0
0
0
0
0
0
0
0
%b
0
0
0
0
0
0
0
0
0](https://image.slidesharecdn.com/systemsperformancebookbaylisa-131017231159-phpapp01/75/Systems-Performance-Enterprise-and-the-Cloud-18-2048.jpg)
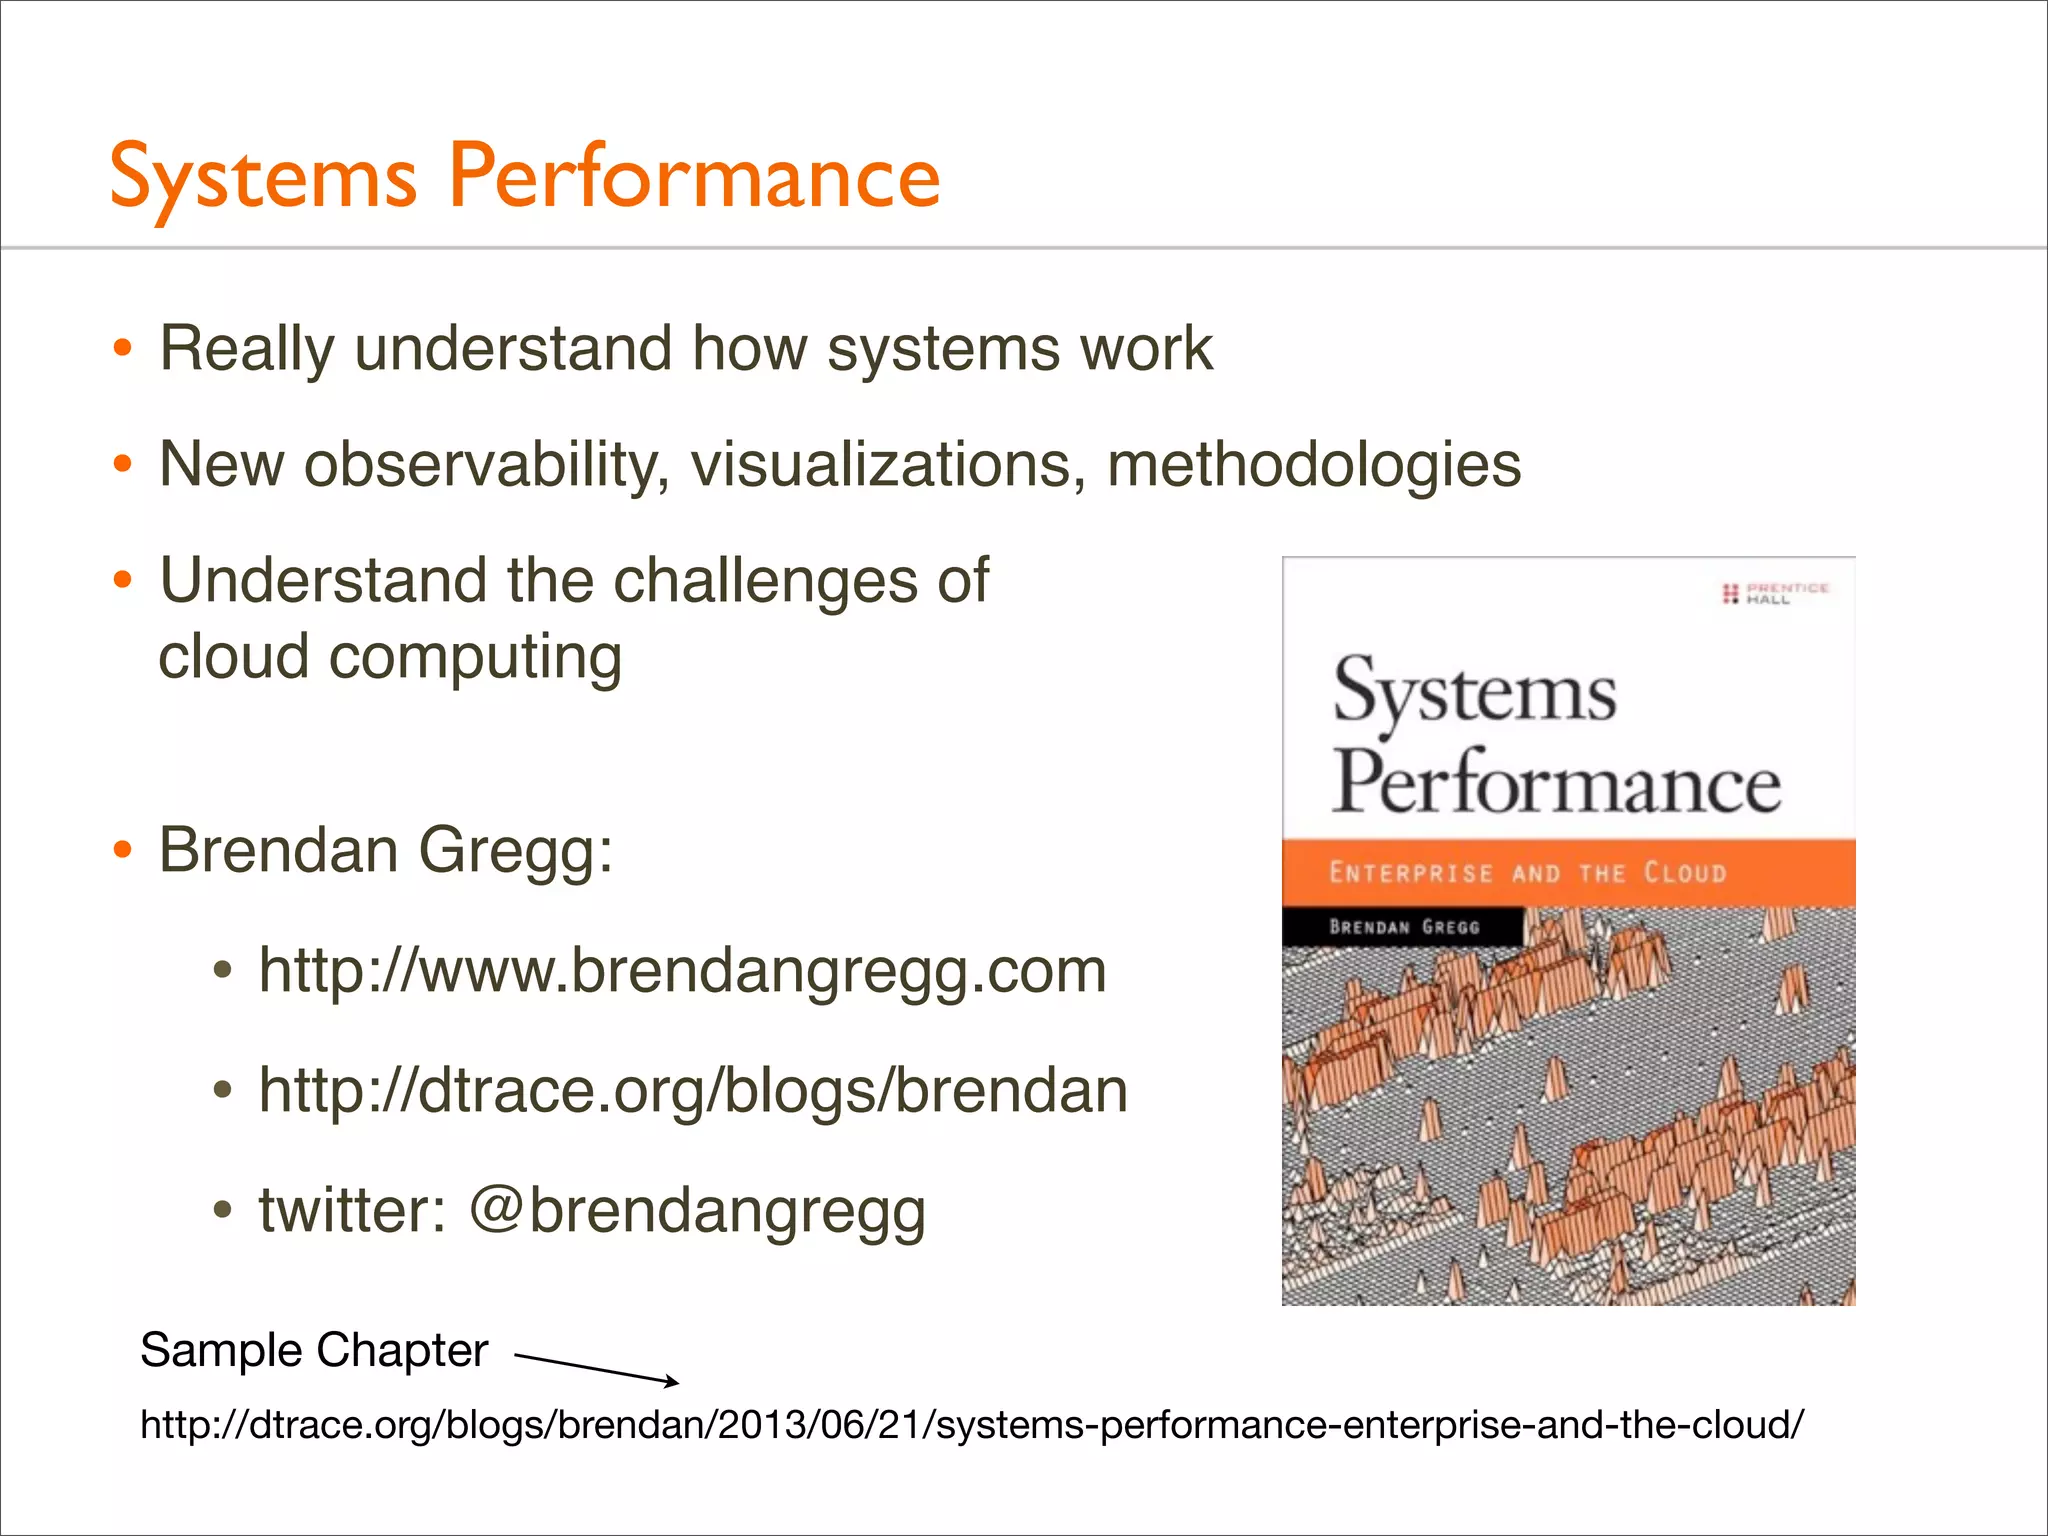

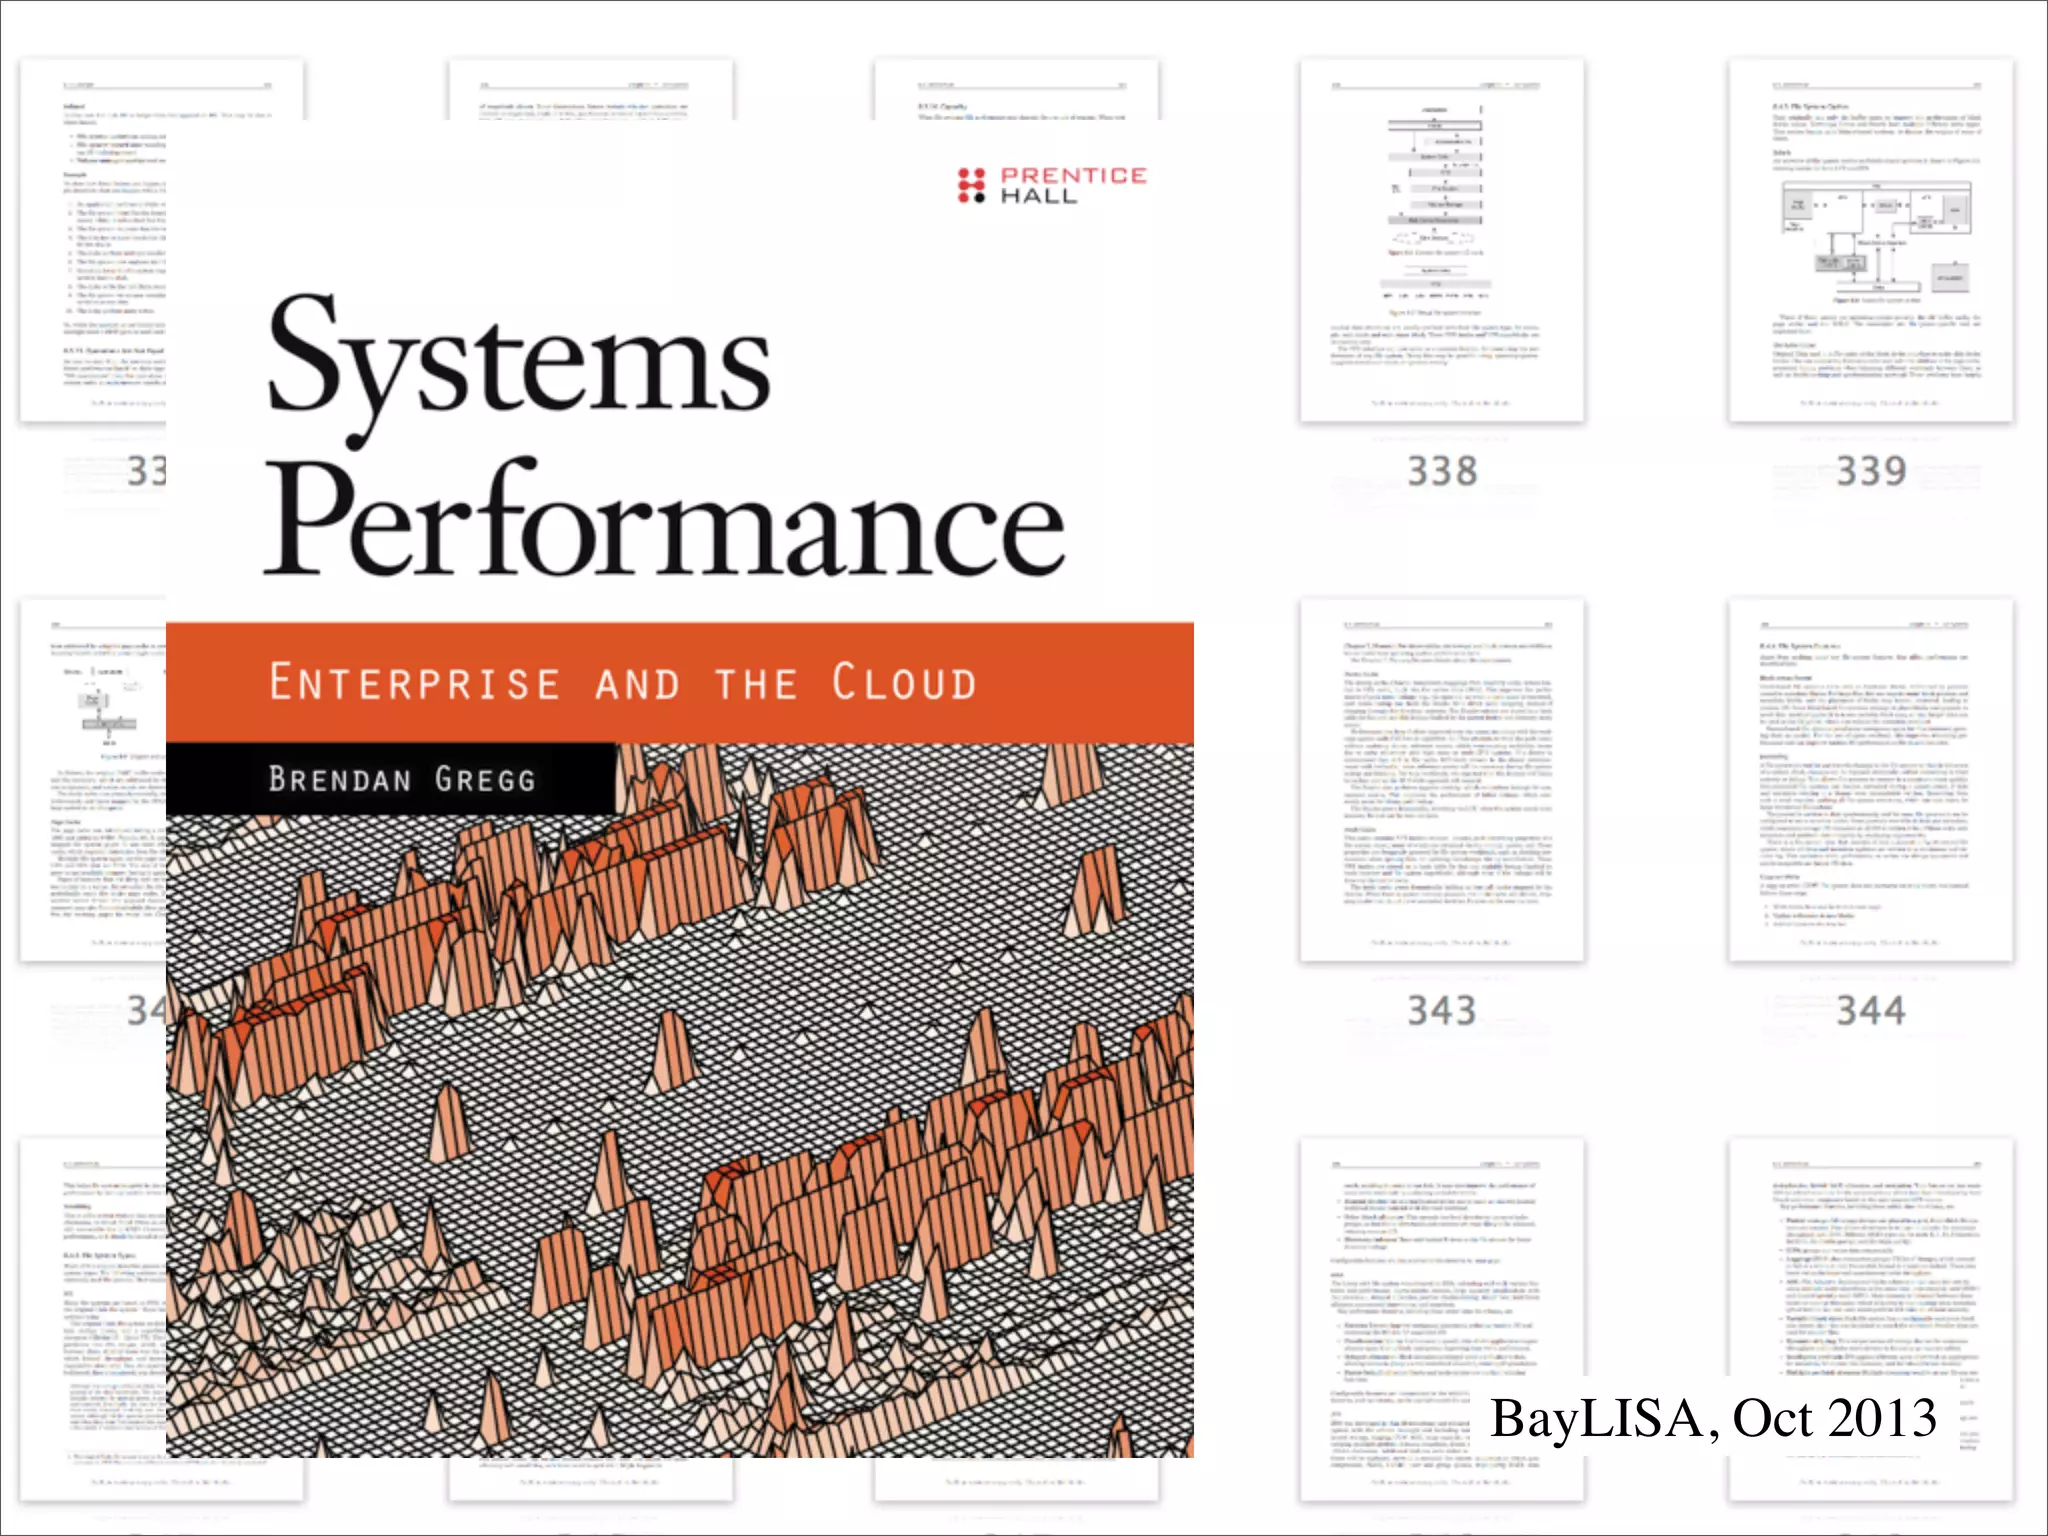
The document outlines the book 'Systems Performance: Enterprise and the Cloud' by Brendan Gregg, focusing on modern systems performance analysis across various platforms including Linux and Illumos. It highlights methodologies, tools, and visualizations to diagnose and maximize system application performance, particularly in cloud environments. The book serves as both a practical guide for professionals and a reference for teaching system administration and performance techniques.