Downloaded 311 times


![DTrace and Zones, cont.
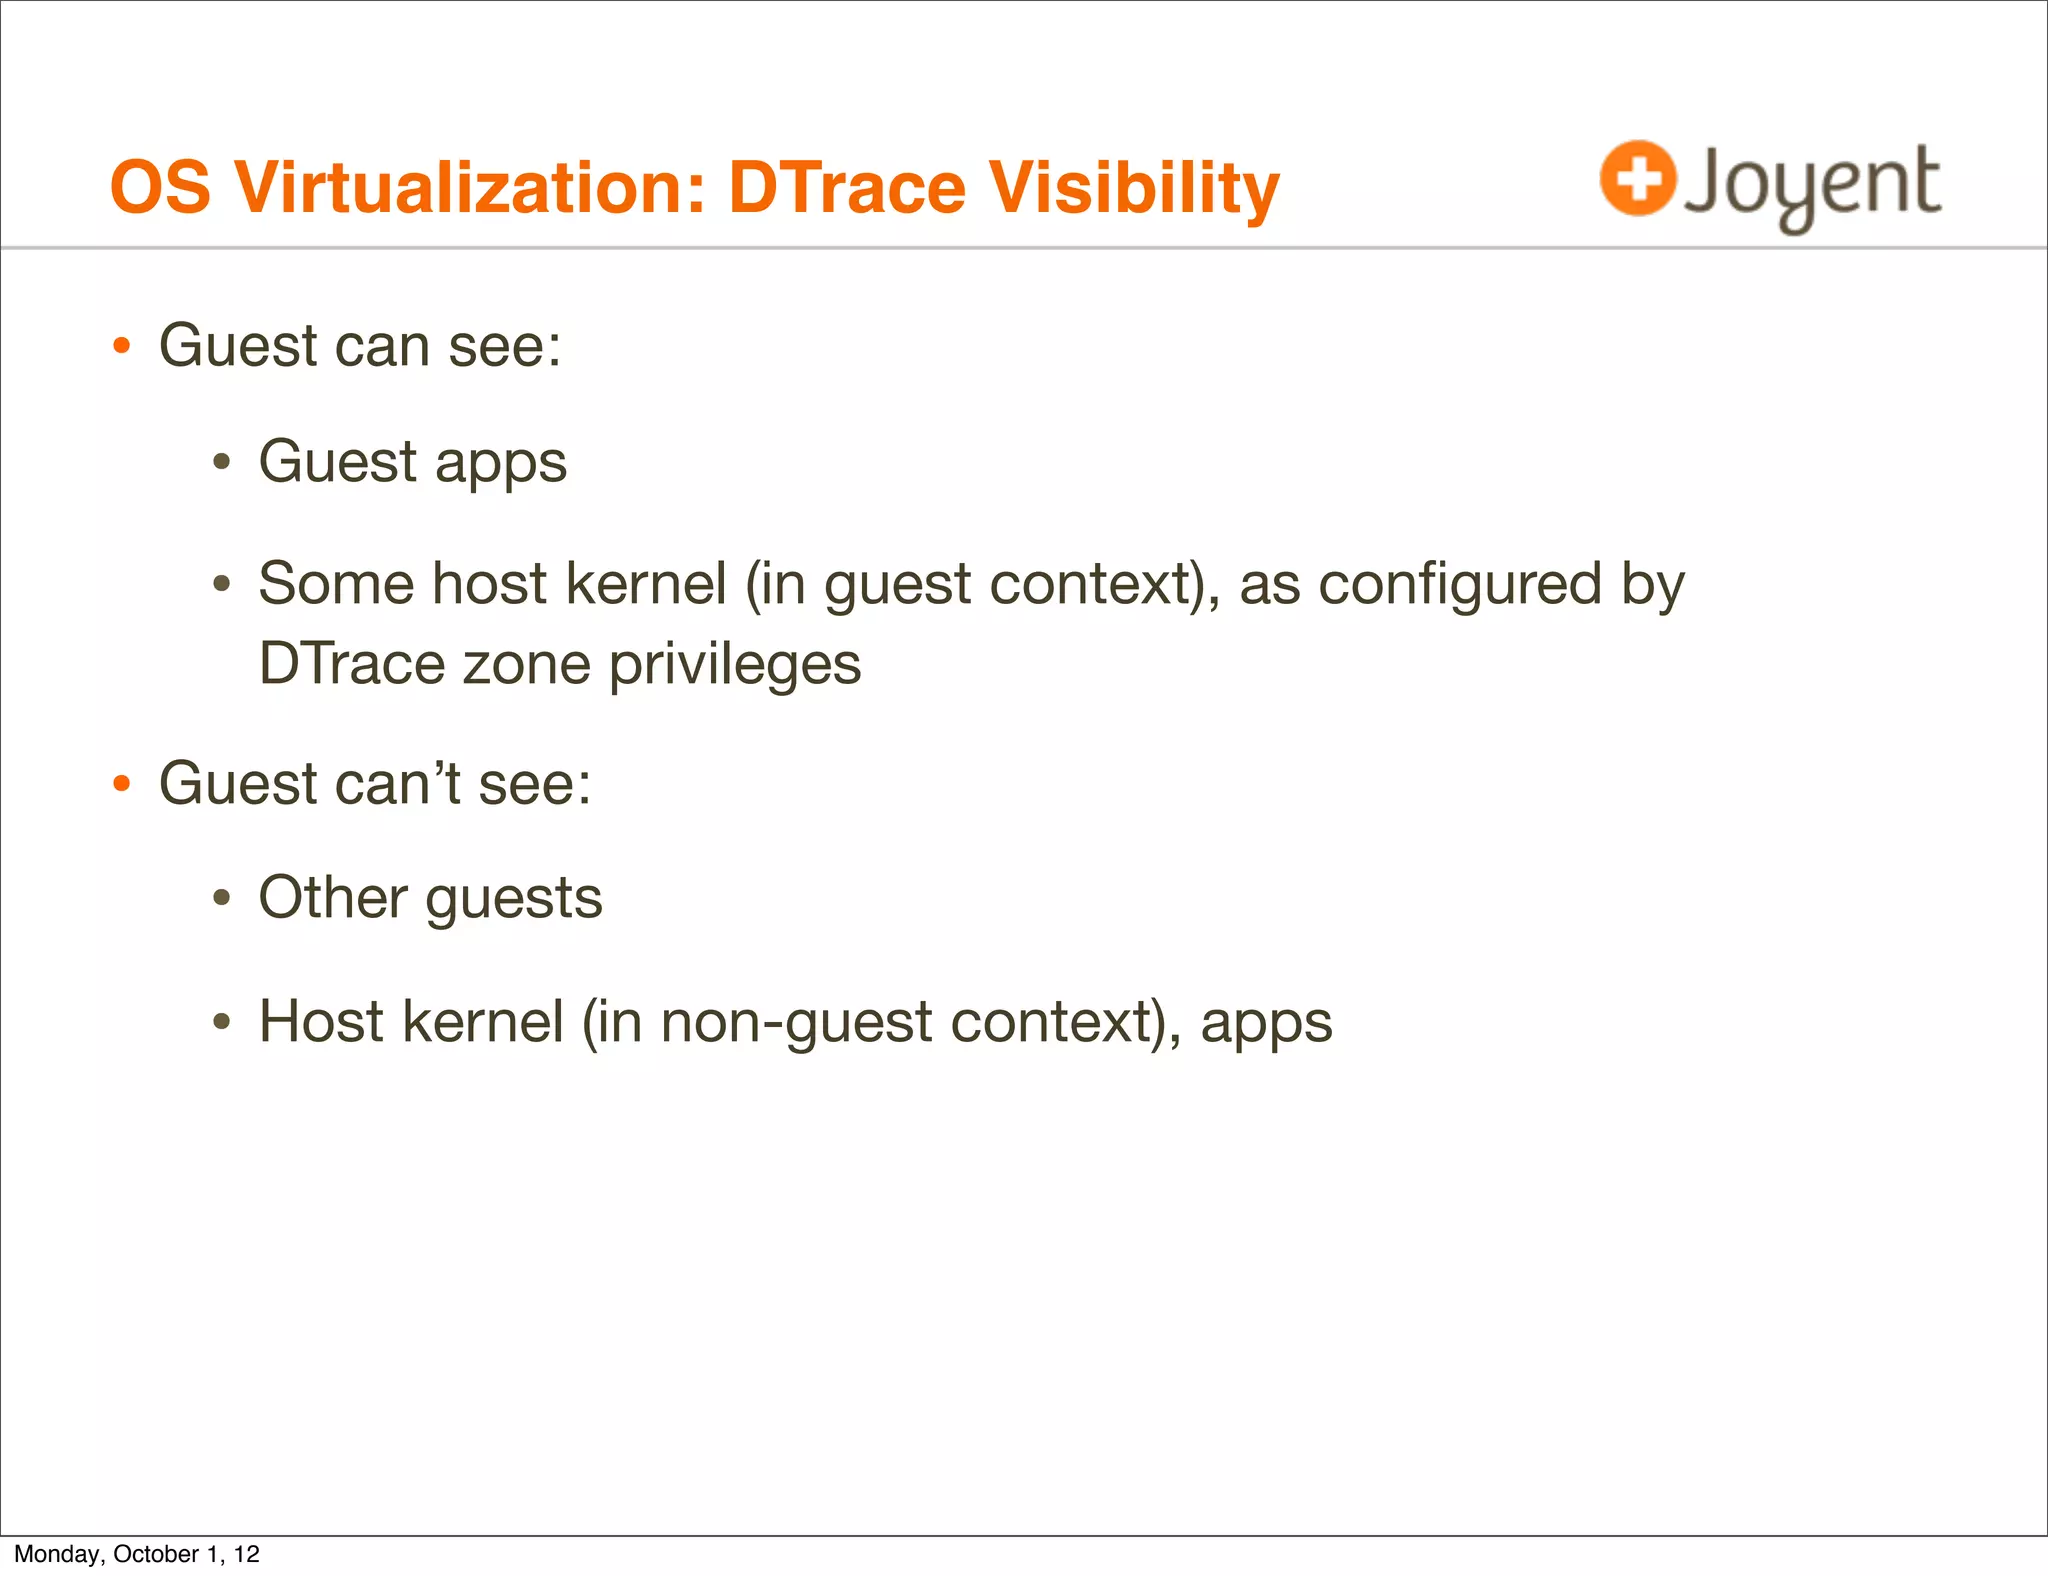
• GZ DTrace works well.
• We found many issues in practice with NGZ DTrace:
• Can’t read fds[] to translate file descriptors. Makes using the
syscall provider more difficult.
# dtrace -n 'syscall::read:entry /fds[arg0].fi_fs == "zfs"/ { @ =
quantize(arg2); }'
dtrace: description 'syscall::read:entry ' matched 1 probe
dtrace: error on enabled probe ID 1 (ID 4: syscall::read:entry): invalid
kernel access in predicate at DIF offset 64
dtrace: error on enabled probe ID 1 (ID 4: syscall::read:entry): invalid
kernel access in predicate at DIF offset 64
dtrace: error on enabled probe ID 1 (ID 4: syscall::read:entry): invalid
kernel access in predicate at DIF offset 64
dtrace: error on enabled probe ID 1 (ID 4: syscall::read:entry): invalid
kernel access in predicate at DIF offset 64
[...]
Monday, October 1, 12](https://image.slidesharecdn.com/dtracecloud2012-121001163711-phpapp02/75/DTraceCloud2012-28-2048.jpg)
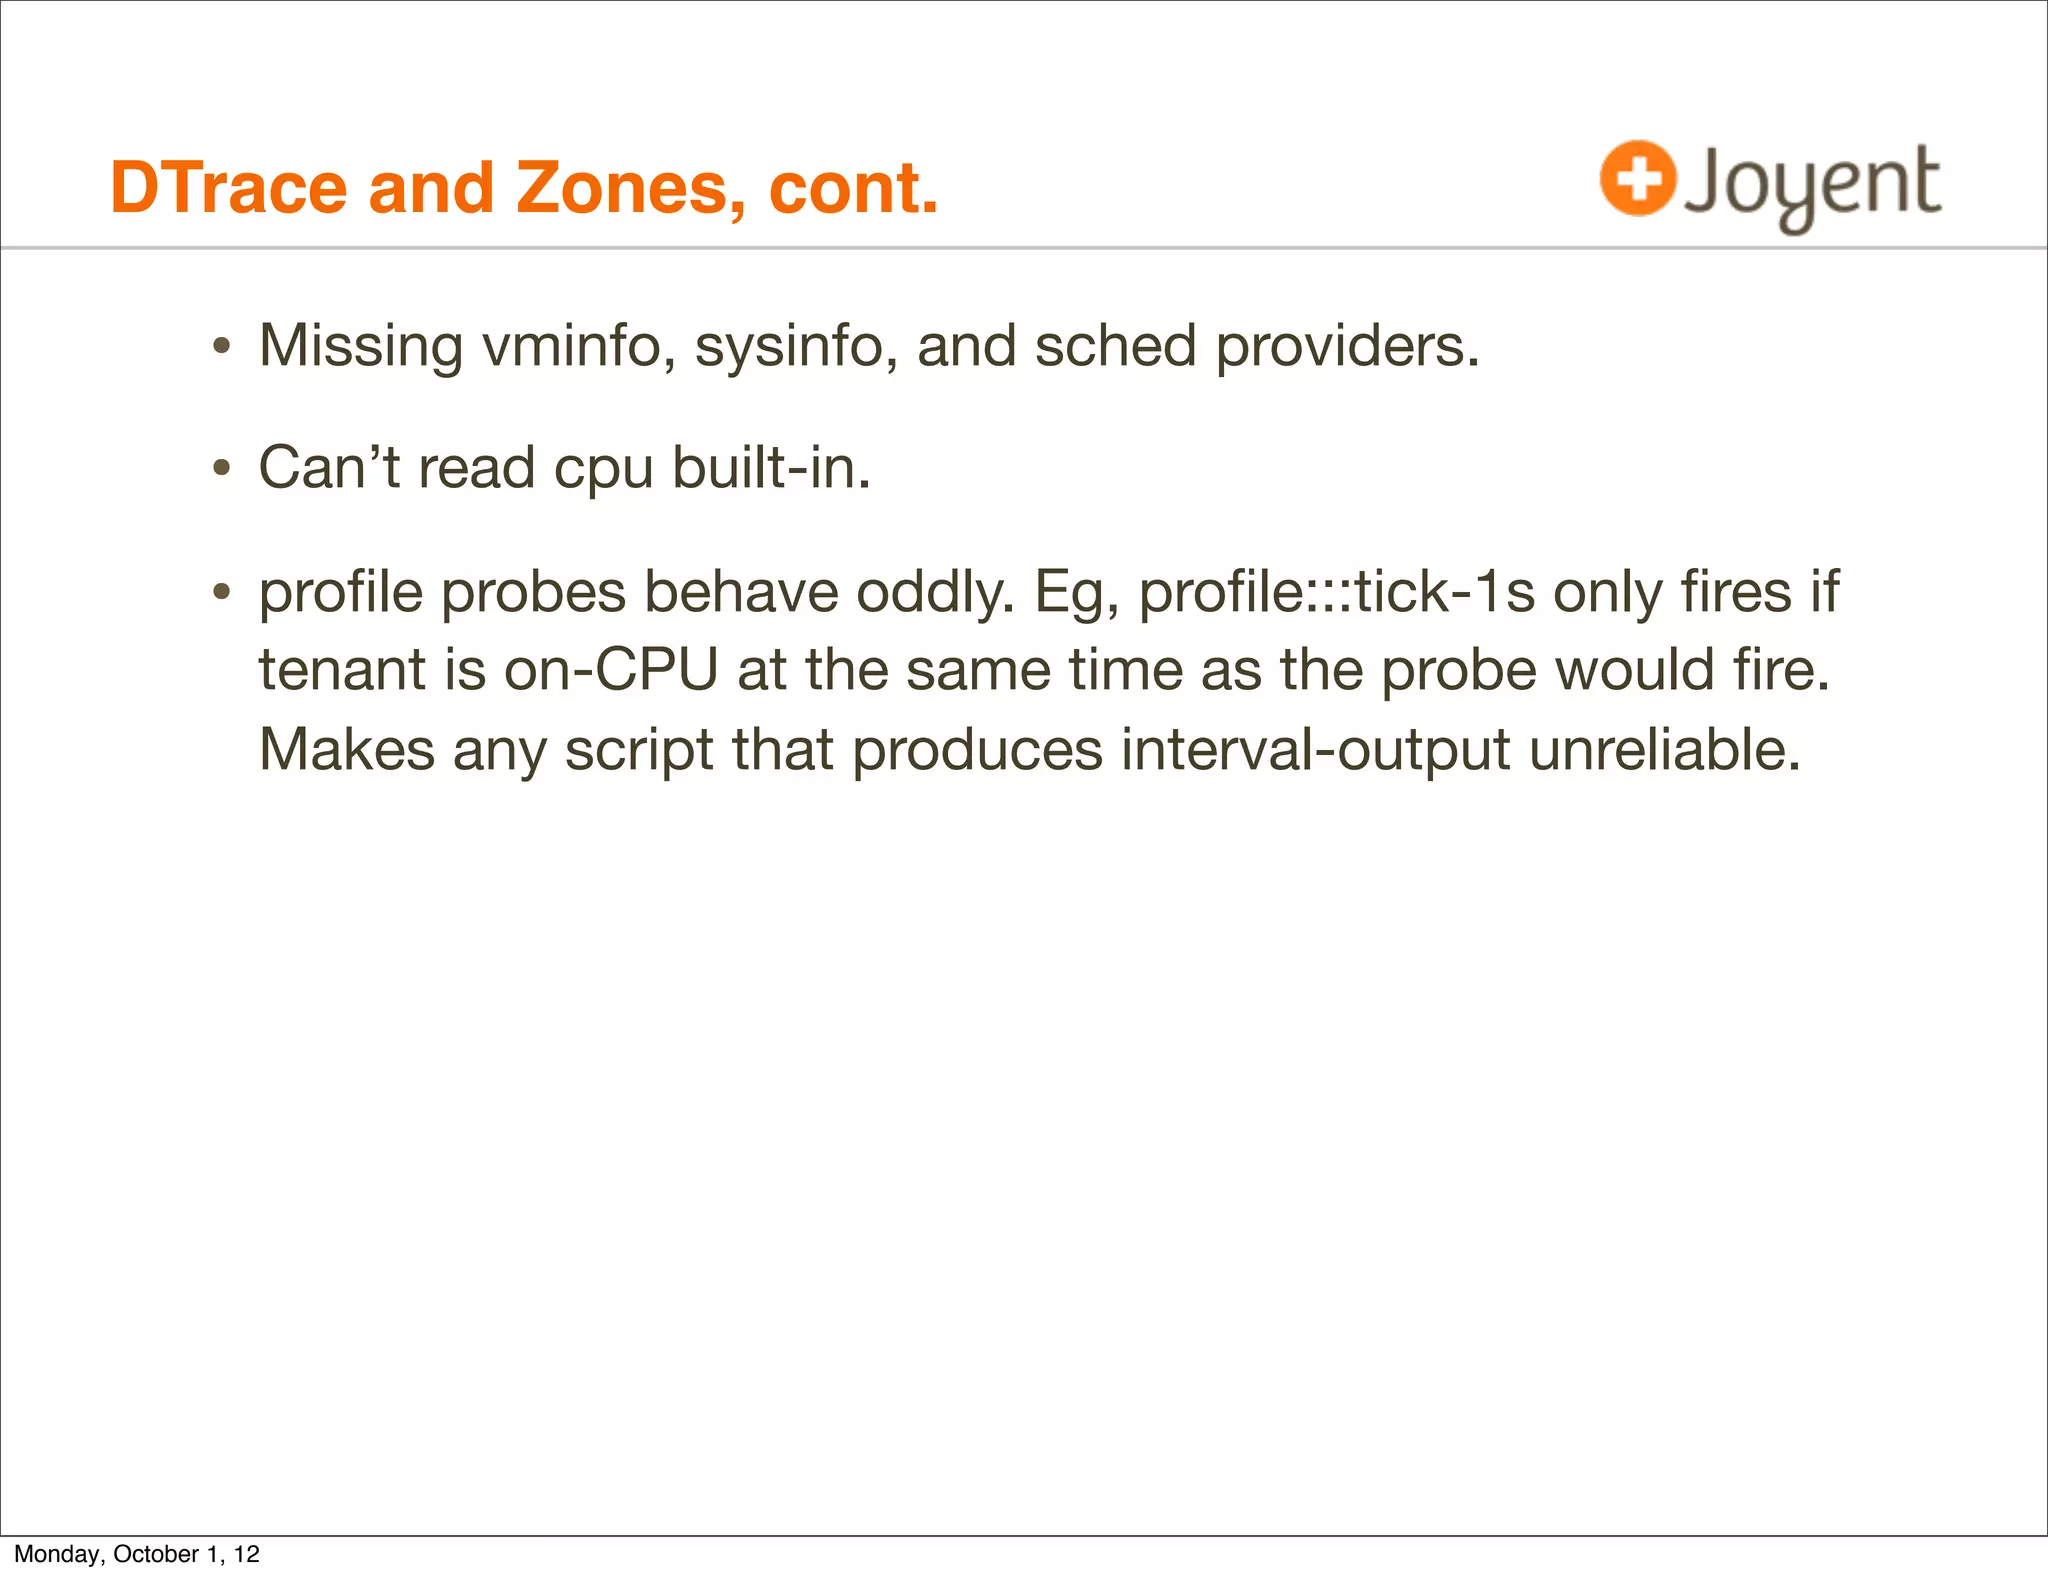
![DTrace and Zones, cont.
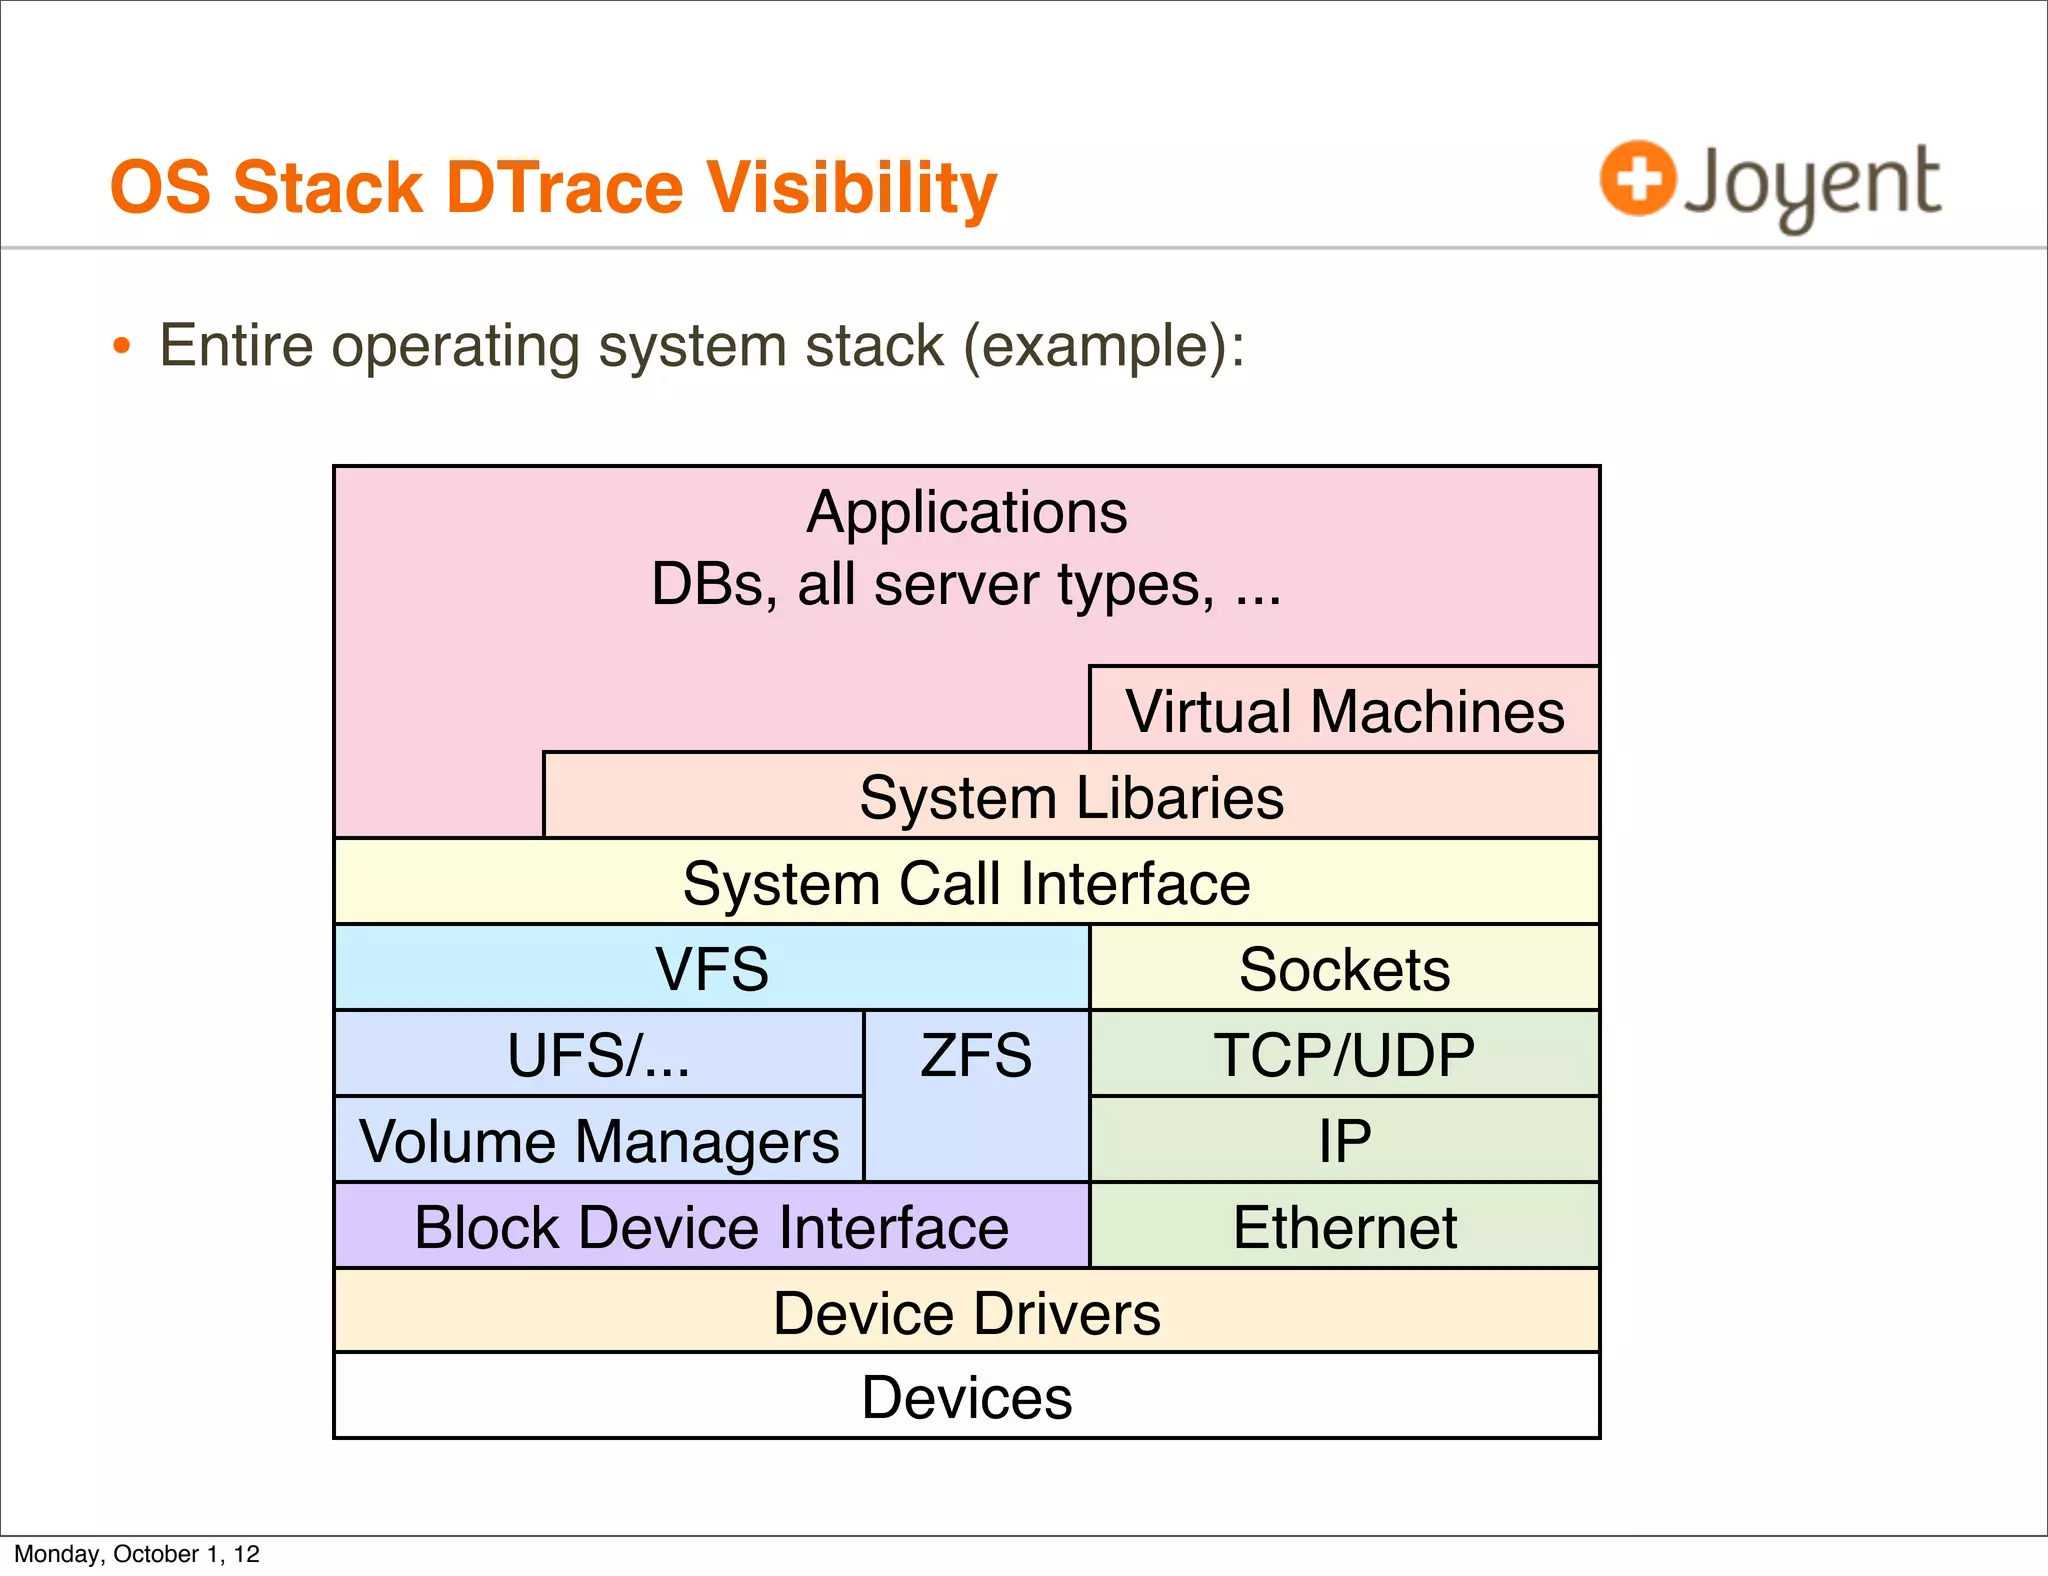
• Can’t read curpsinfo, curlwpsinfo, which breaks many scripts
(eg, curpsinfo->pr_psargs, or curpsinfo->pr_dmodel)
# dtrace -n 'syscall::exec*:return { trace(curpsinfo->pr_psargs); }'
dtrace: description 'syscall::exec*:return ' matched 1 probe
dtrace: error on enabled probe ID 1 (ID 103: syscall::exece:return): invalid
kernel access in action #1 at DIF offset 0
dtrace: error on enabled probe ID 1 (ID 103: syscall::exece:return): invalid
kernel access in action #1 at DIF offset 0
dtrace: error on enabled probe ID 1 (ID 103: syscall::exece:return): invalid
kernel access in action #1 at DIF offset 0
dtrace: error on enabled probe ID 1 (ID 103: syscall::exece:return): invalid
kernel access in action #1 at DIF offset 0
[...]
• Missing proc provider. Breaks this common one-liner:
# dtrace -n 'proc:::exec-success { trace(execname); }'
dtrace: invalid probe specifier proc:::exec-success { trace(execname); }:
probe description proc:::exec-success does not match any probes
[...]
Monday, October 1, 12](https://image.slidesharecdn.com/dtracecloud2012-121001163711-phpapp02/75/DTraceCloud2012-29-2048.jpg)
![DTrace and Zones, cont.
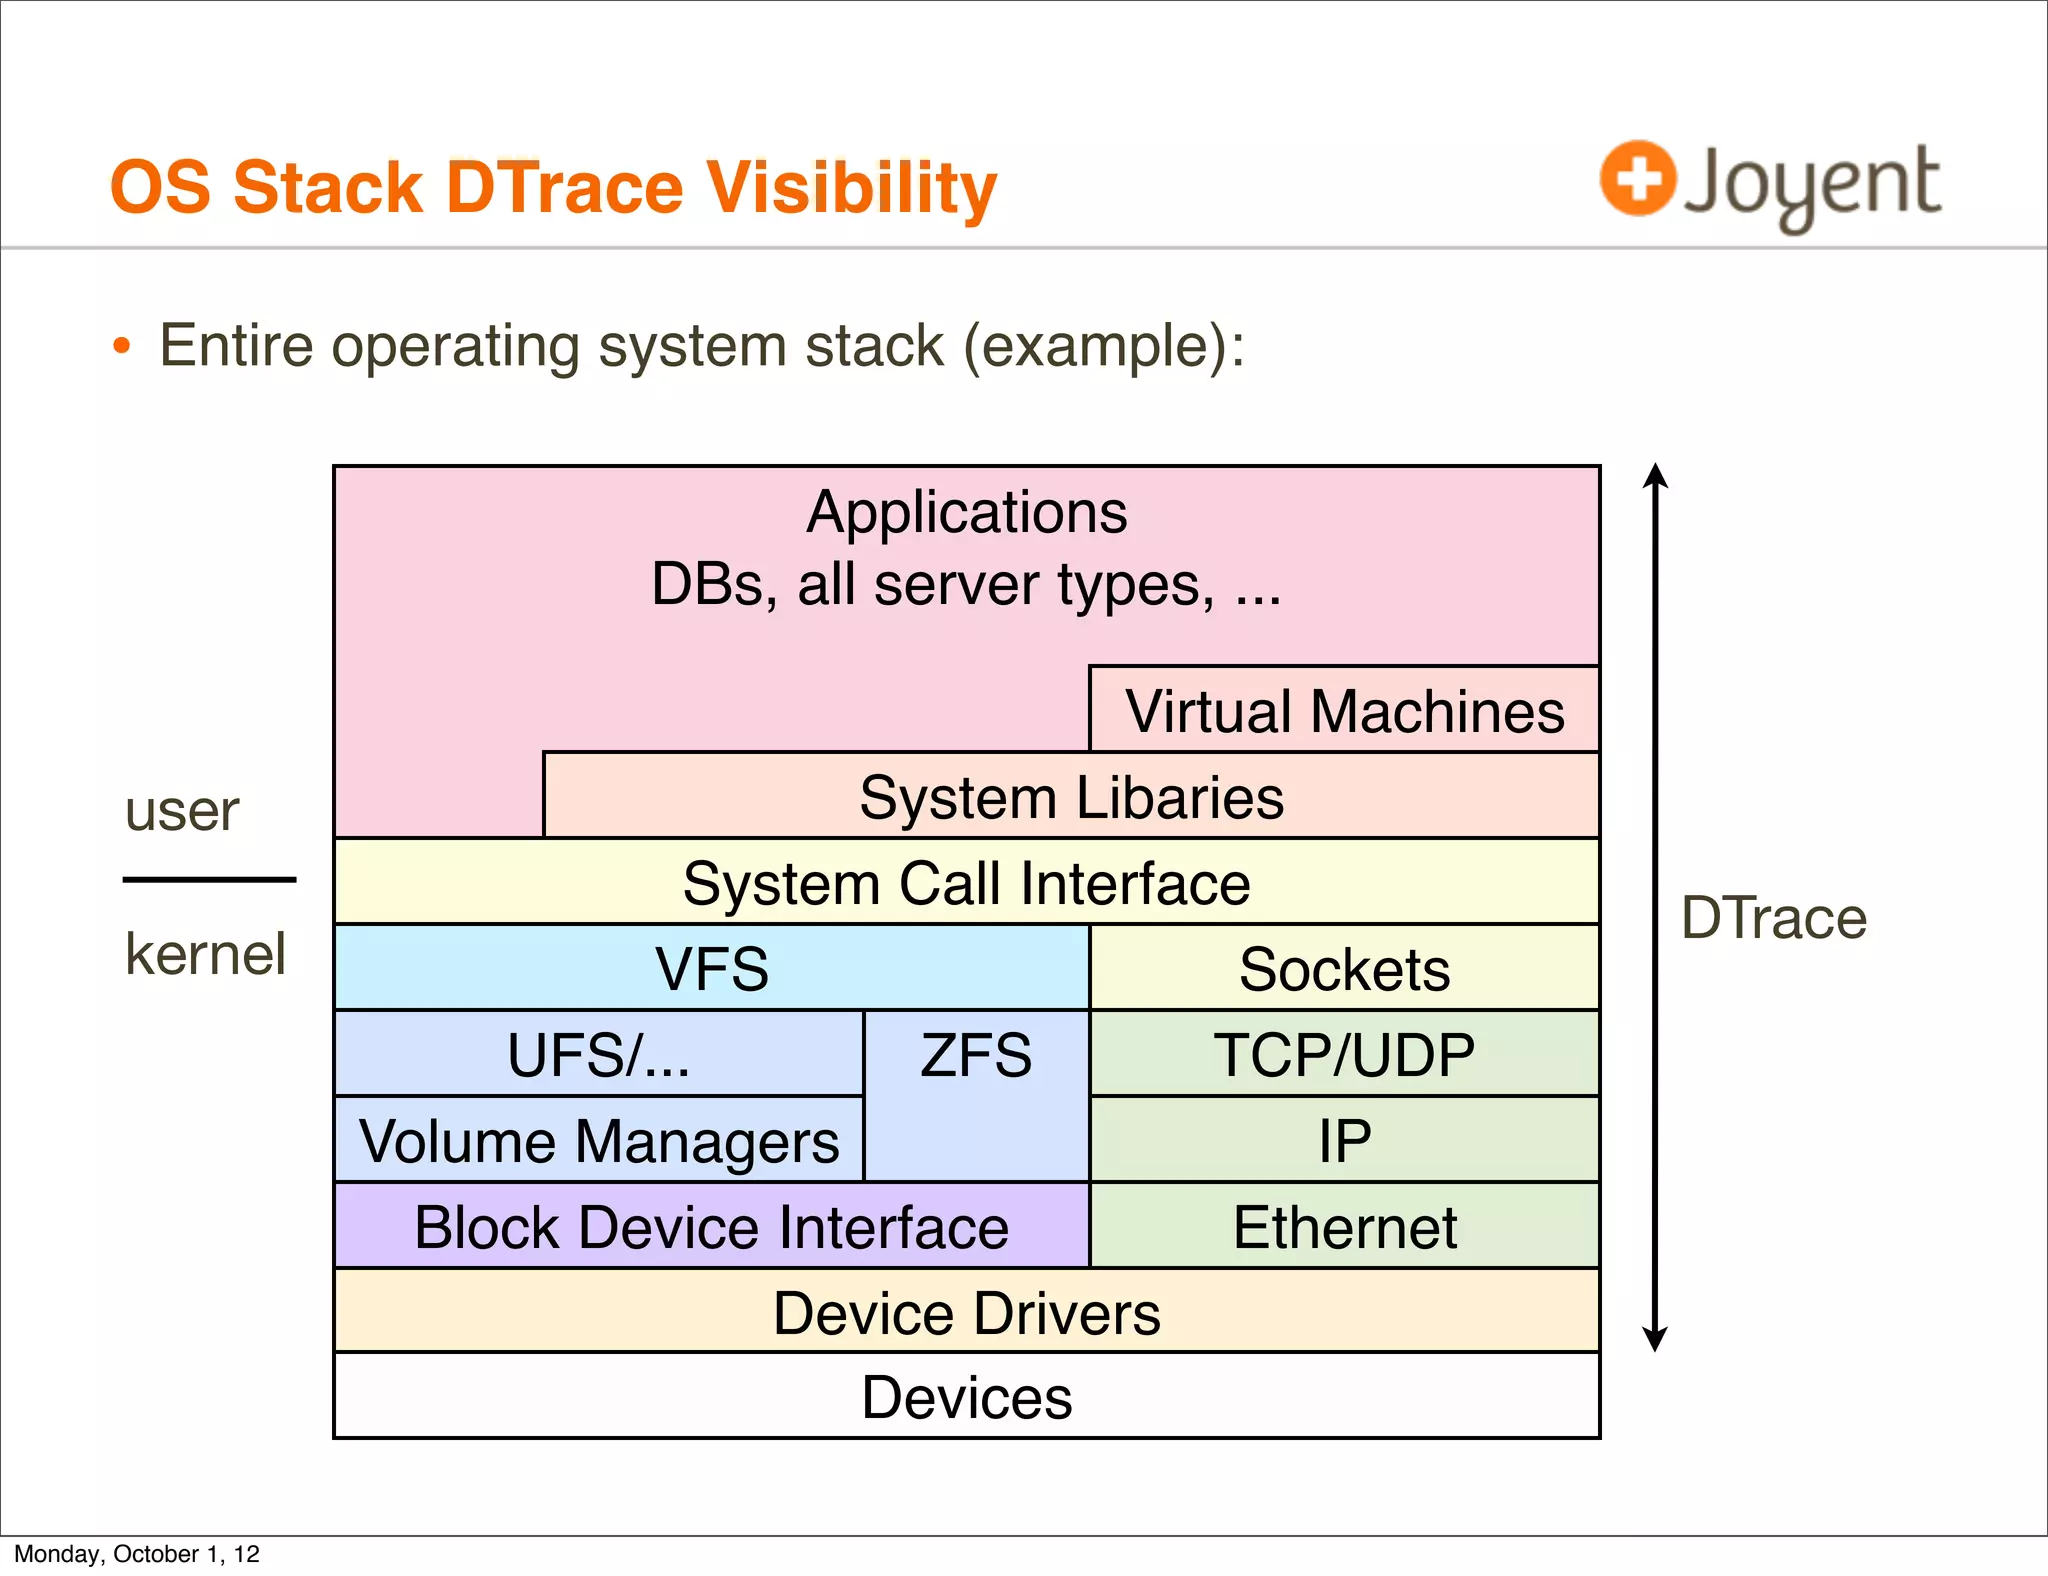
• These and other bugs have since been fixed for SmartOS/illumos
(thanks Bryan Cantrill!)
• Now, from a SmartOS Zone:
# dtrace -n 'proc:::exec-success { @[curpsinfo->pr_psargs] = count(); }
profile:::tick-5s { exit(0); }'
dtrace: description 'proc:::exec-success ' matched 2 probes
CPU ID FUNCTION:NAME
13 71762 :tick-5s
-bash 1
/bin/cat -s /etc/motd 1
/bin/mail -E 1
/usr/bin/hostname 1
/usr/sbin/quota 1
/usr/bin/locale -a 2
ls -l 3
sh -c /usr/bin/locale -a 4
• Trivial DTrace one-liner, but represents much needed functionality.
Monday, October 1, 12](https://image.slidesharecdn.com/dtracecloud2012-121001163711-phpapp02/75/DTraceCloud2012-31-2048.jpg)

![Ad-hoc: DTrace Cloud Tools
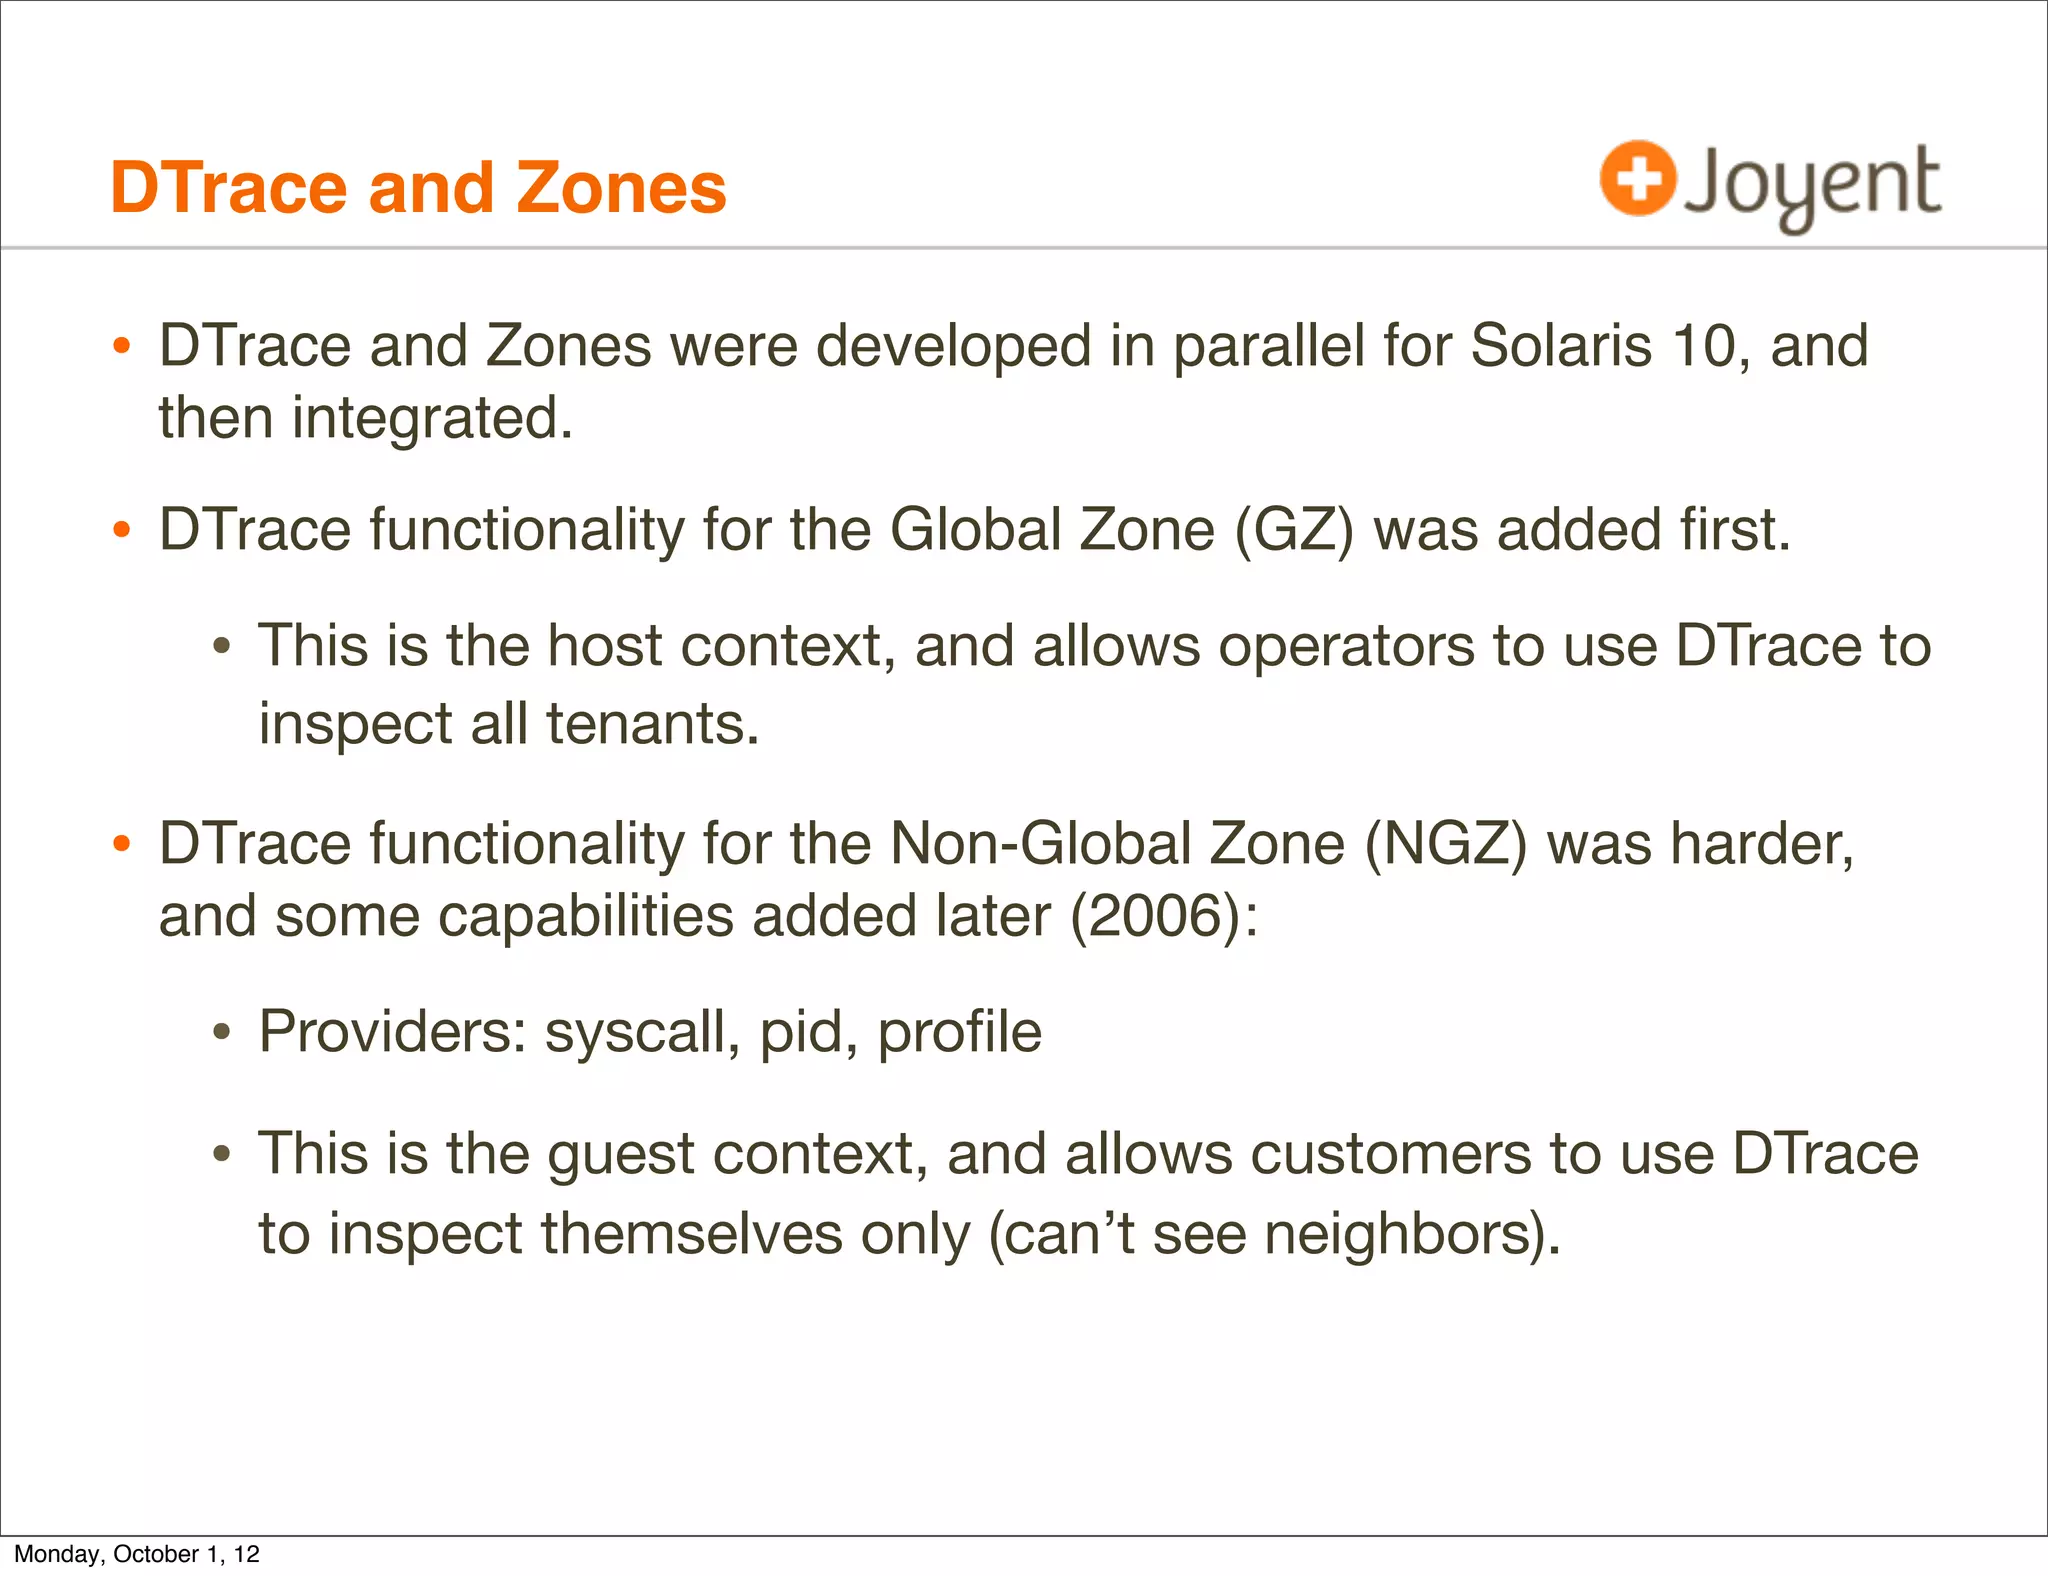
• Contains around 70 ad-hoc DTrace tools written by myself for
operators and cloud customers.
./fs/metaslab_free.d ./net/dnsconnect.d
./fs/spasync.d ./net/tcp-fbt-accept_sdc5.d
./fs/zfsdist.d ./net/tcp-fbt-accept_sdc6.d
./fs/zfsslower.d ./net/tcpconnreqmaxq-pid_sdc5.d
./fs/zfsslowzone.d ./net/tcpconnreqmaxq-pid_sdc6.d
./fs/zfswhozone.d ./net/tcpconnreqmaxq_sdc5.d
./fs/ziowait.d ./net/tcpconnreqmaxq_sdc6.d
./mysql/innodb_pid_iolatency.d ./net/tcplistendrop_sdc5.d
./mysql/innodb_pid_ioslow.d ./net/tcplistendrop_sdc6.d
./mysql/innodb_thread_concurrency.d ./net/tcpretranshosts.d
./mysql/libmysql_pid_connect.d ./net/tcpretransport.d
./mysql/libmysql_pid_qtime.d ./net/tcpretranssnoop_sdc5.d
./mysql/libmysql_pid_snoop.d ./net/tcpretranssnoop_sdc6.d
./mysql/mysqld_latency.d ./net/tcpretransstate.d
./mysql/mysqld_pid_avg.d ./net/tcptimewait.d
./mysql/mysqld_pid_filesort.d ./net/tcptimewaited.d
./mysql/mysqld_pid_fslatency.d ./net/tcptimretransdropsnoop_sdc6.d
[...] [...]
• Customer scripts are linked from the “smartmachine” directory
• https://github.com/brendangregg/dtrace-cloud-tools
Monday, October 1, 12](https://image.slidesharecdn.com/dtracecloud2012-121001163711-phpapp02/75/DTraceCloud2012-37-2048.jpg)
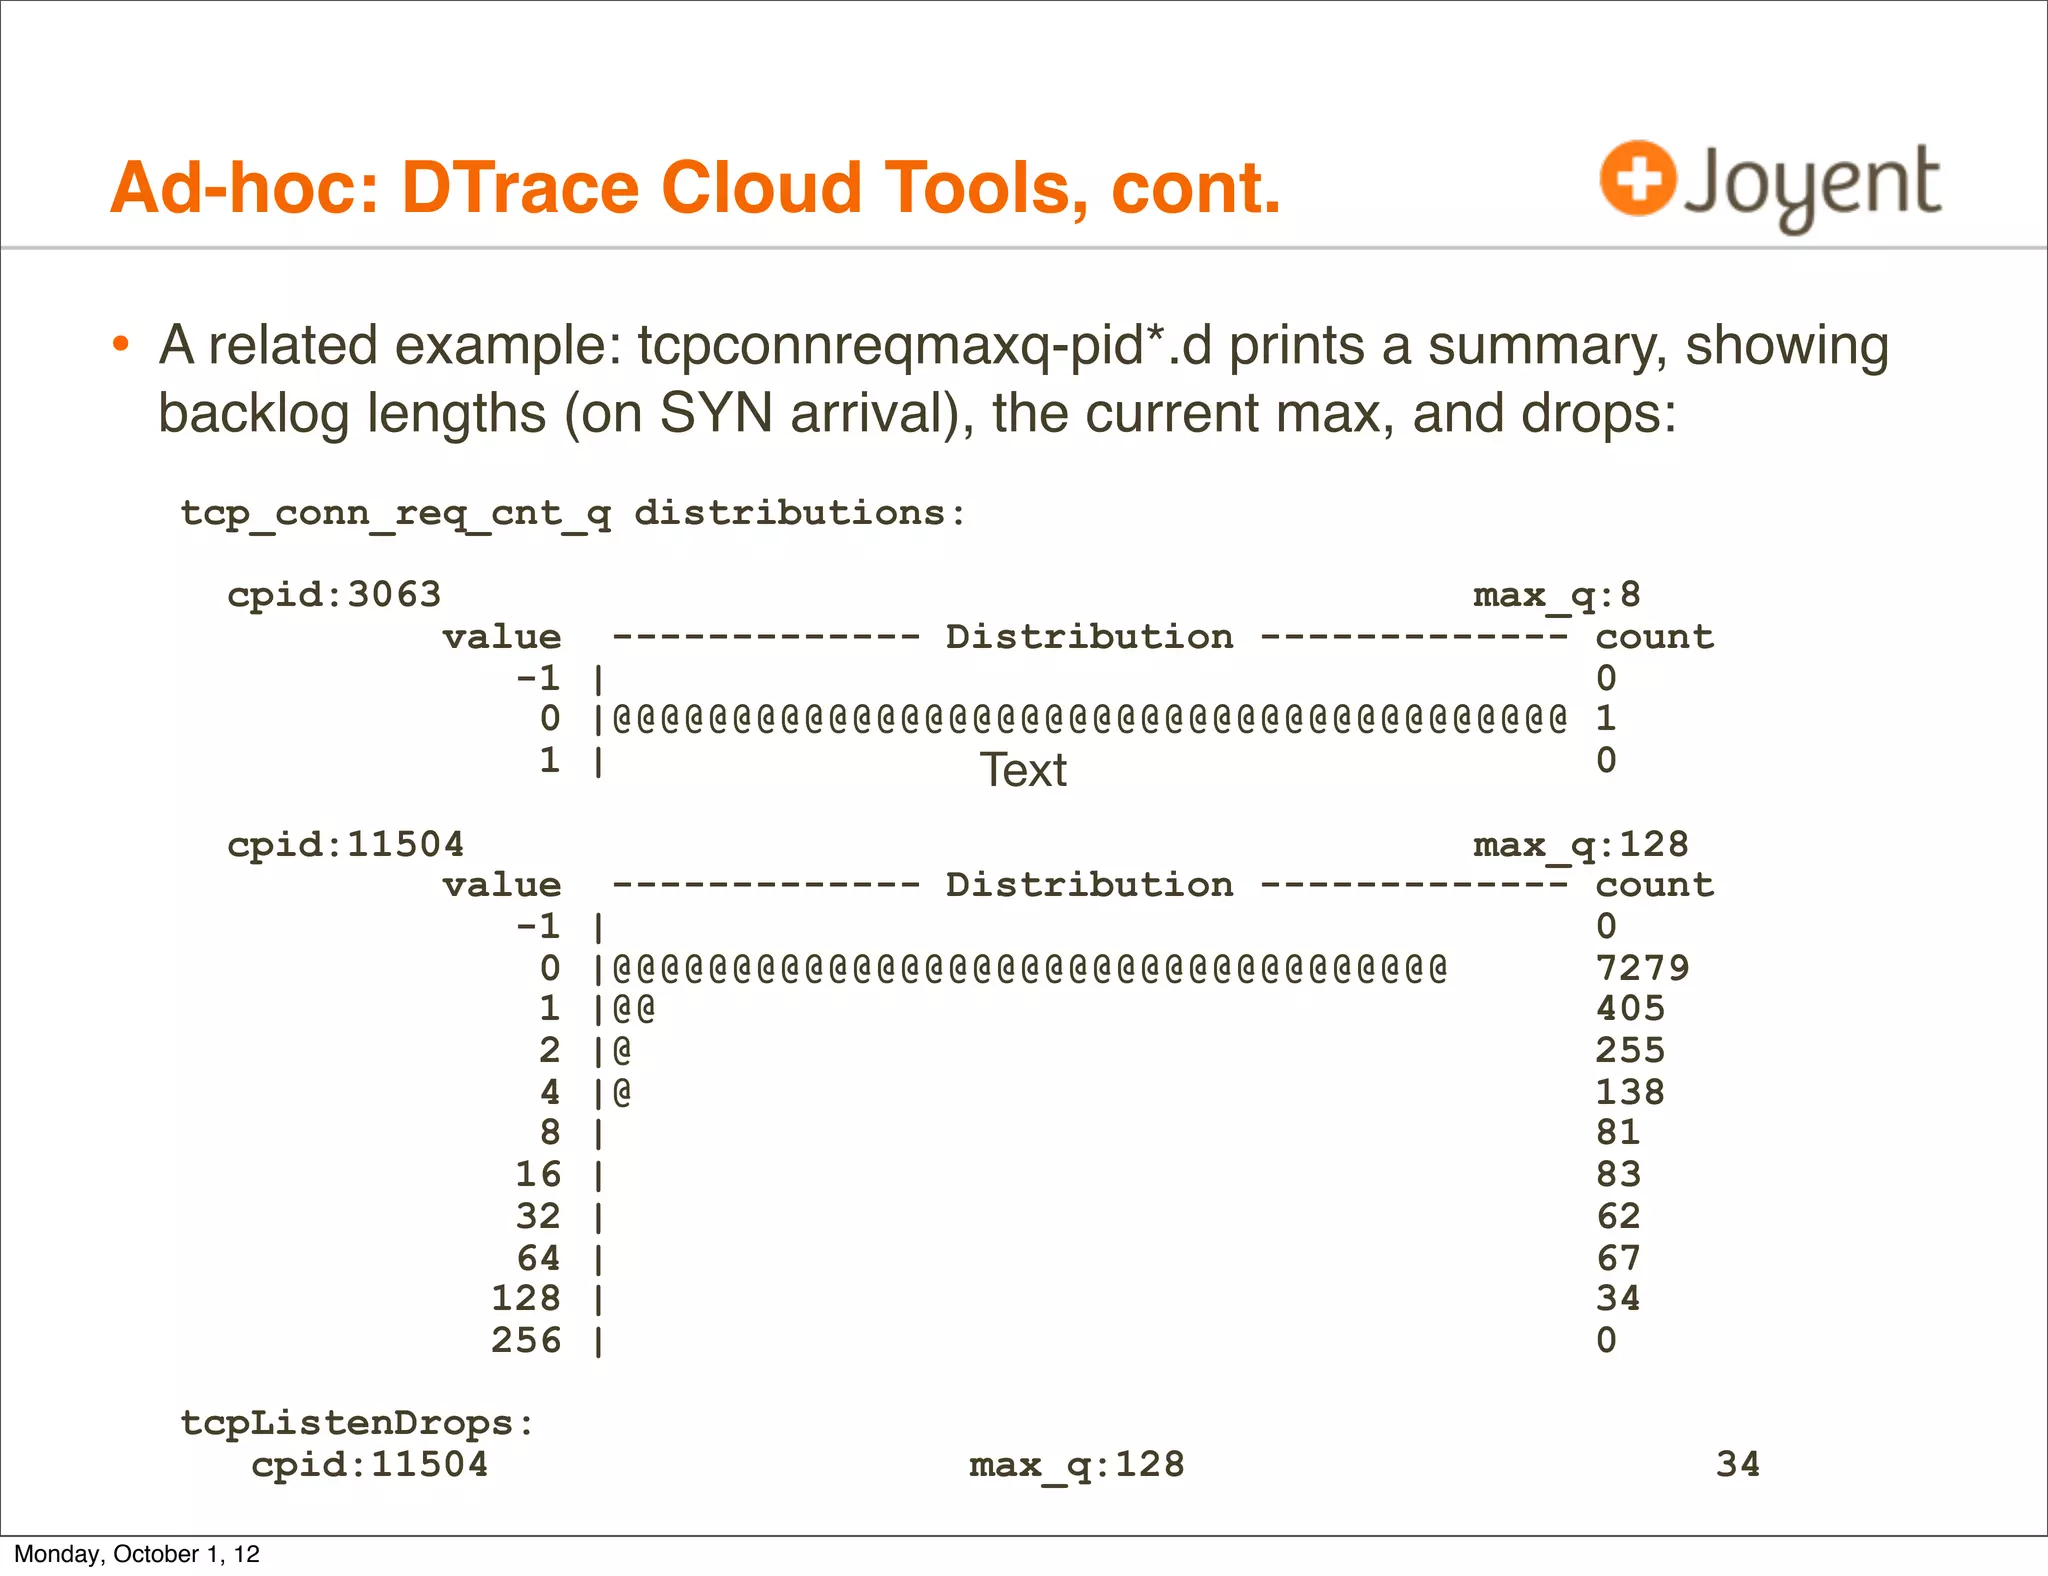
![Ad-hoc: DTrace Cloud Tools, cont.
• For example, tcplistendrop.d traces each kernel-dropped SYN due
to TCP backlog overflow (saturation):
# ./tcplistendrop.d
TIME SRC-IP PORT DST-IP PORT
2012 Jan 19 01:22:49 10.17.210.103 25691 -> 192.192.240.212 80
2012 Jan 19 01:22:49 10.17.210.108 18423 -> 192.192.240.212 80
2012 Jan 19 01:22:49 10.17.210.116 38883 -> 192.192.240.212 80
2012 Jan 19 01:22:49 10.17.210.117 10739 -> 192.192.240.212 80
2012 Jan 19 01:22:49 10.17.210.112 27988 -> 192.192.240.212 80
2012 Jan 19 01:22:49 10.17.210.106 28824 -> 192.192.240.212 80
2012 Jan 19 01:22:49 10.12.143.16 65070 -> 192.192.240.212 80
2012 Jan 19 01:22:49 10.17.210.100 56392 -> 192.192.240.212 80
2012 Jan 19 01:22:49 10.17.210.99 24628 -> 192.192.240.212 80
[...]
• Can explain multi-second client connect latency.
Monday, October 1, 12](https://image.slidesharecdn.com/dtracecloud2012-121001163711-phpapp02/75/DTraceCloud2012-38-2048.jpg)
![Ad-hoc: DTrace Cloud Tools, cont.
• tcplistendrop.d processes IP and TCP headers from the in-kernel
packet buffer:
fbt::tcp_input_listener:entry { self->mp = args[1]; }
fbt::tcp_input_listener:return { self->mp = 0; }
mib:::tcpListenDrop
/self->mp/
{
this->iph = (ipha_t *)self->mp->b_rptr;
this->tcph = (tcph_t *)(self->mp->b_rptr + 20);
printf("%-20Y %-18s %-5d -> %-18s %-5dn", walltimestamp,
inet_ntoa(&this->iph->ipha_src),
ntohs(*(uint16_t *)this->tcph->th_lport),
inet_ntoa(&this->iph->ipha_dst),
ntohs(*(uint16_t *)this->tcph->th_fport));
}
• Since this traces the fbt provider (kernel), it is operator only.
Monday, October 1, 12](https://image.slidesharecdn.com/dtracecloud2012-121001163711-phpapp02/75/DTraceCloud2012-39-2048.jpg)


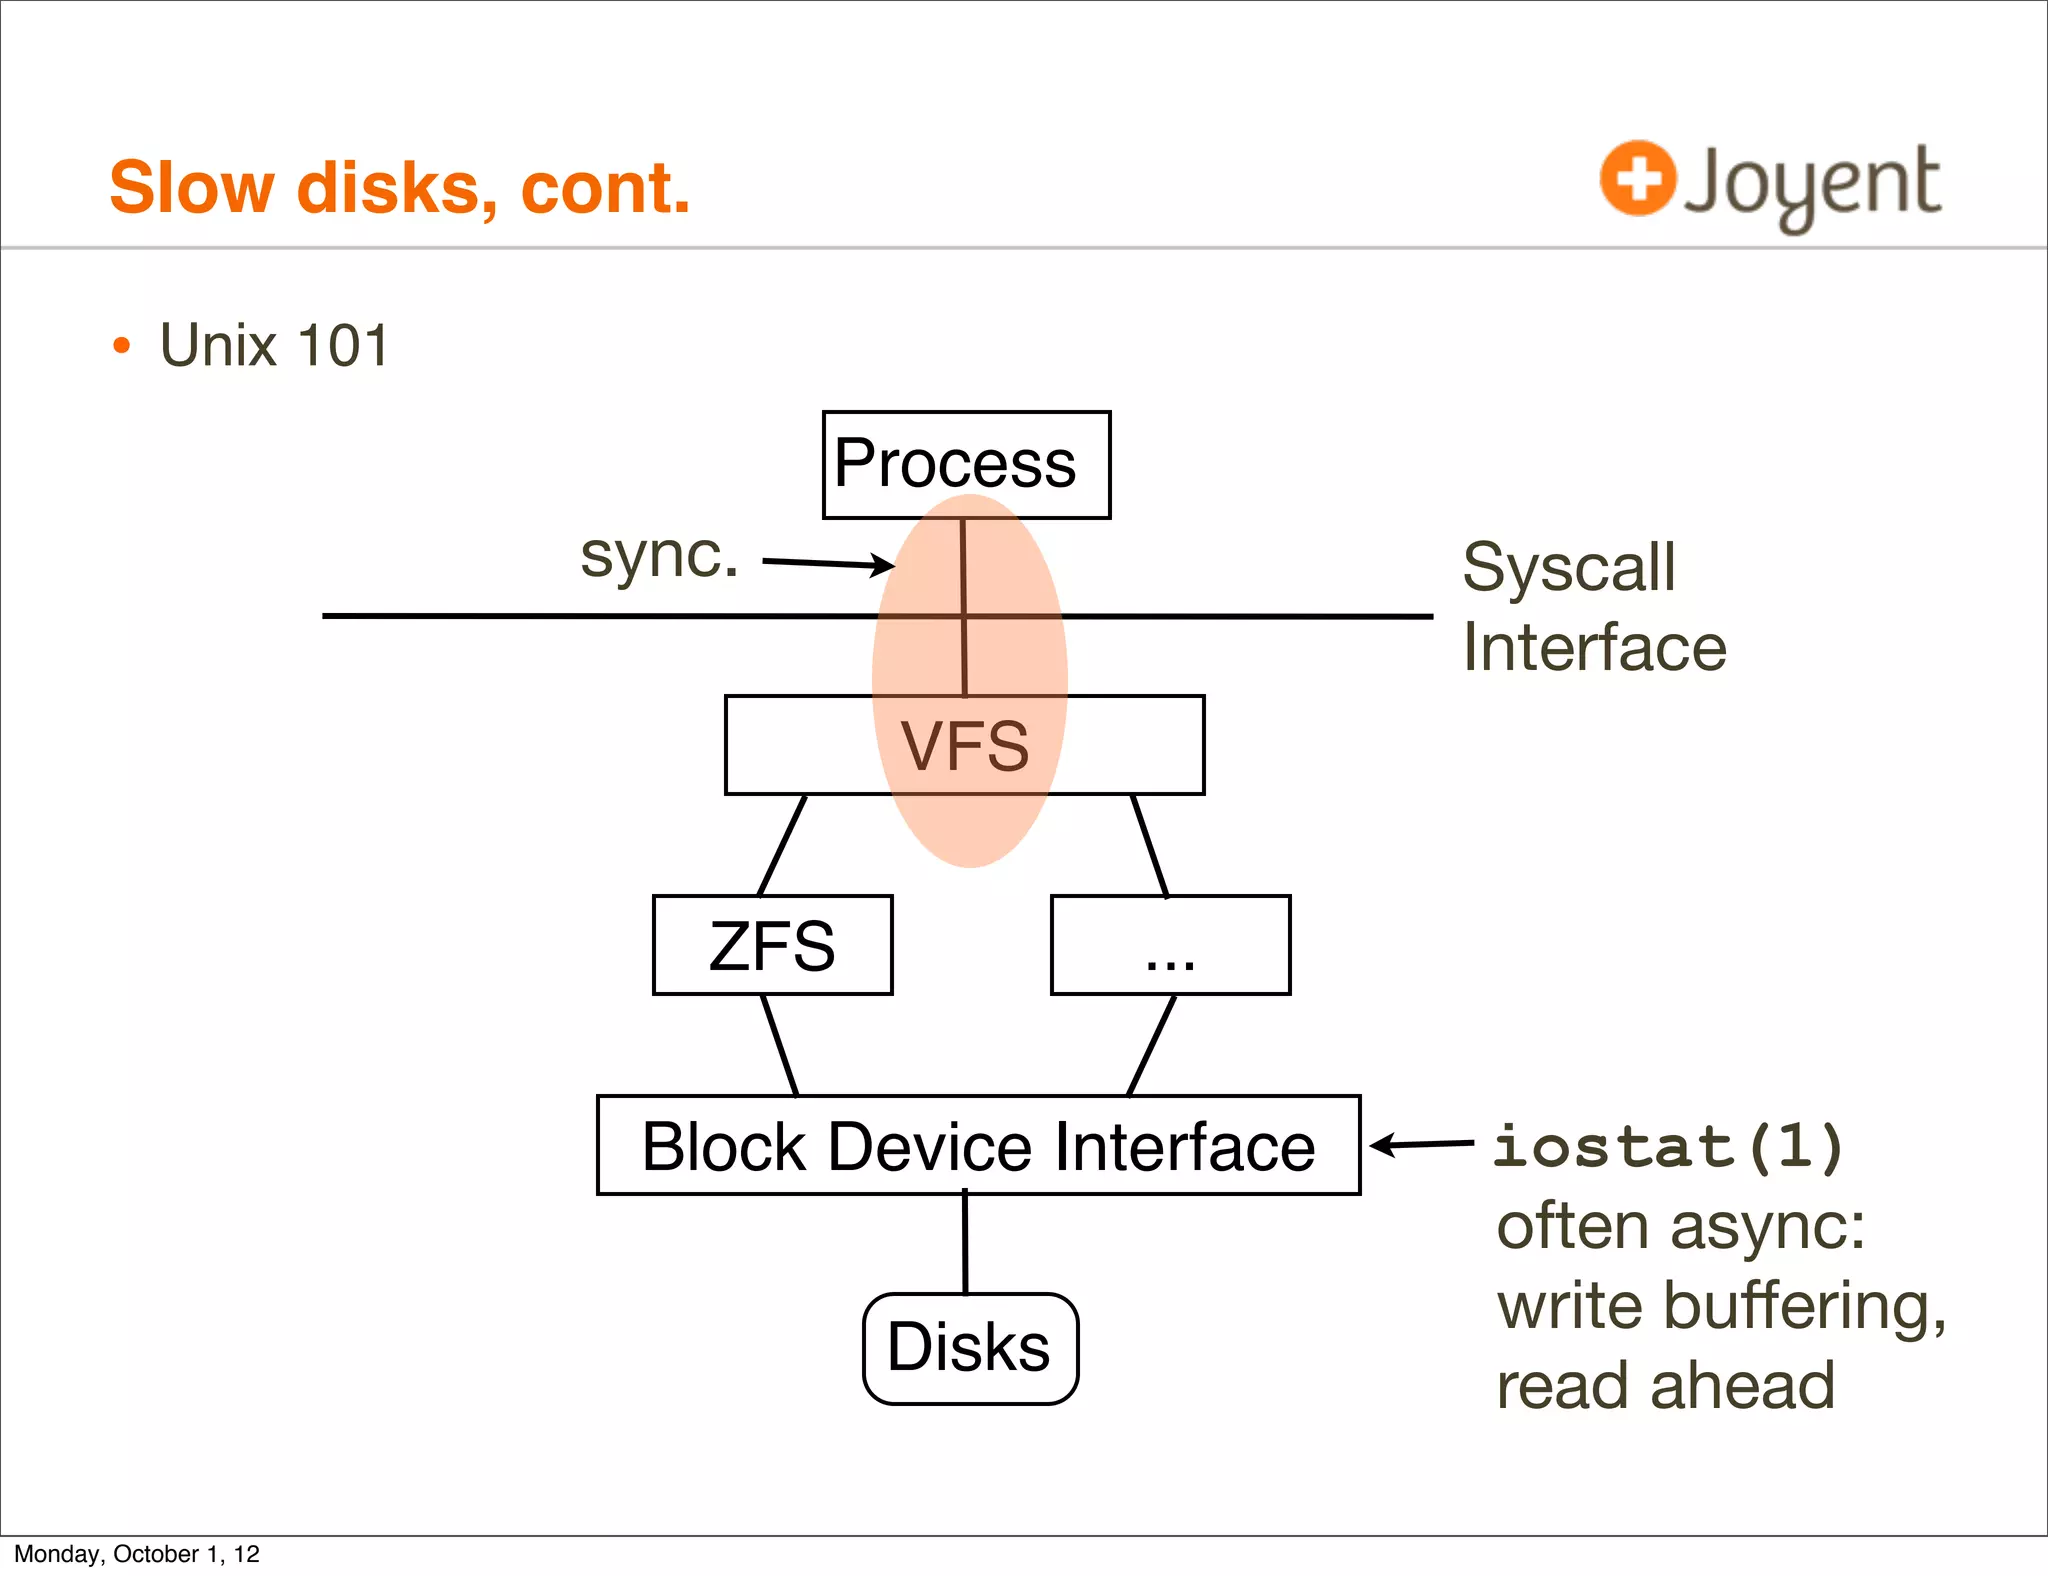
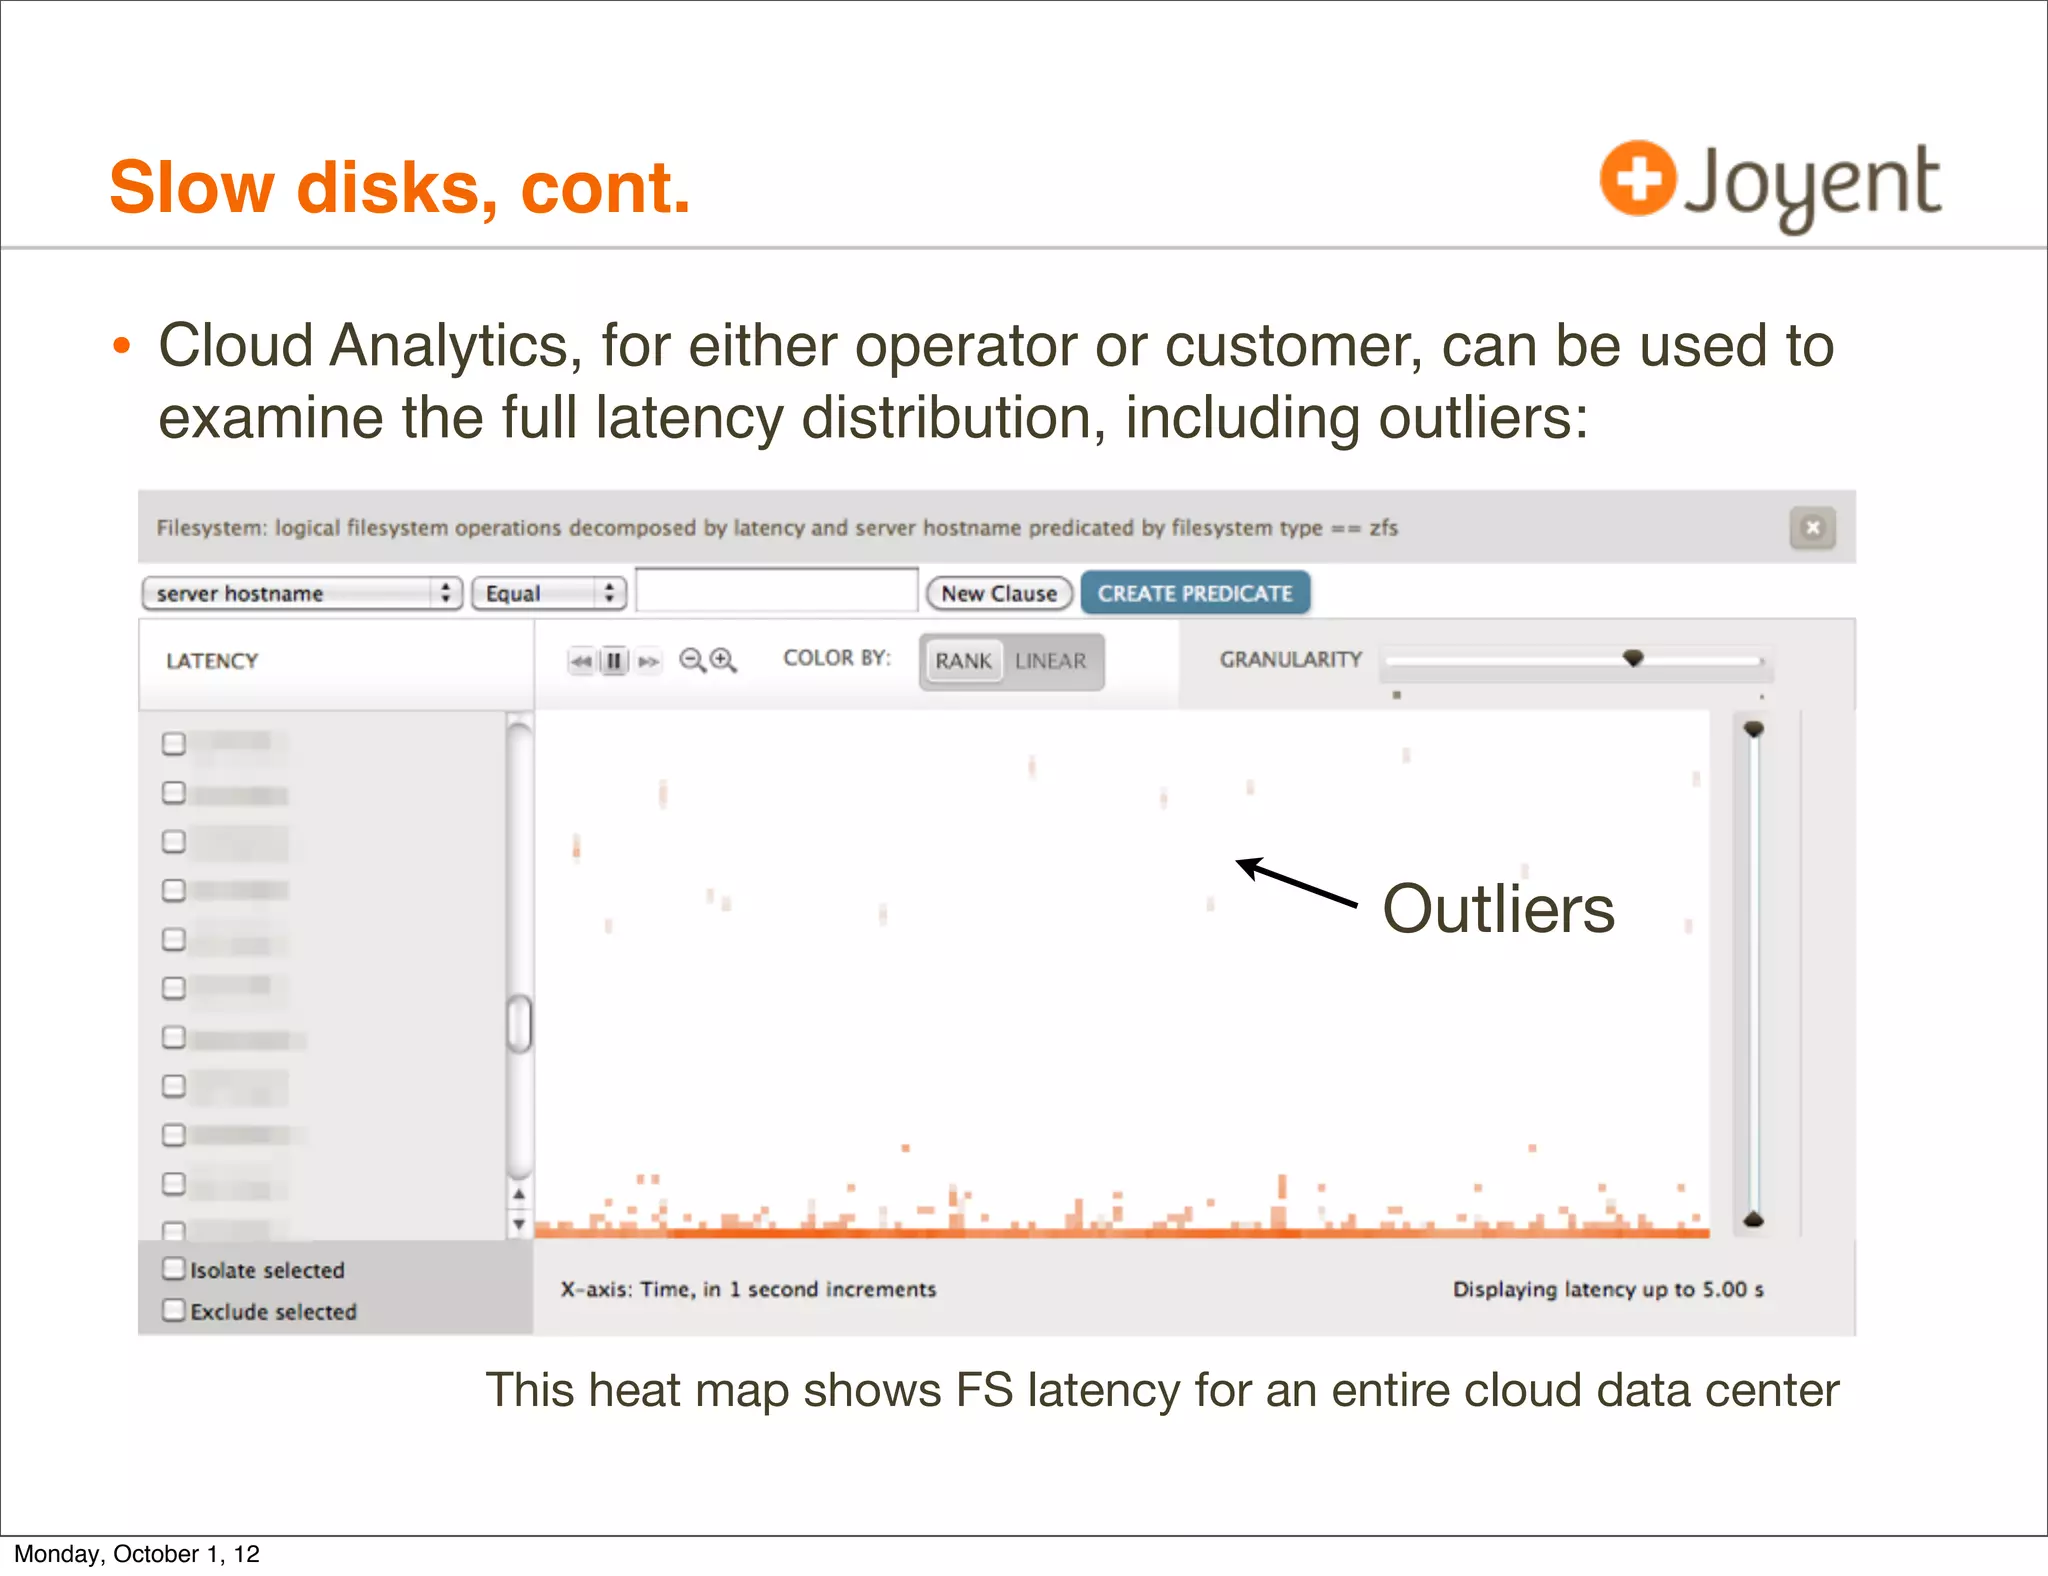
![Slow disks, cont.
• By measuring FS latency in application-synchronous context we
can either confirm or rule-out FS/disk origin latency.
• Including expressing FS latency during MySQL query, so that
the issue can be quantified, and speedup calculated.
• Ideally, this would be possible from within the SmartMachine, so
both customer and operator can run the DTrace script. This is
possible using:
• pid provider: trace and time MySQL FS functions
• syscall provider: trace and time read/write syscalls for FS file
descriptors (hence needing fds[].fi_fs; otherwise cache open())
Monday, October 1, 12](https://image.slidesharecdn.com/dtracecloud2012-121001163711-phpapp02/75/DTraceCloud2012-54-2048.jpg)
![Slow disks, cont.
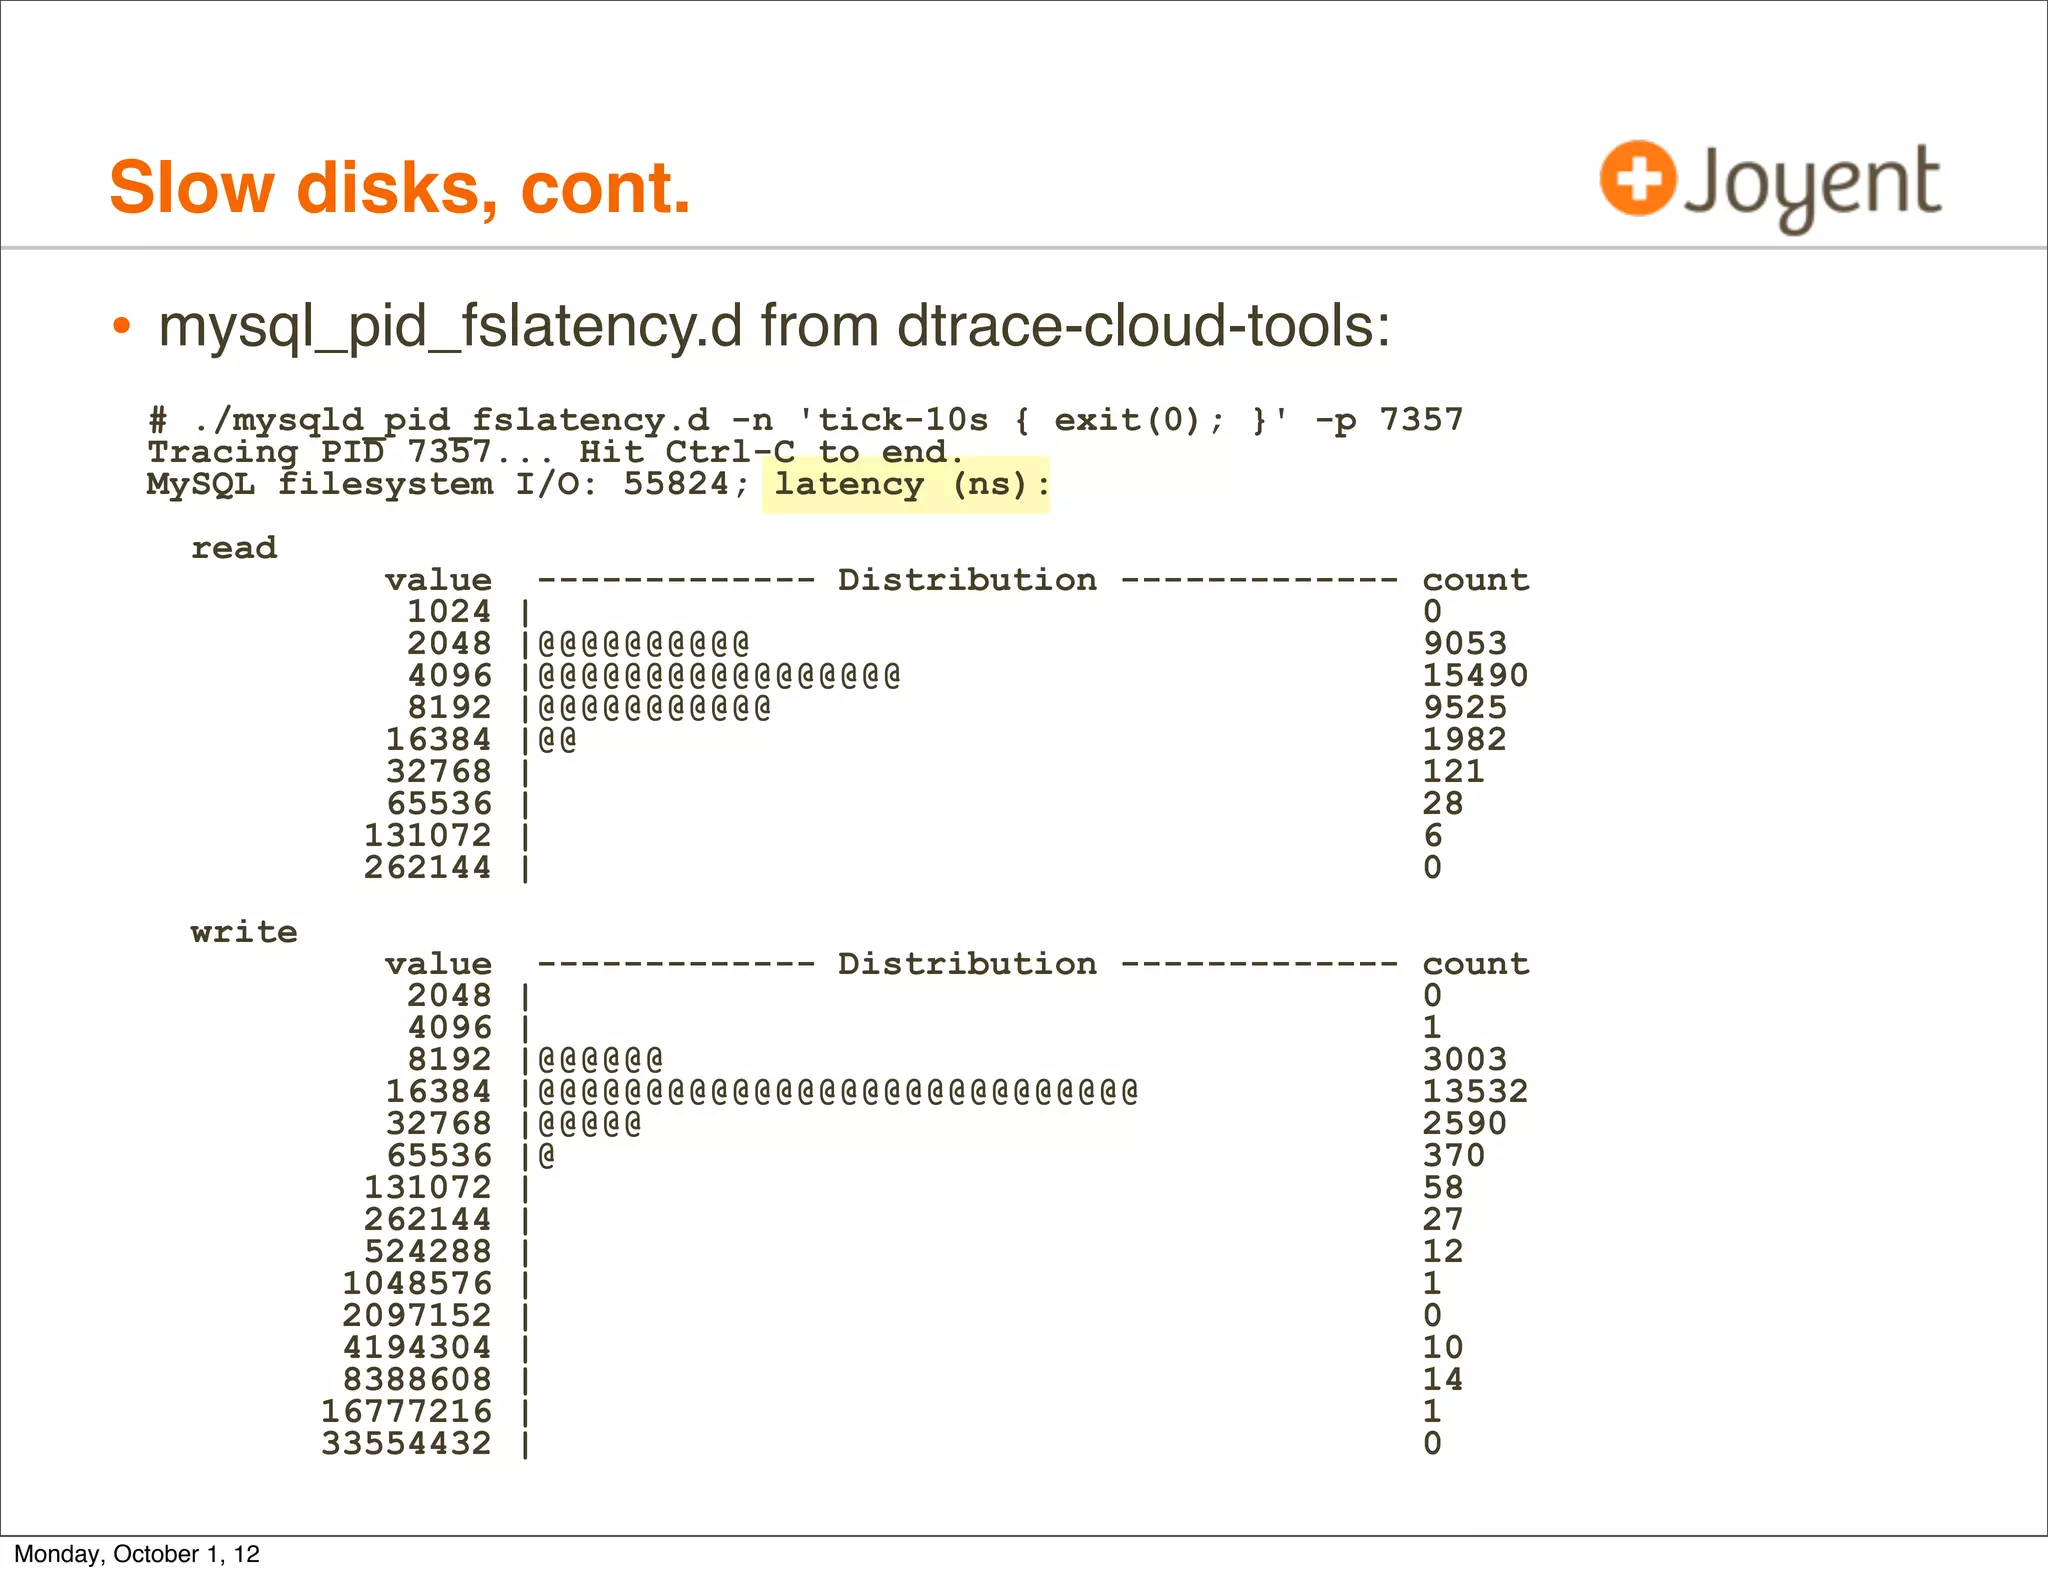
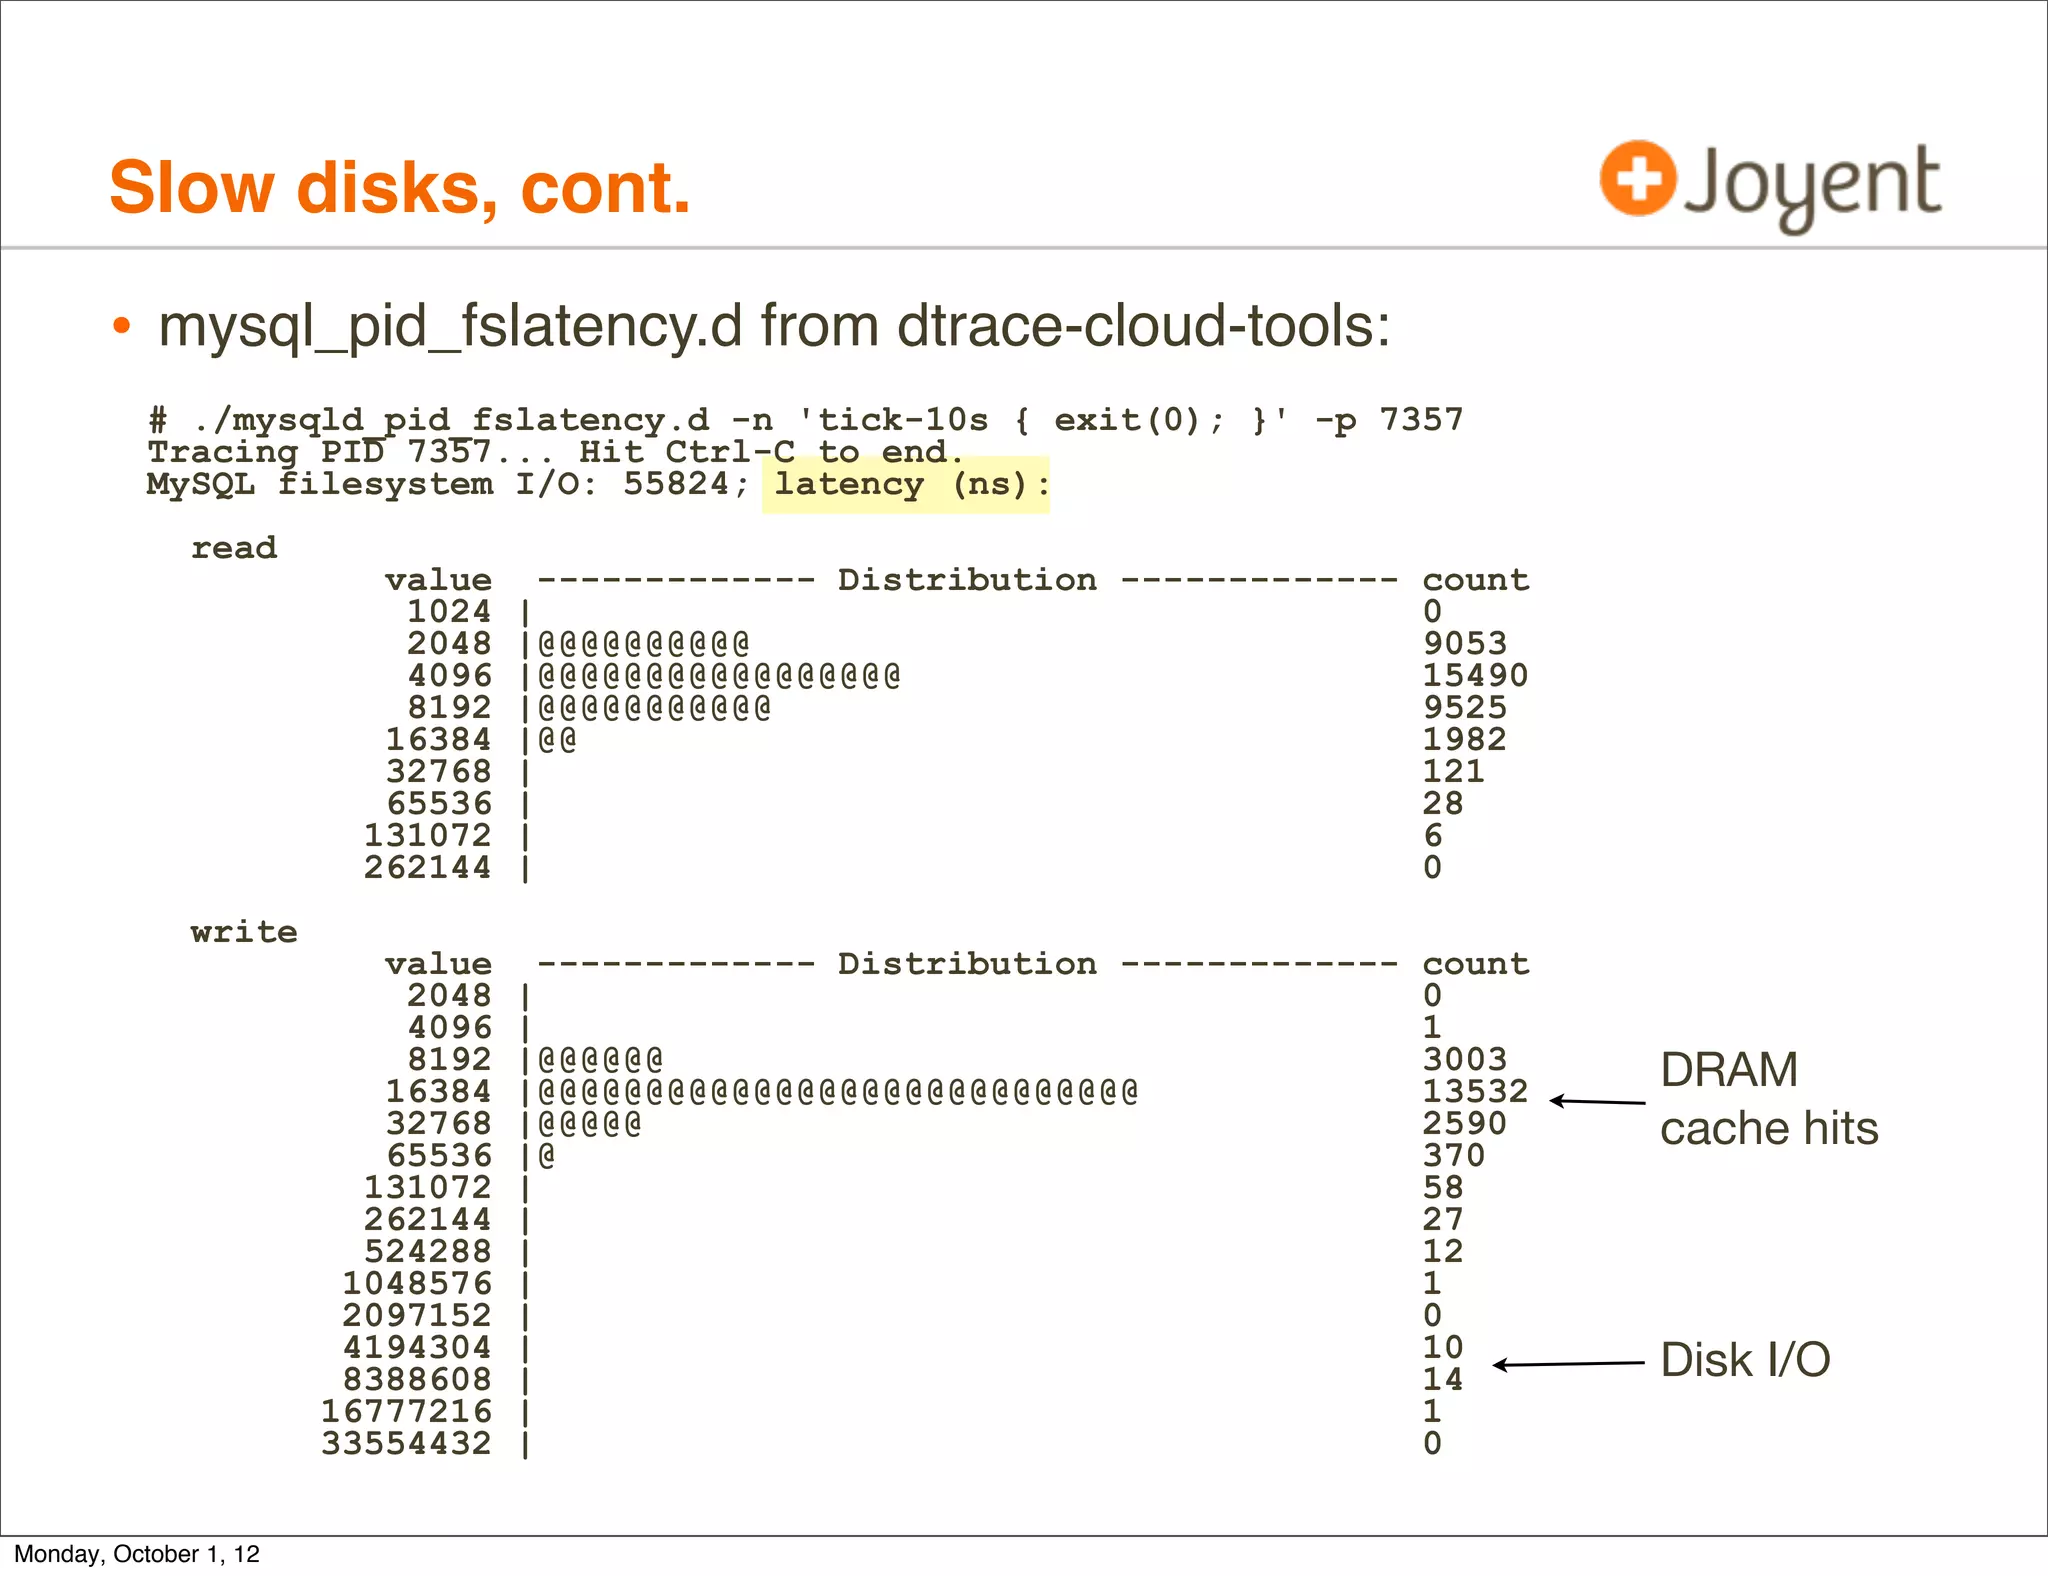
• mysql_pid_fslatency.d is about 30 lines of DTrace:
pid$target::os_file_read:entry,
pid$target::os_file_write:entry,
pid$target::my_read:entry,
pid$target::my_write:entry
{
self->start = timestamp;
}
pid$target::os_file_read:return { this->dir = "read"; }
pid$target::os_file_write:return { this->dir = "write"; }
pid$target::my_read:return { this->dir = "read"; }
pid$target::my_write:return { this->dir = "write"; }
pid$target::os_file_read:return,
pid$target::os_file_write:return,
pid$target::my_read:return,
pid$target::my_write:return
/self->start/
{
@time[this->dir] = quantize(timestamp - self->start);
@num = count();
self->start = 0;
}
dtrace:::END
{
printa("MySQL filesystem I/O: %@d; latency (ns):n", @num);
printa(@time);
clear(@time); clear(@num);
}
Monday, October 1, 12](https://image.slidesharecdn.com/dtracecloud2012-121001163711-phpapp02/75/DTraceCloud2012-57-2048.jpg)
![Slow disks, cont.
• mysql_pid_fslatency.d is about 30 lines of DTrace:
pid$target::os_file_read:entry,
pid$target::os_file_write:entry,
pid$target::my_read:entry, Thank you MySQL!
pid$target::my_write:entry
{ If not that easy,
self->start = timestamp;
} try syscall with fds[]
pid$target::os_file_read:return { this->dir = "read"; }
pid$target::os_file_write:return { this->dir = "write"; }
pid$target::my_read:return { this->dir = "read"; }
pid$target::my_write:return { this->dir = "write"; }
pid$target::os_file_read:return,
pid$target::os_file_write:return,
pid$target::my_read:return,
pid$target::my_write:return
/self->start/
{
@time[this->dir] = quantize(timestamp - self->start);
@num = count();
self->start = 0;
}
dtrace:::END
{
printa("MySQL filesystem I/O: %@d; latency (ns):n", @num);
printa(@time);
clear(@time); clear(@num);
}
Monday, October 1, 12](https://image.slidesharecdn.com/dtracecloud2012-121001163711-phpapp02/75/DTraceCloud2012-58-2048.jpg)
![Slow disks, cont.
• The cloud operator can trace kernel internals. Eg, the VFS->ZFS
interface using zfsslower.d:
# ./zfsslower.d 10
TIME PROCESS D KB ms FILE
2012 Sep 27 13:45:33 zlogin W 0 11 /zones/b8b2464c/var/adm/wtmpx
2012 Sep 27 13:45:36 bash R 0 14 /zones/b8b2464c/opt/local/bin/zsh
2012 Sep 27 13:45:58 mysqld R 1024 19 /zones/b8b2464c/var/mysql/ibdata1
2012 Sep 27 13:45:58 mysqld R 1024 22 /zones/b8b2464c/var/mysql/ibdata1
2012 Sep 27 13:46:14 master R 1 6 /zones/b8b2464c/root/opt/local/
libexec/postfix/qmgr
2012 Sep 27 13:46:14 master R 4 5 /zones/b8b2464c/root/opt/local/etc/
postfix/master.cf
[...]
• My go-to tool (does all apps). This example showed if there were
VFS-level I/O > 10ms? (arg == 10)
• Stupidly easy to do
Monday, October 1, 12](https://image.slidesharecdn.com/dtracecloud2012-121001163711-phpapp02/75/DTraceCloud2012-60-2048.jpg)
![Slow disks, cont.
• zfs_read() entry -> return; same for zfs_write().
[...]
fbt::zfs_read:entry,
fbt::zfs_write:entry
{
self->path = args[0]->v_path;
self->kb = args[1]->uio_resid / 1024;
self->start = timestamp;
}
fbt::zfs_read:return,
fbt::zfs_write:return
/self->start && (timestamp - self->start) >= min_ns/
{
this->iotime = (timestamp - self->start) / 1000000;
this->dir = probefunc == "zfs_read" ? "R" : "W";
printf("%-20Y %-16s %1s %4d %6d %sn", walltimestamp,
execname, this->dir, self->kb, this->iotime,
self->path != NULL ? stringof(self->path) : "<null>");
}
[...]
• zfsslower.d originated from the DTrace book
Monday, October 1, 12](https://image.slidesharecdn.com/dtracecloud2012-121001163711-phpapp02/75/DTraceCloud2012-61-2048.jpg)
![Slow disks, cont.
• The operator can use deeper tools as needed. Anywhere in ZFS.
# dtrace -n 'io:::start { @[stack()] = count(); }'
dtrace: description 'io:::start ' matched 6 probes
^C
genunix`ldi_strategy+0x53
zfs`vdev_disk_io_start+0xcc
zfs`zio_vdev_io_start+0xab
zfs`zio_execute+0x88
zfs`zio_nowait+0x21
zfs`vdev_mirror_io_start+0xcd
zfs`zio_vdev_io_start+0x250
zfs`zio_execute+0x88
zfs`zio_nowait+0x21
zfs`arc_read_nolock+0x4f9
zfs`arc_read+0x96
zfs`dsl_read+0x44
zfs`dbuf_read_impl+0x166
zfs`dbuf_read+0xab
zfs`dmu_buf_hold_array_by_dnode+0x189
zfs`dmu_buf_hold_array+0x78
zfs`dmu_read_uio+0x5c
zfs`zfs_read+0x1a3
genunix`fop_read+0x8b
genunix`read+0x2a7
143
Monday, October 1, 12](https://image.slidesharecdn.com/dtracecloud2012-121001163711-phpapp02/75/DTraceCloud2012-62-2048.jpg)
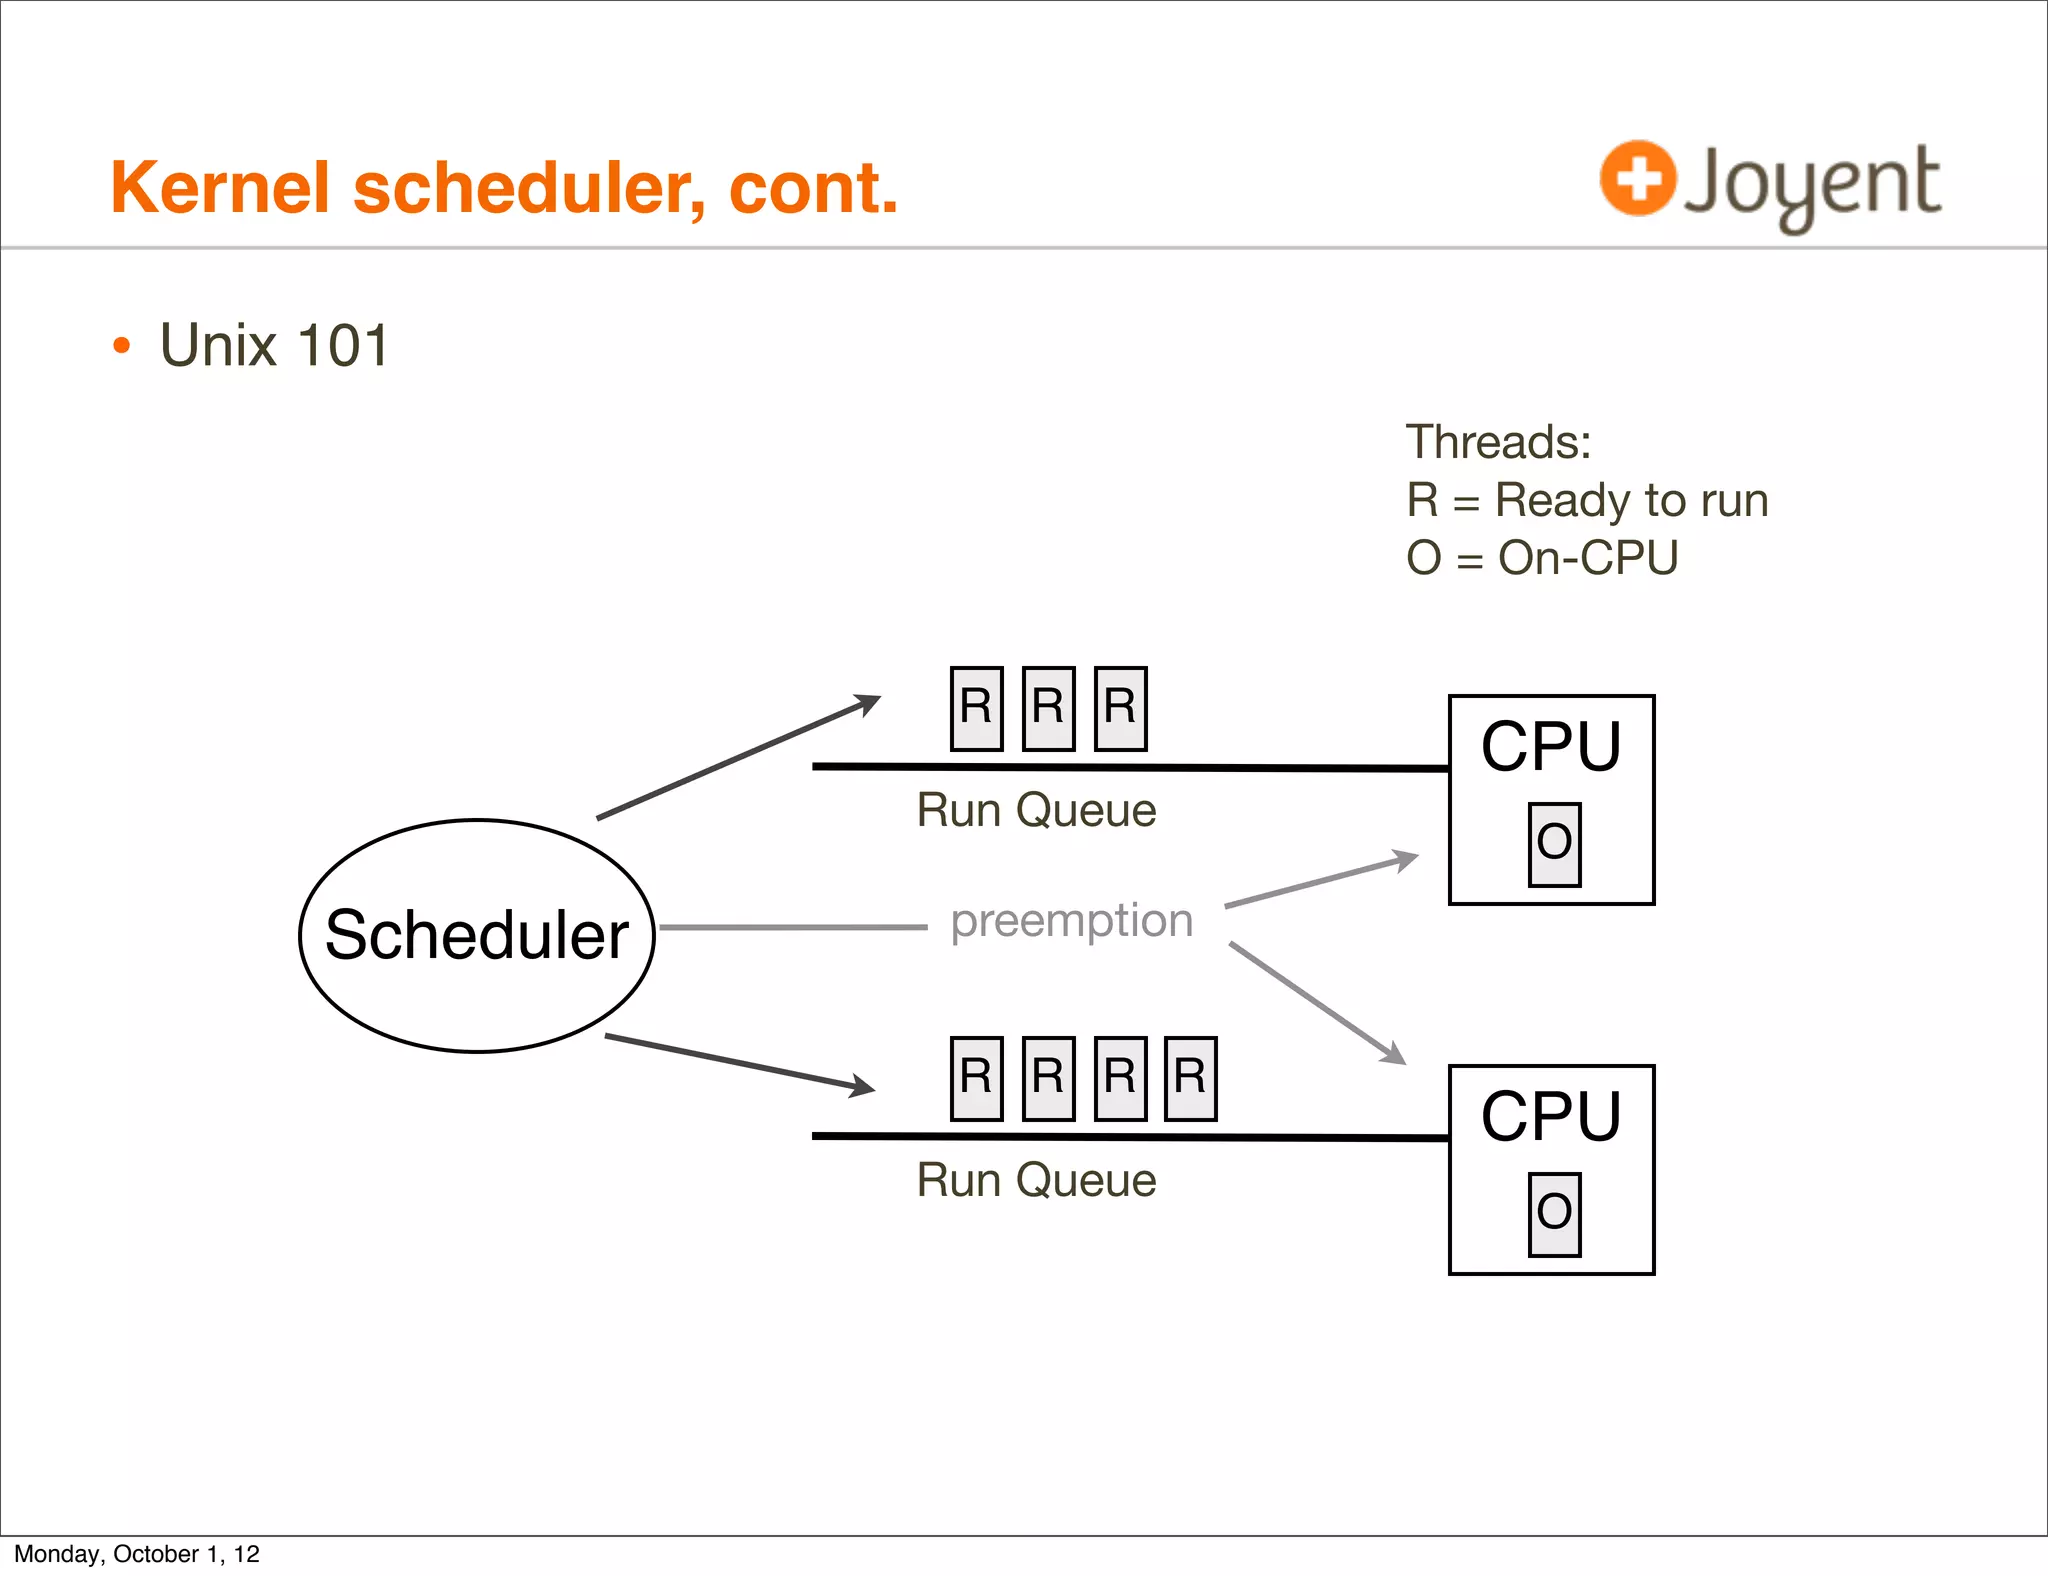
![Kernel scheduler
• Customer problem: occasional latency outliers
• Analysis: no smoking gun. No slow I/O or locks, etc. Some random
dispatcher queue latency, but with CPU headroom.
$ prstat -mLc 1
PID USERNAME USR SYS TRP TFL DFL LCK SLP LAT VCX ICX SCL SIG PROCESS/LWPID
17930 103 21 7.6 0.0 0.0 0.0 53 16 9.1 57K 1 73K 0 beam.smp/265
17930 103 20 7.0 0.0 0.0 0.0 57 16 0.4 57K 2 70K 0 beam.smp/264
17930 103 20 7.4 0.0 0.0 0.0 53 18 1.7 63K 0 78K 0 beam.smp/263
17930 103 19 6.7 0.0 0.0 0.0 60 14 0.4 52K 0 65K 0 beam.smp/266
17930 103 2.0 0.7 0.0 0.0 0.0 96 1.6 0.0 6K 0 8K 0 beam.smp/267
17930 103 1.0 0.9 0.0 0.0 0.0 97 0.9 0.0 4 0 47 0 beam.smp/280
[...]
Monday, October 1, 12](https://image.slidesharecdn.com/dtracecloud2012-121001163711-phpapp02/75/DTraceCloud2012-66-2048.jpg)
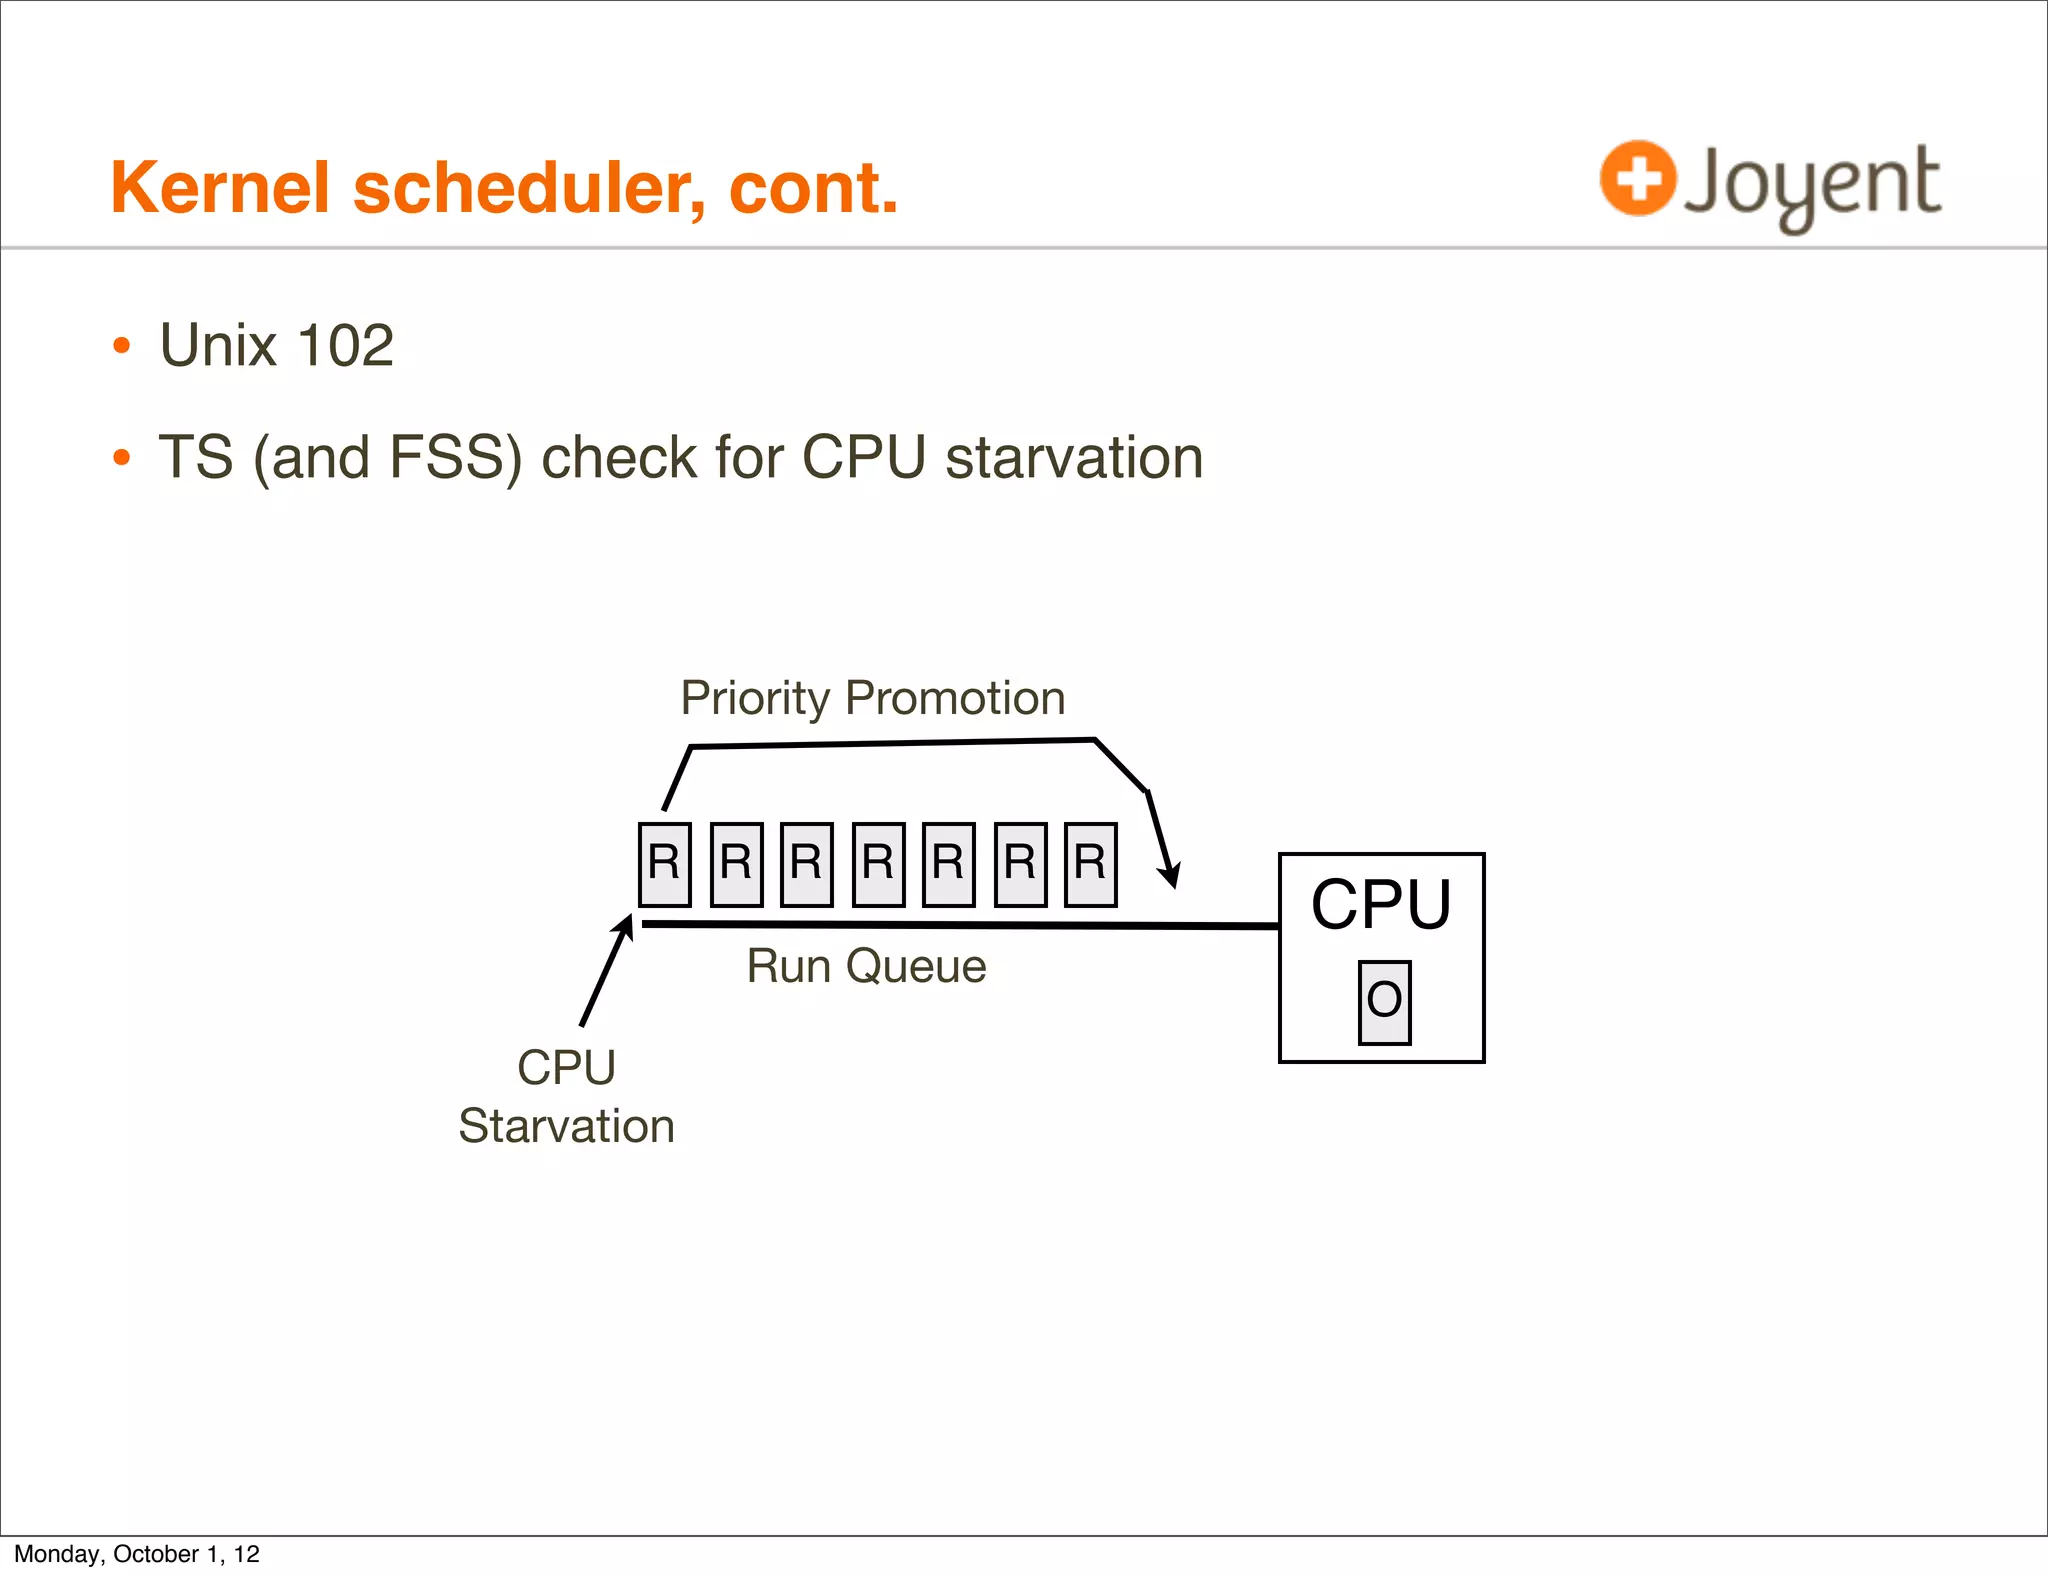
![Kernel scheduler, cont.
• Worst case (4 threads 1 CPU), 44 sec dispq latency
# dtrace -n 'sched:::off-cpu /execname == "burn1"/ { self->s = timestamp; }
sched:::on-cpu /self->s/ { @["off-cpu (ms)"] =
lquantize((timestamp - self->s) / 1000000, 0, 100000, 1000); self->s = 0; }'
off-cpu (ms)
value ------------- Distribution ------------- count
< 0 | 0
0 |@@@@@@@@@@@@@@@@@@@@@@@@@@@@@@@@@@@@@@@ 387184
1000 | 2256
2000 | 1078
3000 | Expected 862
4000 | 1070
5000 | Bad 637
[...]
6000 |
Inconceivable 535
41000 | 3
42000 | 2
43000 | 2
44000 | 1
45000 | 0
ts_maxwait @pri 59 = 32s, FSS uses ?
Monday, October 1, 12](https://image.slidesharecdn.com/dtracecloud2012-121001163711-phpapp02/75/DTraceCloud2012-71-2048.jpg)

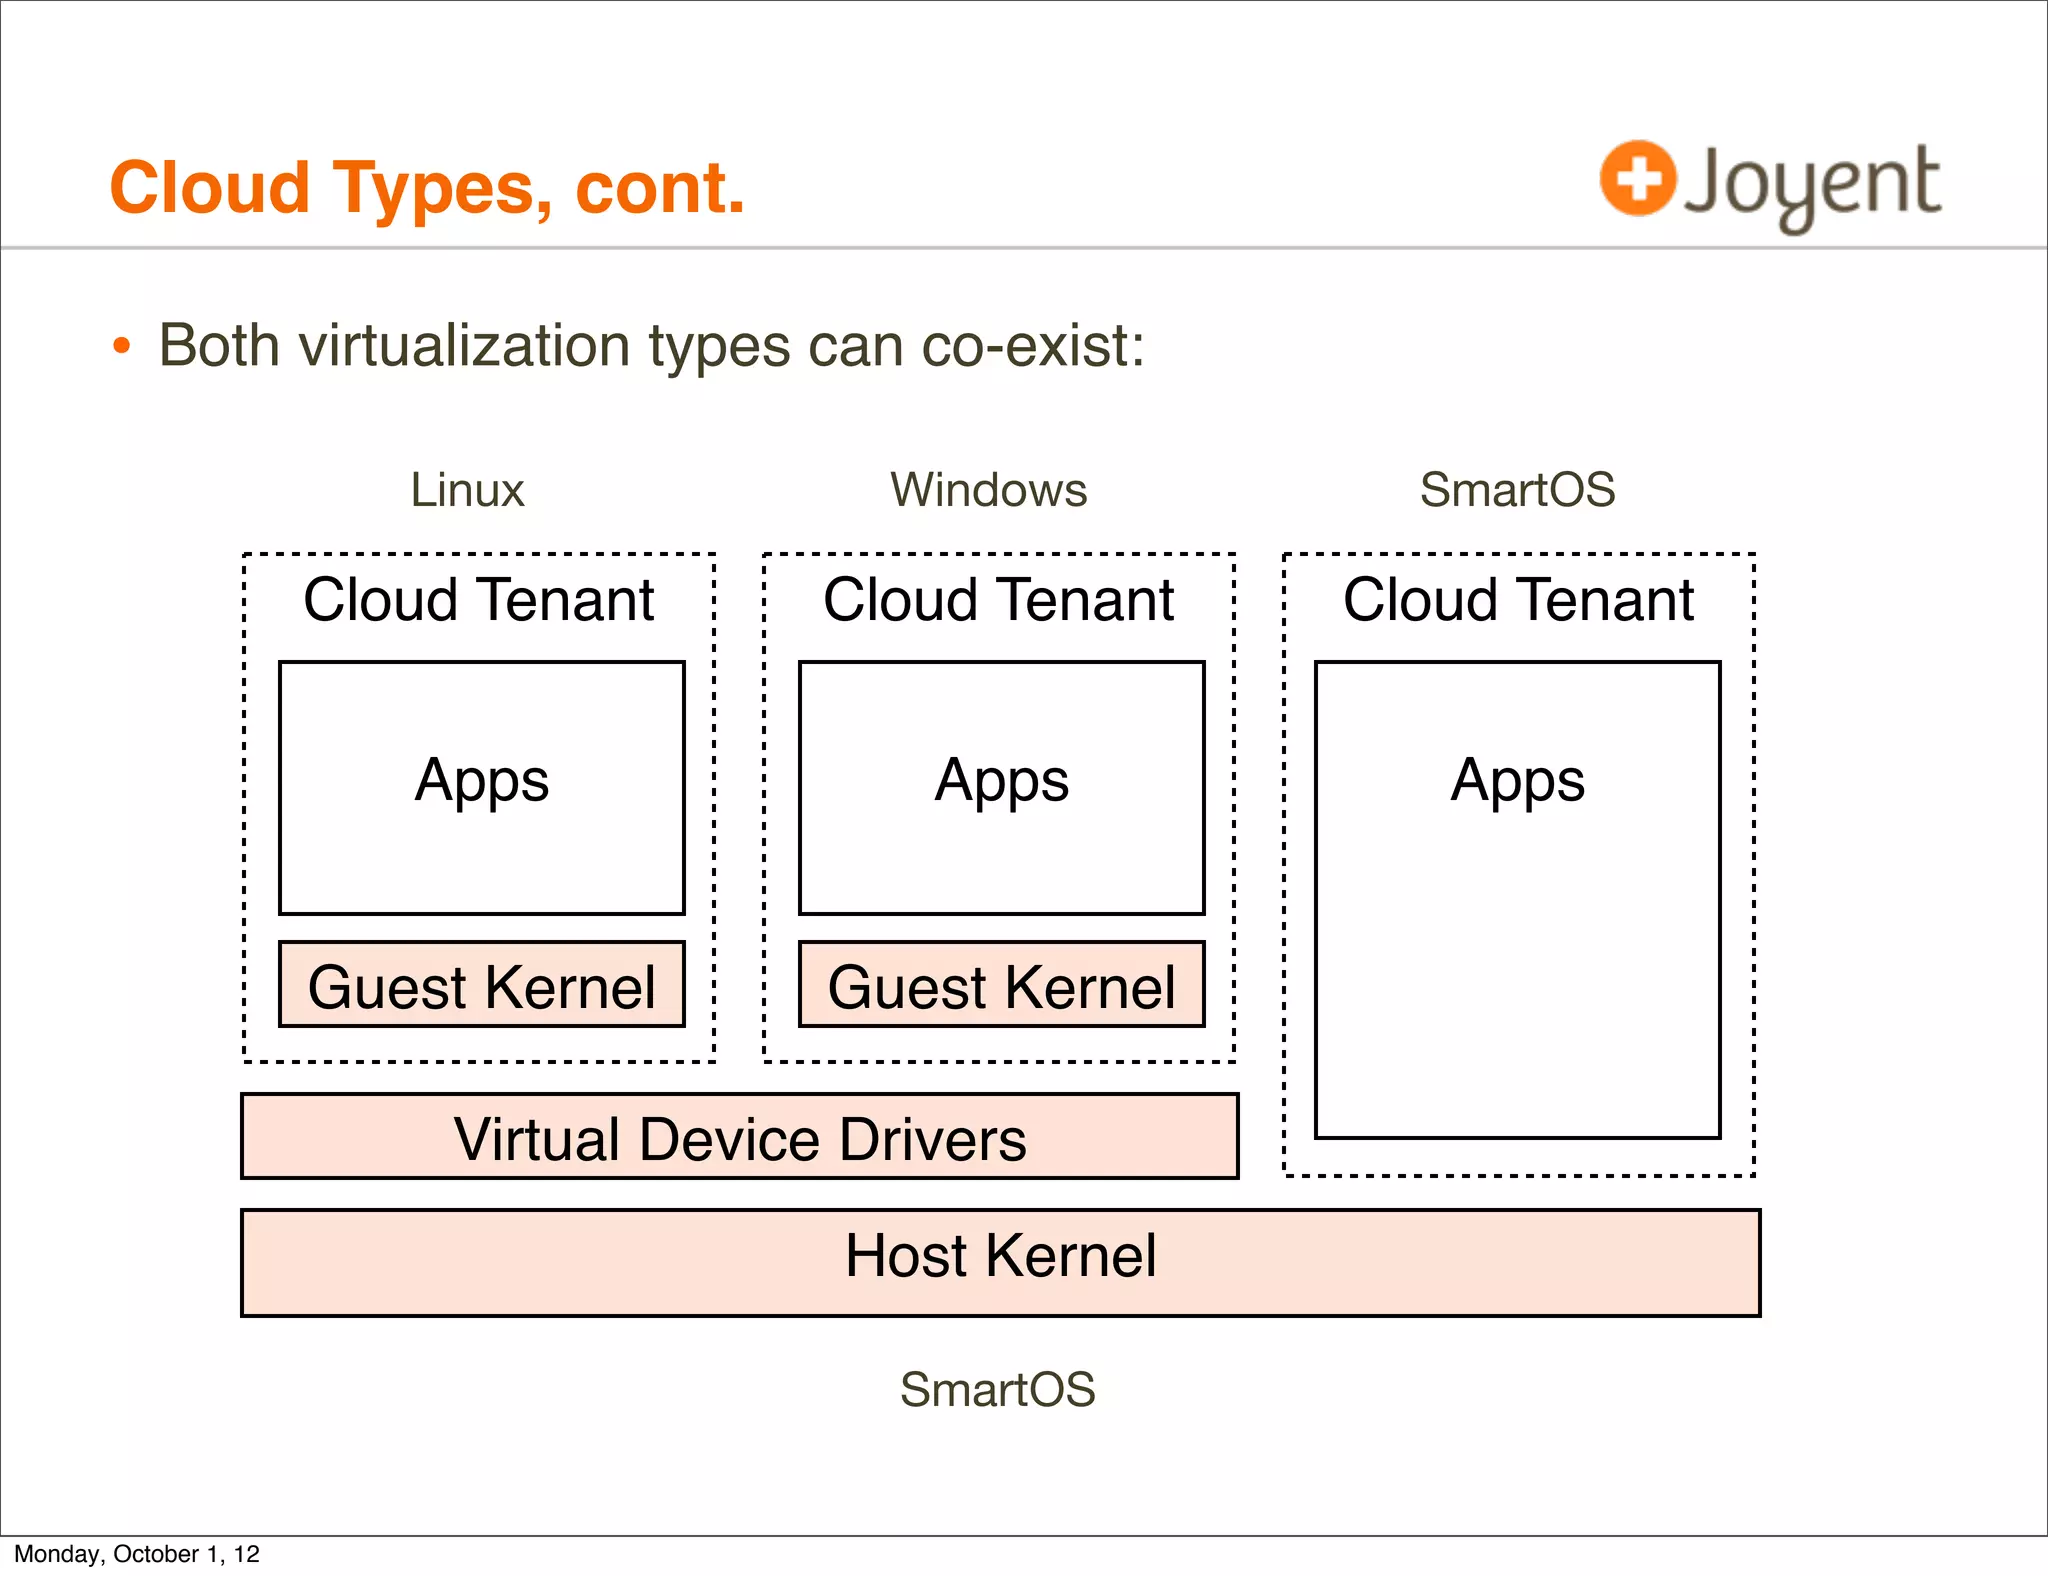
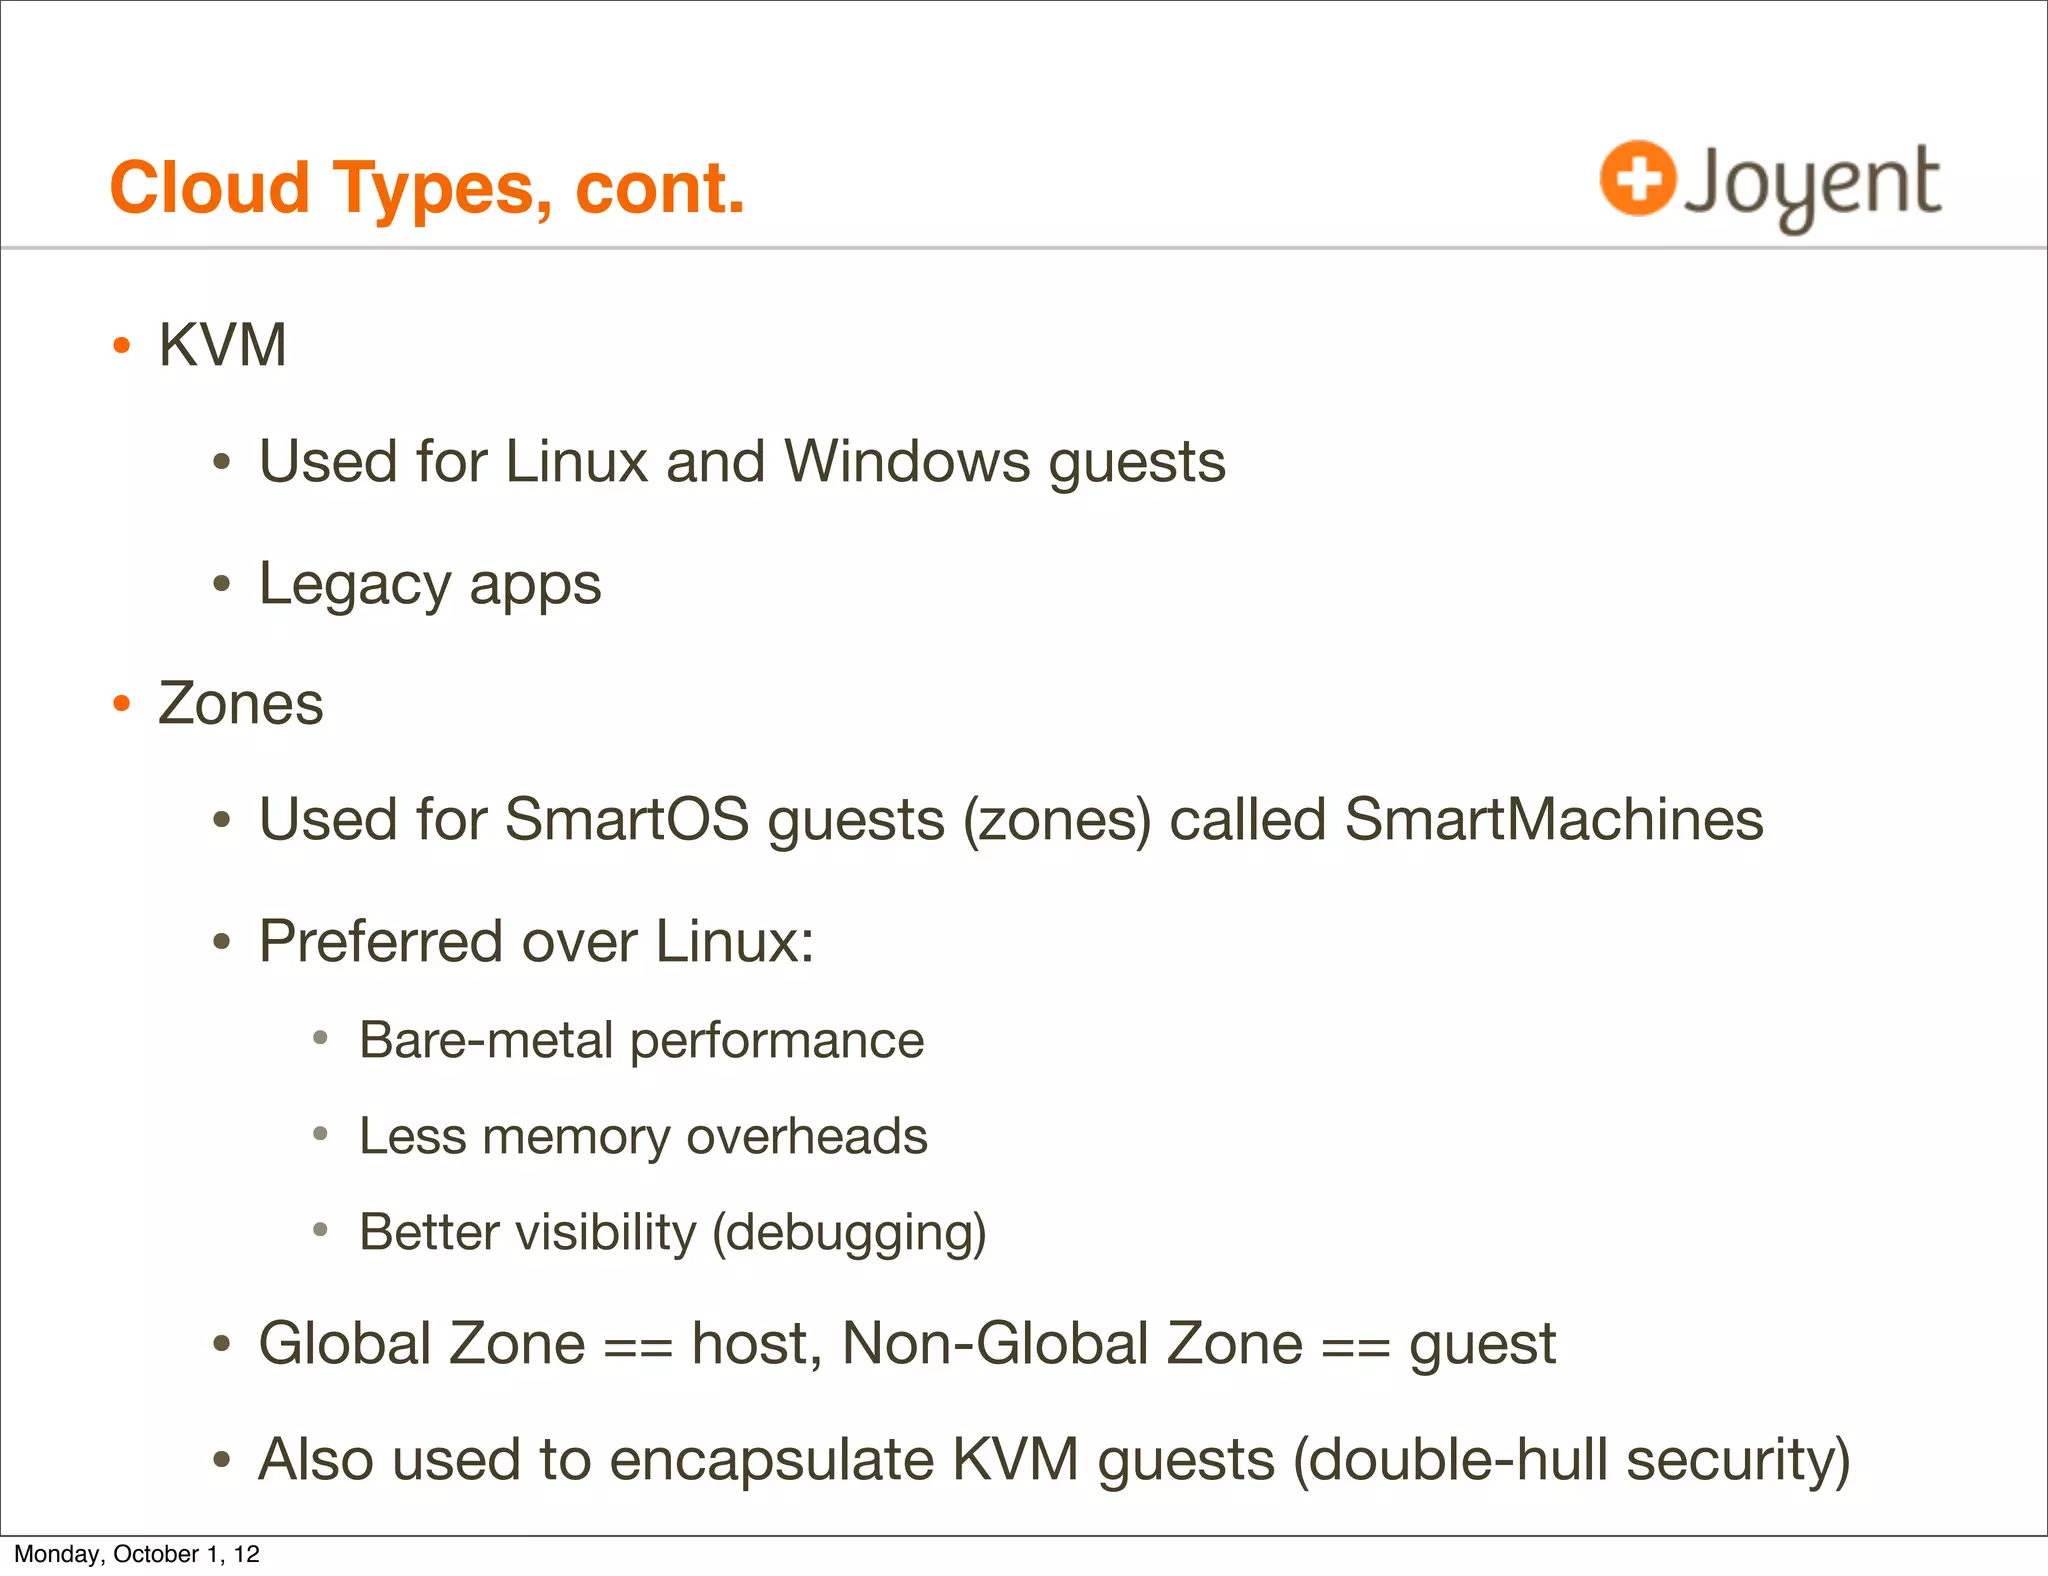
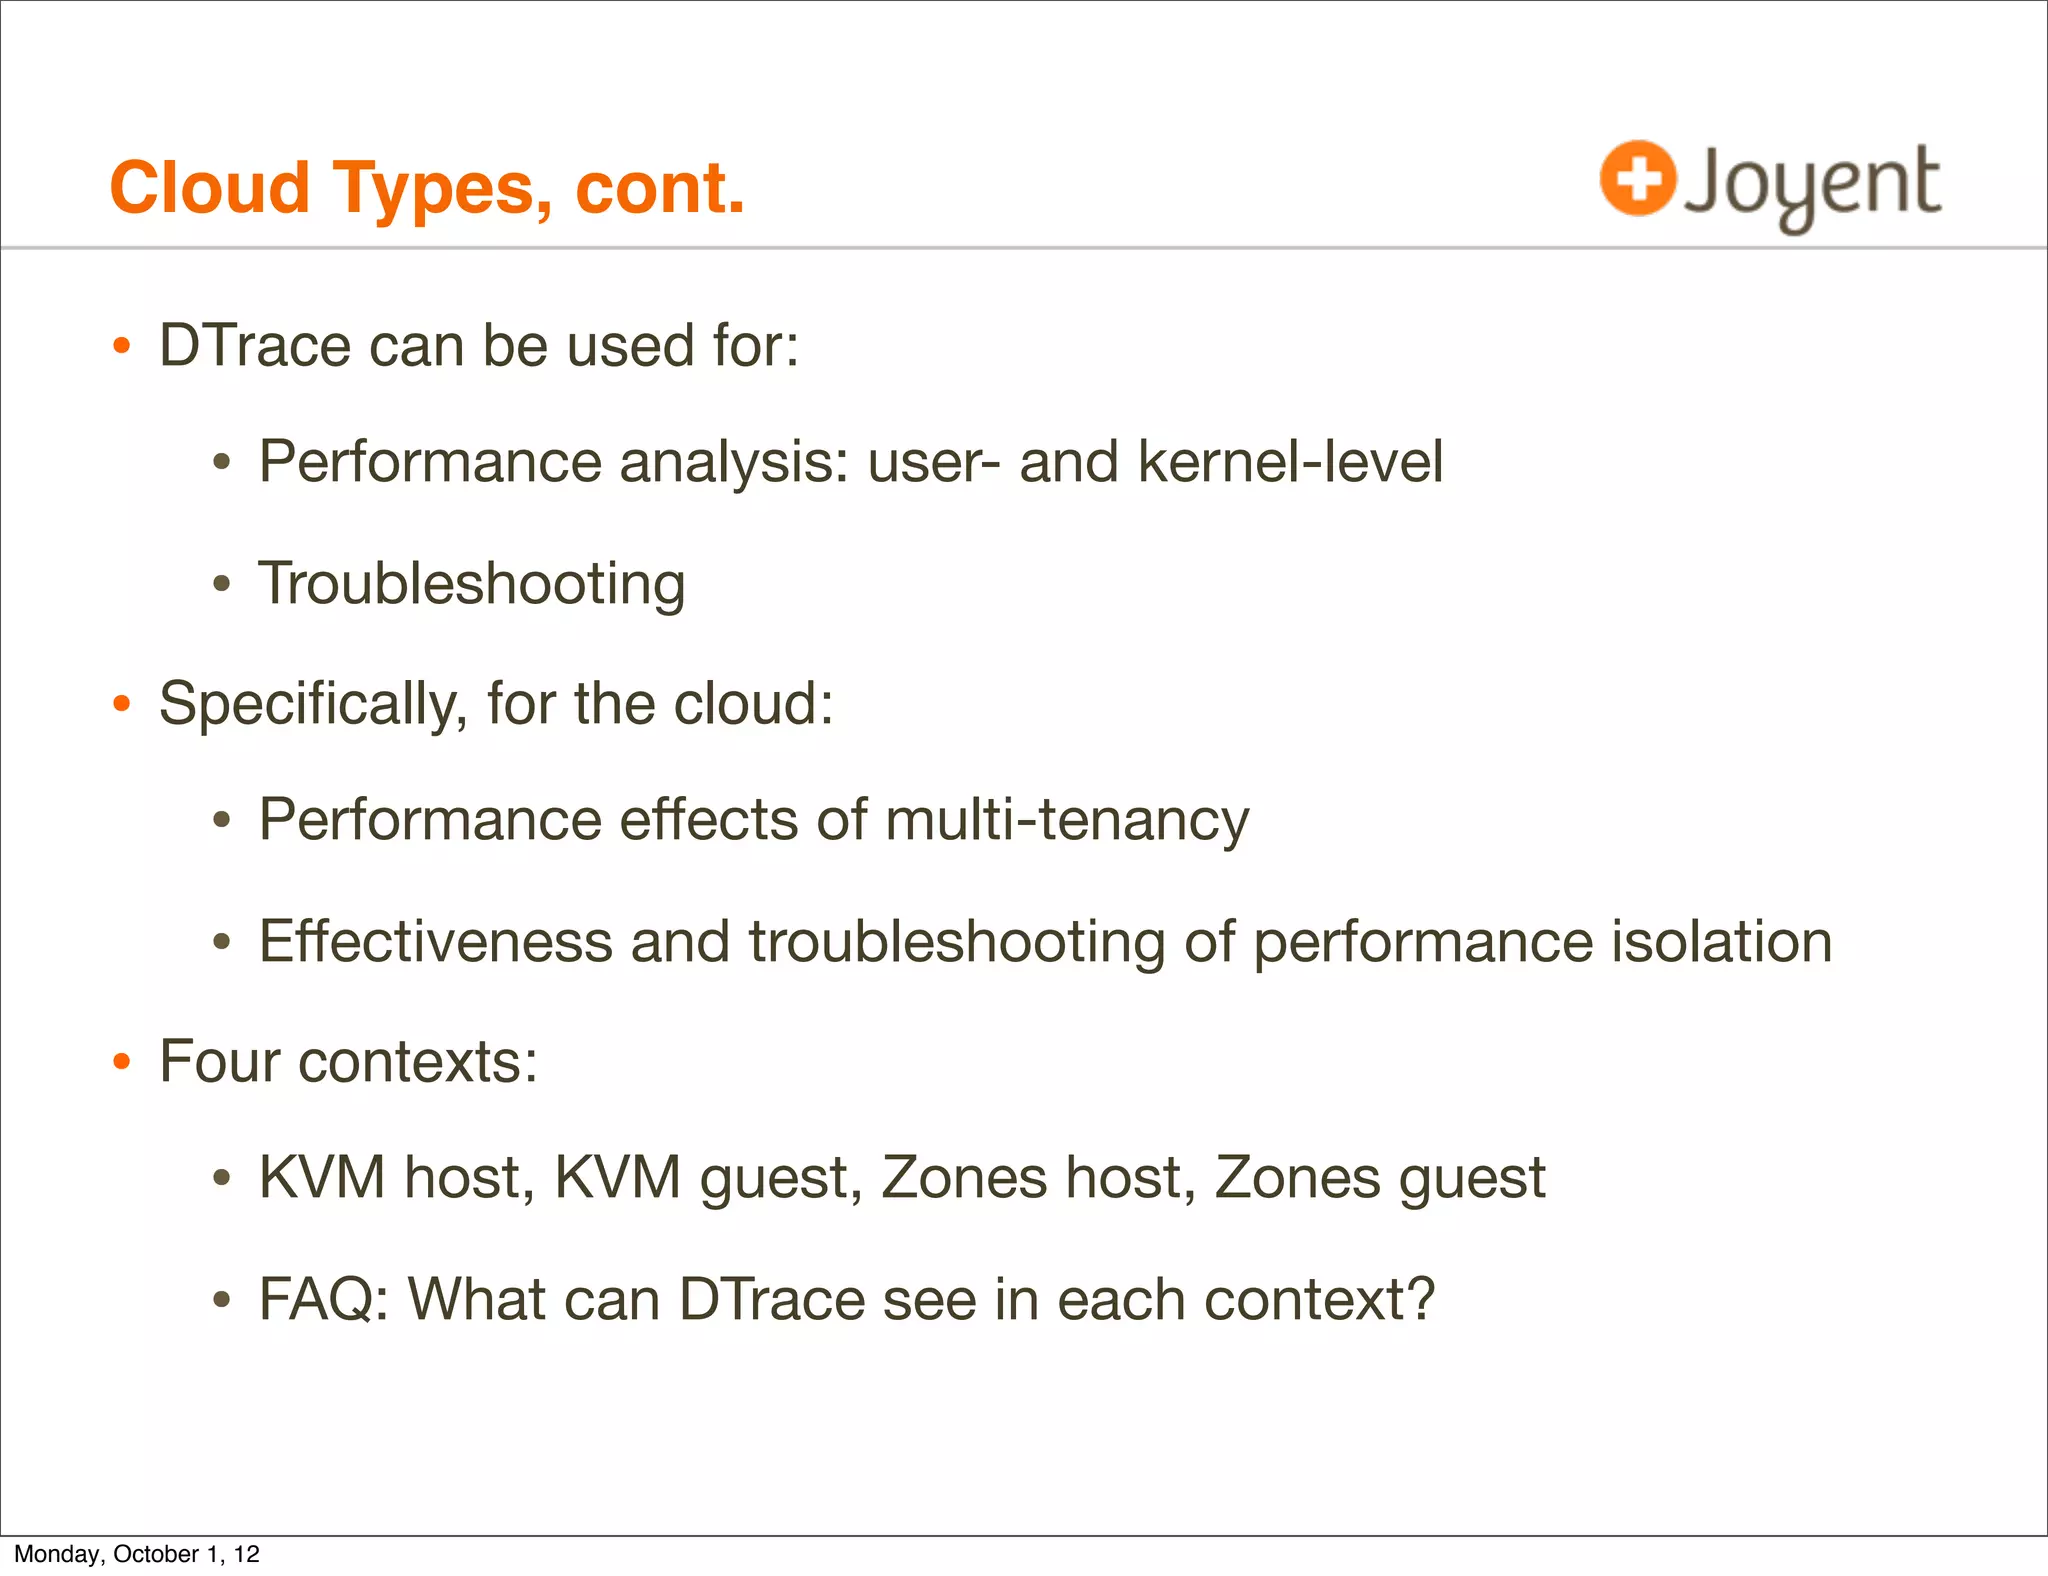
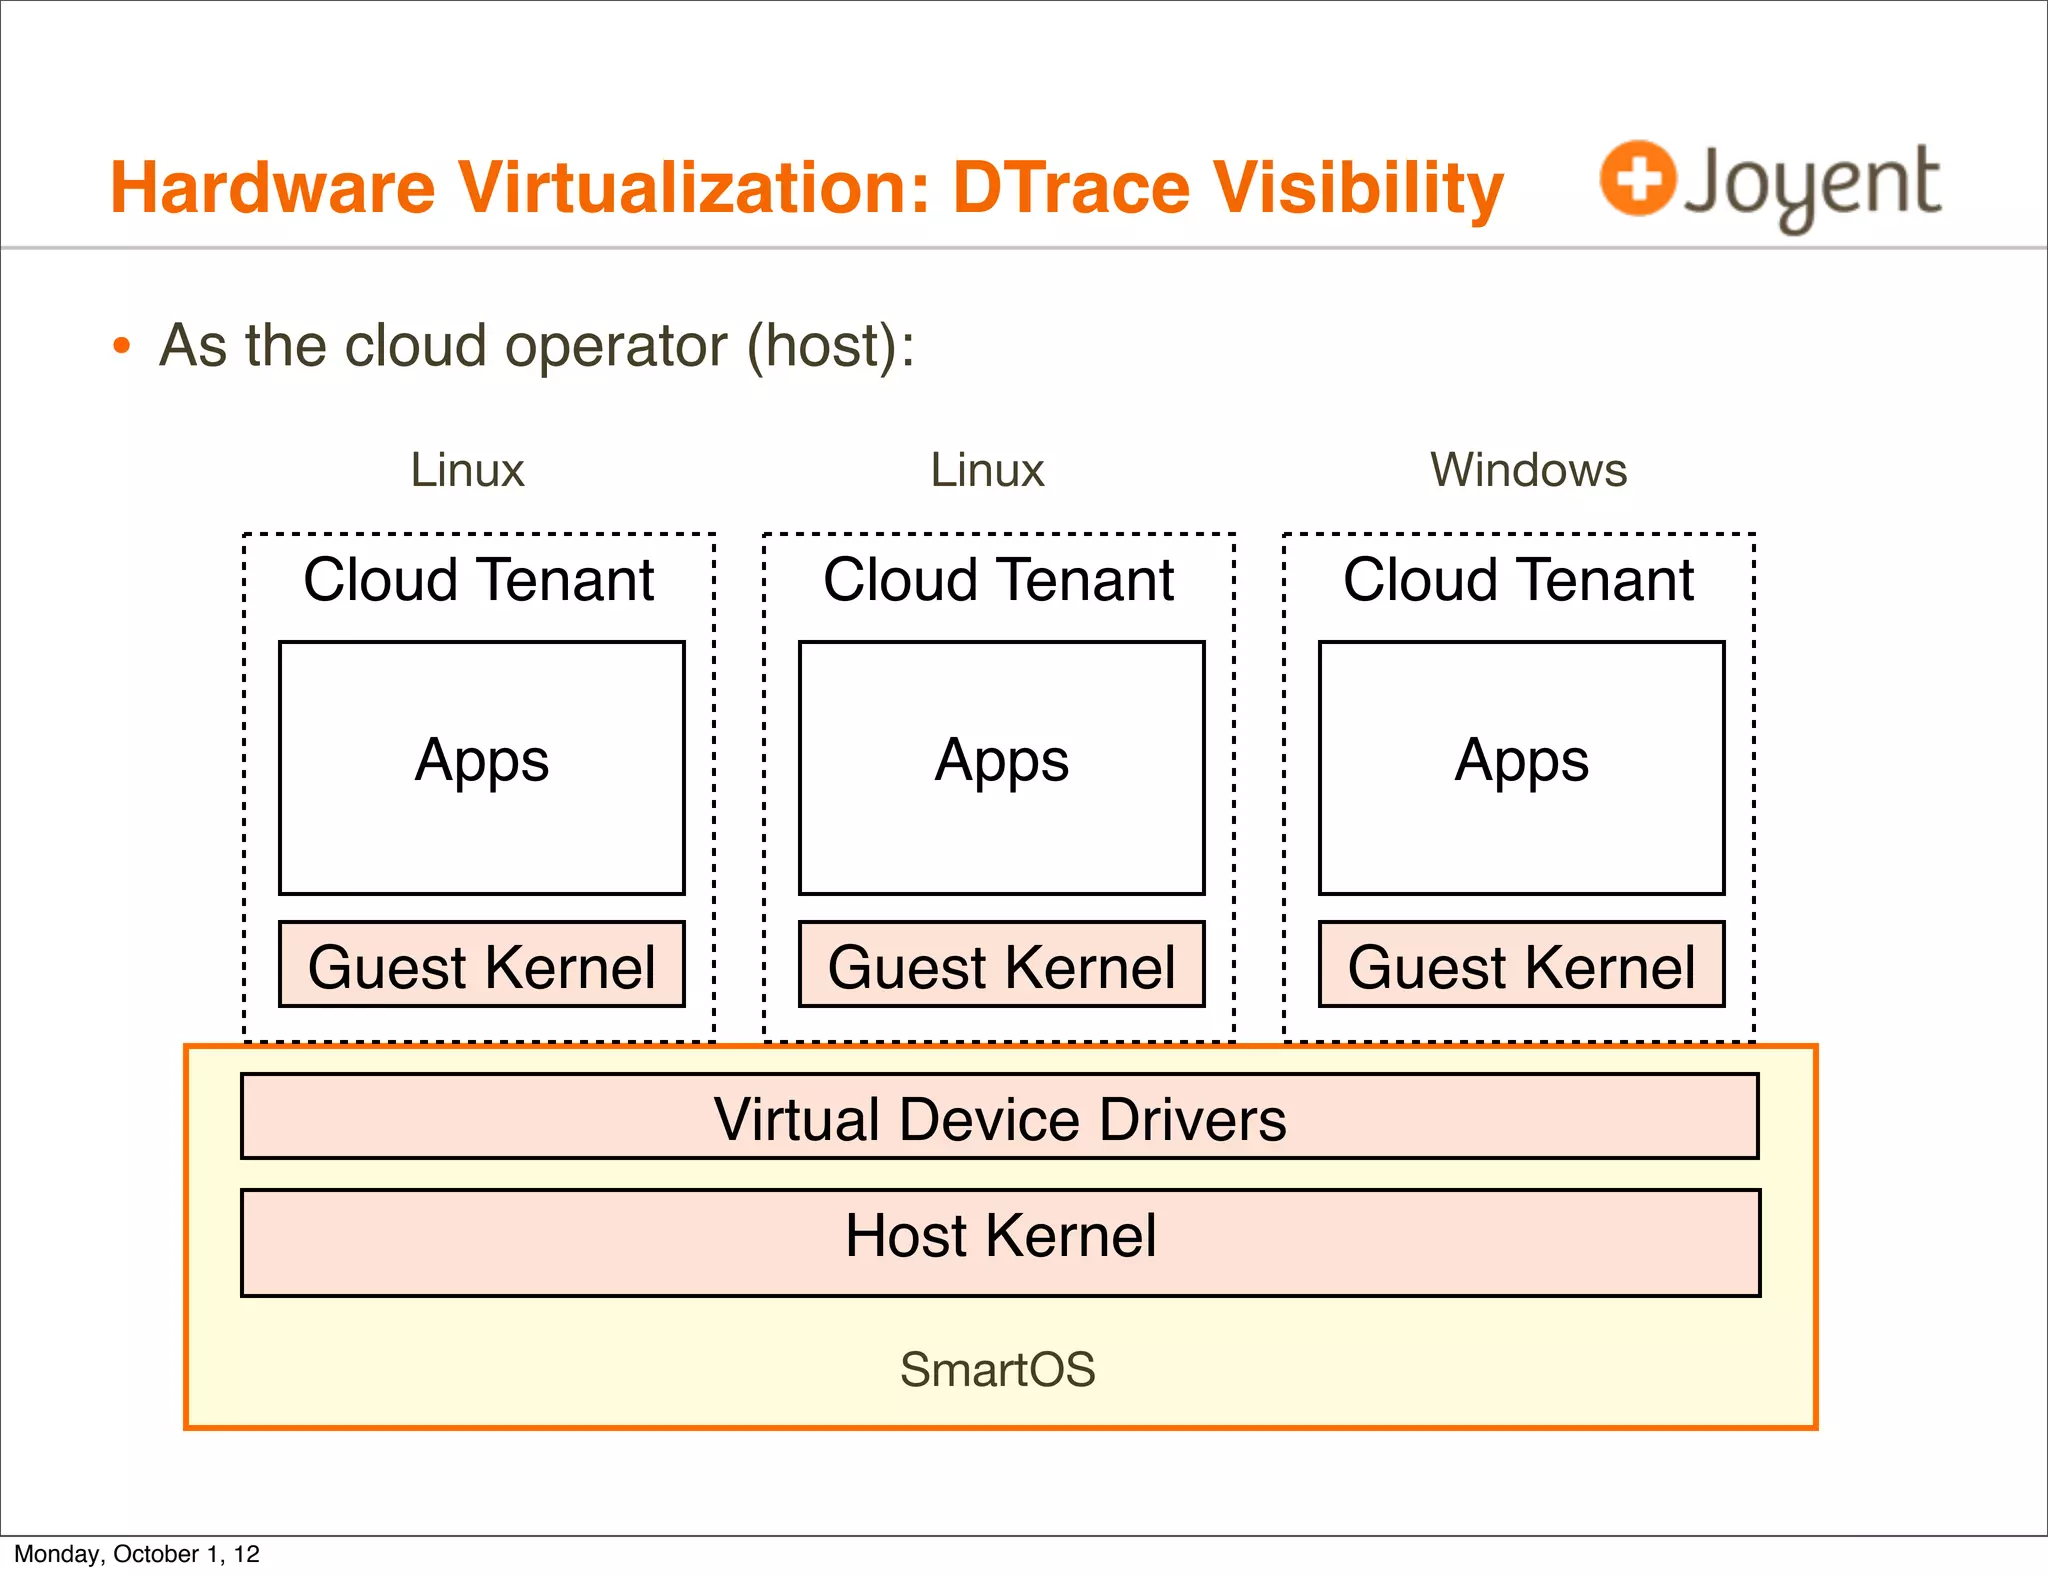
The document details the use of DTrace, a performance analysis and troubleshooting tool, specifically in cloud environments utilizing the SmartOS/illumos kernel. It discusses the capabilities of DTrace in various cloud virtualization types, including KVM and OS-level zones, and highlights its production safety and visibility features. Additionally, it presents several DTrace cloud tools and their applications in performance analysis and real-time monitoring.