Submit Search
Upload
Genomic Graphics
•
Download as DOCX, PDF
•
1 like
•
138 views
Dr. Volkan OBAN
Follow
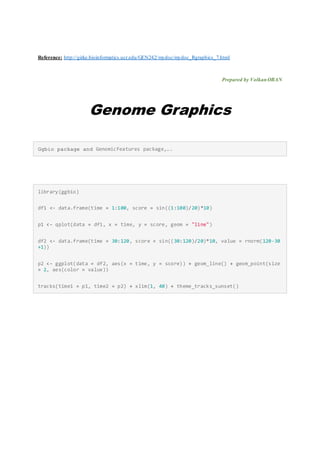
Reference: http://girke.bioinformatics.ucr.edu/GEN242/mydoc/mydoc_Rgraphics_7.html ggbio
Read less
Read more
Science
Report
Share
Report
Share
1 of 7
Download now
Recommended
Basic Calculus in R.
Dr. Volkan OBAN
ggplot2: An Extensible Platform for Publication-quality Graphics
Claus Wilke
Introduction to R
Introduction to R
Sander Kieft
cryptography_non_abeliean
NARAYANASWAMY CHANDRAMOWLISWARAN
Plot3D Package and Example in R.-Data visualizat,on
Dr. Volkan OBAN
Data visualization with multiple groups using ggplot2
Rupak Roy
Data visualization using the grammar of graphics
Rupak Roy
Geo Spatial Plot using R
Rupak Roy
Seg code
Seg code
wi7sonjoseph
Exercise 2
Exercise 2
math126
Semi vae memo (1)
Semi vae memo (1)
Masato Nakai
Semi vae memo (2)
Semi vae memo (2)
Masato Nakai
Mate tarea - 2º
Mate tarea - 2º
brisagaela29
Jacobi method for MATLAB
Taimoor Muzaffar Gondal
Animaton Package in R An Example:
Dr. Volkan OBAN
Irs gan doc
Irs gan doc
Masato Nakai
Joclad 2010 d
Joclad 2010 d
a1000caroliveira
Presentation1
Presentation1
m4ttjs
Divisor de 7
Divisor de 7
Danilo Fraga Dantas
Machine Learning Today: Current Research And Advances From AMLAB, UvA
Advanced-Concepts-Team
Ggplot
Ggplot
Jhojan Diaz Roa
Rkf
Rkf
faintcardy
Calc 7.3b
Calc 7.3b
hartcher
Quantum espresso G Vector distributon
Eric Pascolo
Introduction to Haskell@Open Source Conference 2007 Hokkaido
ikegami__
Caropro
Caropro
daquicaro
Public string sacar
Public string sacar
onlyhenry
ggtimeseries-->ggplot2 extensions
Dr. Volkan OBAN
Advanced Data Visualization in R- Somes Examples.
Dr. Volkan OBAN
imager package in R and examples..
Dr. Volkan OBAN
More Related Content
What's hot
Seg code
Seg code
wi7sonjoseph
Exercise 2
Exercise 2
math126
Semi vae memo (1)
Semi vae memo (1)
Masato Nakai
Semi vae memo (2)
Semi vae memo (2)
Masato Nakai
Mate tarea - 2º
Mate tarea - 2º
brisagaela29
Jacobi method for MATLAB
Taimoor Muzaffar Gondal
Animaton Package in R An Example:
Dr. Volkan OBAN
Irs gan doc
Irs gan doc
Masato Nakai
Joclad 2010 d
Joclad 2010 d
a1000caroliveira
Presentation1
Presentation1
m4ttjs
Divisor de 7
Divisor de 7
Danilo Fraga Dantas
Machine Learning Today: Current Research And Advances From AMLAB, UvA
Advanced-Concepts-Team
Ggplot
Ggplot
Jhojan Diaz Roa
Rkf
Rkf
faintcardy
Calc 7.3b
Calc 7.3b
hartcher
Quantum espresso G Vector distributon
Eric Pascolo
Introduction to Haskell@Open Source Conference 2007 Hokkaido
ikegami__
Caropro
Caropro
daquicaro
Public string sacar
Public string sacar
onlyhenry
What's hot
(19)
Seg code
Seg code
Exercise 2
Exercise 2
Semi vae memo (1)
Semi vae memo (1)
Semi vae memo (2)
Semi vae memo (2)
Mate tarea - 2º
Mate tarea - 2º
Jacobi method for MATLAB
Animaton Package in R An Example:
Irs gan doc
Irs gan doc
Joclad 2010 d
Joclad 2010 d
Presentation1
Presentation1
Divisor de 7
Divisor de 7
Machine Learning Today: Current Research And Advances From AMLAB, UvA
Ggplot
Ggplot
Rkf
Rkf
Calc 7.3b
Calc 7.3b
Quantum espresso G Vector distributon
Introduction to Haskell@Open Source Conference 2007 Hokkaido
Caropro
Caropro
Public string sacar
Public string sacar
Similar to Genomic Graphics
ggtimeseries-->ggplot2 extensions
Dr. Volkan OBAN
Advanced Data Visualization in R- Somes Examples.
Dr. Volkan OBAN
imager package in R and examples..
Dr. Volkan OBAN
Seminar PSU 09.04.2013 - 10.04.2013 MiFIT, Arbuzov Vyacheslav
Vyacheslav Arbuzov
数学カフェ 確率・統計・機械学習回 「速習 確率・統計」
Ken'ichi Matsui
Advanced Data Visualization Examples with R-Part II
Dr. Volkan OBAN
Aaron Ellison Keynote: Reaching the 99%
David LeBauer
Introduction to R
Introduction to R
agnonchik
CLUSTERGRAM
CLUSTERGRAM
Dr. Volkan OBAN
data-visualization.pdf
Juan José Rivas
R + Hadoop = Big Data Analytics. How Revolution Analytics' RHadoop Project Al...
Revolution Analytics
R-ggplot2 package Examples
Dr. Volkan OBAN
Surface3d in R and rgl package.
Dr. Volkan OBAN
Python grass
Python grass
Margherita Di Leo
Script jantung copy
Script jantung copy
Nurwahidah Abidin
Rtutorial
Rtutorial
Dheeraj Dwivedi
Data visualization-2.1
RenukaRajmohan
R meets Hadoop
R meets Hadoop
Hidekazu Tanaka
8. R Graphics with R
FAO
VISIALIZACION DE DATA.pdf
Ivan Bautista Fuentes
Similar to Genomic Graphics
(20)
ggtimeseries-->ggplot2 extensions
Advanced Data Visualization in R- Somes Examples.
imager package in R and examples..
Seminar PSU 09.04.2013 - 10.04.2013 MiFIT, Arbuzov Vyacheslav
数学カフェ 確率・統計・機械学習回 「速習 確率・統計」
Advanced Data Visualization Examples with R-Part II
Aaron Ellison Keynote: Reaching the 99%
Introduction to R
Introduction to R
CLUSTERGRAM
CLUSTERGRAM
data-visualization.pdf
R + Hadoop = Big Data Analytics. How Revolution Analytics' RHadoop Project Al...
R-ggplot2 package Examples
Surface3d in R and rgl package.
Python grass
Python grass
Script jantung copy
Script jantung copy
Rtutorial
Rtutorial
Data visualization-2.1
R meets Hadoop
R meets Hadoop
8. R Graphics with R
VISIALIZACION DE DATA.pdf
More from Dr. Volkan OBAN
Conference Paper:IMAGE PROCESSING AND OBJECT DETECTION APPLICATION: INSURANCE...
Dr. Volkan OBAN
Covid19py Python Package - Example
Dr. Volkan OBAN
Object detection with Python
Dr. Volkan OBAN
Python - Rastgele Orman(Random Forest) Parametreleri
Dr. Volkan OBAN
Linear Programming wi̇th R - Examples
Dr. Volkan OBAN
"optrees" package in R and examples.(optrees:finds optimal trees in weighted ...
Dr. Volkan OBAN
k-means Clustering in Python
Dr. Volkan OBAN
Naive Bayes Example using R
Dr. Volkan OBAN
R forecasting Example
Dr. Volkan OBAN
k-means Clustering and Custergram with R
Dr. Volkan OBAN
Data Science and its Relationship to Big Data and Data-Driven Decision Making
Dr. Volkan OBAN
Data Visualization with R.ggplot2 and its extensions examples.
Dr. Volkan OBAN
Scikit-learn Cheatsheet-Python
Dr. Volkan OBAN
Python Pandas for Data Science cheatsheet
Dr. Volkan OBAN
Pandas,scipy,numpy cheatsheet
Dr. Volkan OBAN
ReporteRs package in R. forming powerpoint documents-an example
Dr. Volkan OBAN
ReporteRs package in R. forming powerpoint documents-an example
Dr. Volkan OBAN
R Machine Learning packages( generally used)
Dr. Volkan OBAN
treemap package in R and examples.
Dr. Volkan OBAN
Mosaic plot in R.
Mosaic plot in R.
Dr. Volkan OBAN
More from Dr. Volkan OBAN
(20)
Conference Paper:IMAGE PROCESSING AND OBJECT DETECTION APPLICATION: INSURANCE...
Covid19py Python Package - Example
Object detection with Python
Python - Rastgele Orman(Random Forest) Parametreleri
Linear Programming wi̇th R - Examples
"optrees" package in R and examples.(optrees:finds optimal trees in weighted ...
k-means Clustering in Python
Naive Bayes Example using R
R forecasting Example
k-means Clustering and Custergram with R
Data Science and its Relationship to Big Data and Data-Driven Decision Making
Data Visualization with R.ggplot2 and its extensions examples.
Scikit-learn Cheatsheet-Python
Python Pandas for Data Science cheatsheet
Pandas,scipy,numpy cheatsheet
ReporteRs package in R. forming powerpoint documents-an example
R Machine Learning packages( generally used)
treemap package in R and examples.
Mosaic plot in R.
Mosaic plot in R.
Recently uploaded
Asymmetry in the atmosphere of the ultra-hot Jupiter WASP-76 b
Sérgio Sacani
Biogenic Sulfur Gases as Biosignatures on Temperate Sub-Neptune Waterworlds
Sérgio Sacani
PossibleEoarcheanRecordsoftheGeomagneticFieldPreservedintheIsuaSupracrustalBe...
Sérgio Sacani
Pests of mustard_Identification_Management_Dr.UPR.pdf
PirithiRaju
9654467111 Call Girls In Raj Nagar Delhi Short 1500 Night 6000
Sapana Sha
GBSN - Microbiology (Unit 2)
Areesha Ahmad
Nanoparticles synthesis and characterization
kaibalyasahoo82800
Kochi ❤CALL GIRL 84099*07087 ❤CALL GIRLS IN Kochi ESCORT SERVICE❤CALL GIRL
kantirani197
Animal Communication- Auditory and Visual.pptx
UmerFayaz5
Pests of cotton_Borer_Pests_Binomics_Dr.UPR.pdf
PirithiRaju
GBSN - Biochemistry (Unit 1)
Areesha Ahmad
Isotopic evidence of long-lived volcanism on Io
Sérgio Sacani
COST ESTIMATION FOR A RESEARCH PROJECT.pptx
FarihaAbdulRasheed
Pests of cotton_Sucking_Pests_Dr.UPR.pdf
PirithiRaju
VIRUSES structure and classification ppt by Dr.Prince C P
PRINCE C P
Discovery of an Accretion Streamer and a Slow Wide-angle Outflow around FUOri...
Sérgio Sacani
Presentation Vikram Lander by Vedansh Gupta.pptx
gindu3009
Stunning ➥8448380779▻ Call Girls In Panchshil Enclave Delhi NCR
Delhi Call girls
Zoology 4th semester series (krishna).pdf
Sumit Kumar yadav
Chemical Tests; flame test, positive and negative ions test Edexcel Internati...
ssuser79fe74
Recently uploaded
(20)
Asymmetry in the atmosphere of the ultra-hot Jupiter WASP-76 b
Biogenic Sulfur Gases as Biosignatures on Temperate Sub-Neptune Waterworlds
PossibleEoarcheanRecordsoftheGeomagneticFieldPreservedintheIsuaSupracrustalBe...
Pests of mustard_Identification_Management_Dr.UPR.pdf
9654467111 Call Girls In Raj Nagar Delhi Short 1500 Night 6000
GBSN - Microbiology (Unit 2)
Nanoparticles synthesis and characterization
Kochi ❤CALL GIRL 84099*07087 ❤CALL GIRLS IN Kochi ESCORT SERVICE❤CALL GIRL
Animal Communication- Auditory and Visual.pptx
Pests of cotton_Borer_Pests_Binomics_Dr.UPR.pdf
GBSN - Biochemistry (Unit 1)
Isotopic evidence of long-lived volcanism on Io
COST ESTIMATION FOR A RESEARCH PROJECT.pptx
Pests of cotton_Sucking_Pests_Dr.UPR.pdf
VIRUSES structure and classification ppt by Dr.Prince C P
Discovery of an Accretion Streamer and a Slow Wide-angle Outflow around FUOri...
Presentation Vikram Lander by Vedansh Gupta.pptx
Stunning ➥8448380779▻ Call Girls In Panchshil Enclave Delhi NCR
Zoology 4th semester series (krishna).pdf
Chemical Tests; flame test, positive and negative ions test Edexcel Internati...
Genomic Graphics
1.
Reference: http://girke.bioinformatics.ucr.edu/GEN242/mydoc/mydoc_Rgraphics_7.html Prepared by
VolkanOBAN Genome Graphics Ggbio package and GenomicFeatures package,…. library(ggbio) df1 <- data.frame(time = 1:100, score = sin((1:100)/20)*10) p1 <- qplot(data = df1, x = time, y = score, geom = "line") df2 <- data.frame(time = 30:120, score = sin((30:120)/20)*10, value = rnorm(120-30 +1)) p2 <- ggplot(data = df2, aes(x = time, y = score)) + geom_line() + geom_point(size = 2, aes(color = value)) tracks(time1 = p1, time2 = p2) + xlim(1, 40) + theme_tracks_sunset()
2.
Plotting genomic ranges library(GenomicRanges) set.seed(1);
N <- 100; gr <- GRanges(seqnames = sample(c("chr1", "chr2", "chr3"), size = N, replace = TRUE), IRanges(start = sample(1:300, size = N, replace = TRUE) , width = sample(70:75, size = N,replace = TRUE)), strand = sample(c("+", "-"), si ze = N, replace = TRUE), value = rnorm(N, 10, 3), score = rnorm(N, 100, 30), sampl e = sample(c("Normal", "Tumor"), size = N, replace = TRUE), pair = sample(letters, size = N, replace = TRUE)) autoplot(gr, aes(color = strand, fill = strand), facets = strand ~ seqnames)
3.
autoplot(gr, aes(color =
strand, fill = strand), facets = strand ~ seqnames, stat = "coverage")
4.
library(ggplot2) pos <- sapply(coverage(gr[strand(gr)=="+"]),
as.numeric) pos <- data.frame(Chr=rep(names(pos), sapply(pos, length)), Strand=rep("+", length (unlist(pos))), Position=unlist(sapply(pos, function(x) 1:length(x))), Coverage=as .numeric(unlist(pos))) neg <- sapply(coverage(gr[strand(gr)=="-"]), as.numeric) neg <- data.frame(Chr=rep(names(neg), sapply(neg, length)), Strand=rep("-", length (unlist(neg))), Position=unlist(sapply(neg, function(x) 1:length(x))), Coverage=-a s.numeric(unlist(neg))) covdf <- rbind(pos, neg) p <- ggplot(covdf, aes(Position, Coverage, fill=Strand)) +
5.
geom_bar(stat="identity", position="identity") +
facet_wrap(~Chr) p Circular genome plots ggplot(gr) + layout_circle(aes(fill = seqnames), geom = "rect")
6.
More complex circular
example seqlengths(gr) <- c(400, 500, 700) values(gr)$to.gr <- gr[sample(1:length(gr), size = length(gr))] idx <- sample(1:length(gr), size = 50) gr <- gr[idx] ggplot() + layout_circle(gr, geom = "ideo", fill = "gray70", radius = 7, trackWidt h = 3) + layout_circle(gr, geom = "bar", radius = 10, trackWidth = 4, aes(fill = score, y = score)) + layout_circle(gr, geom = "point", color = "red", radius = 14,
7.
trackWidth = 3,
grid = TRUE, aes(y = score)) + layout_circle(gr, geom = "link", linked.to = "to.gr", radius = 6, trackWidth = 1 )
Download now