Downloaded 18 times


![© 2015 Phase2
How to Diagnose
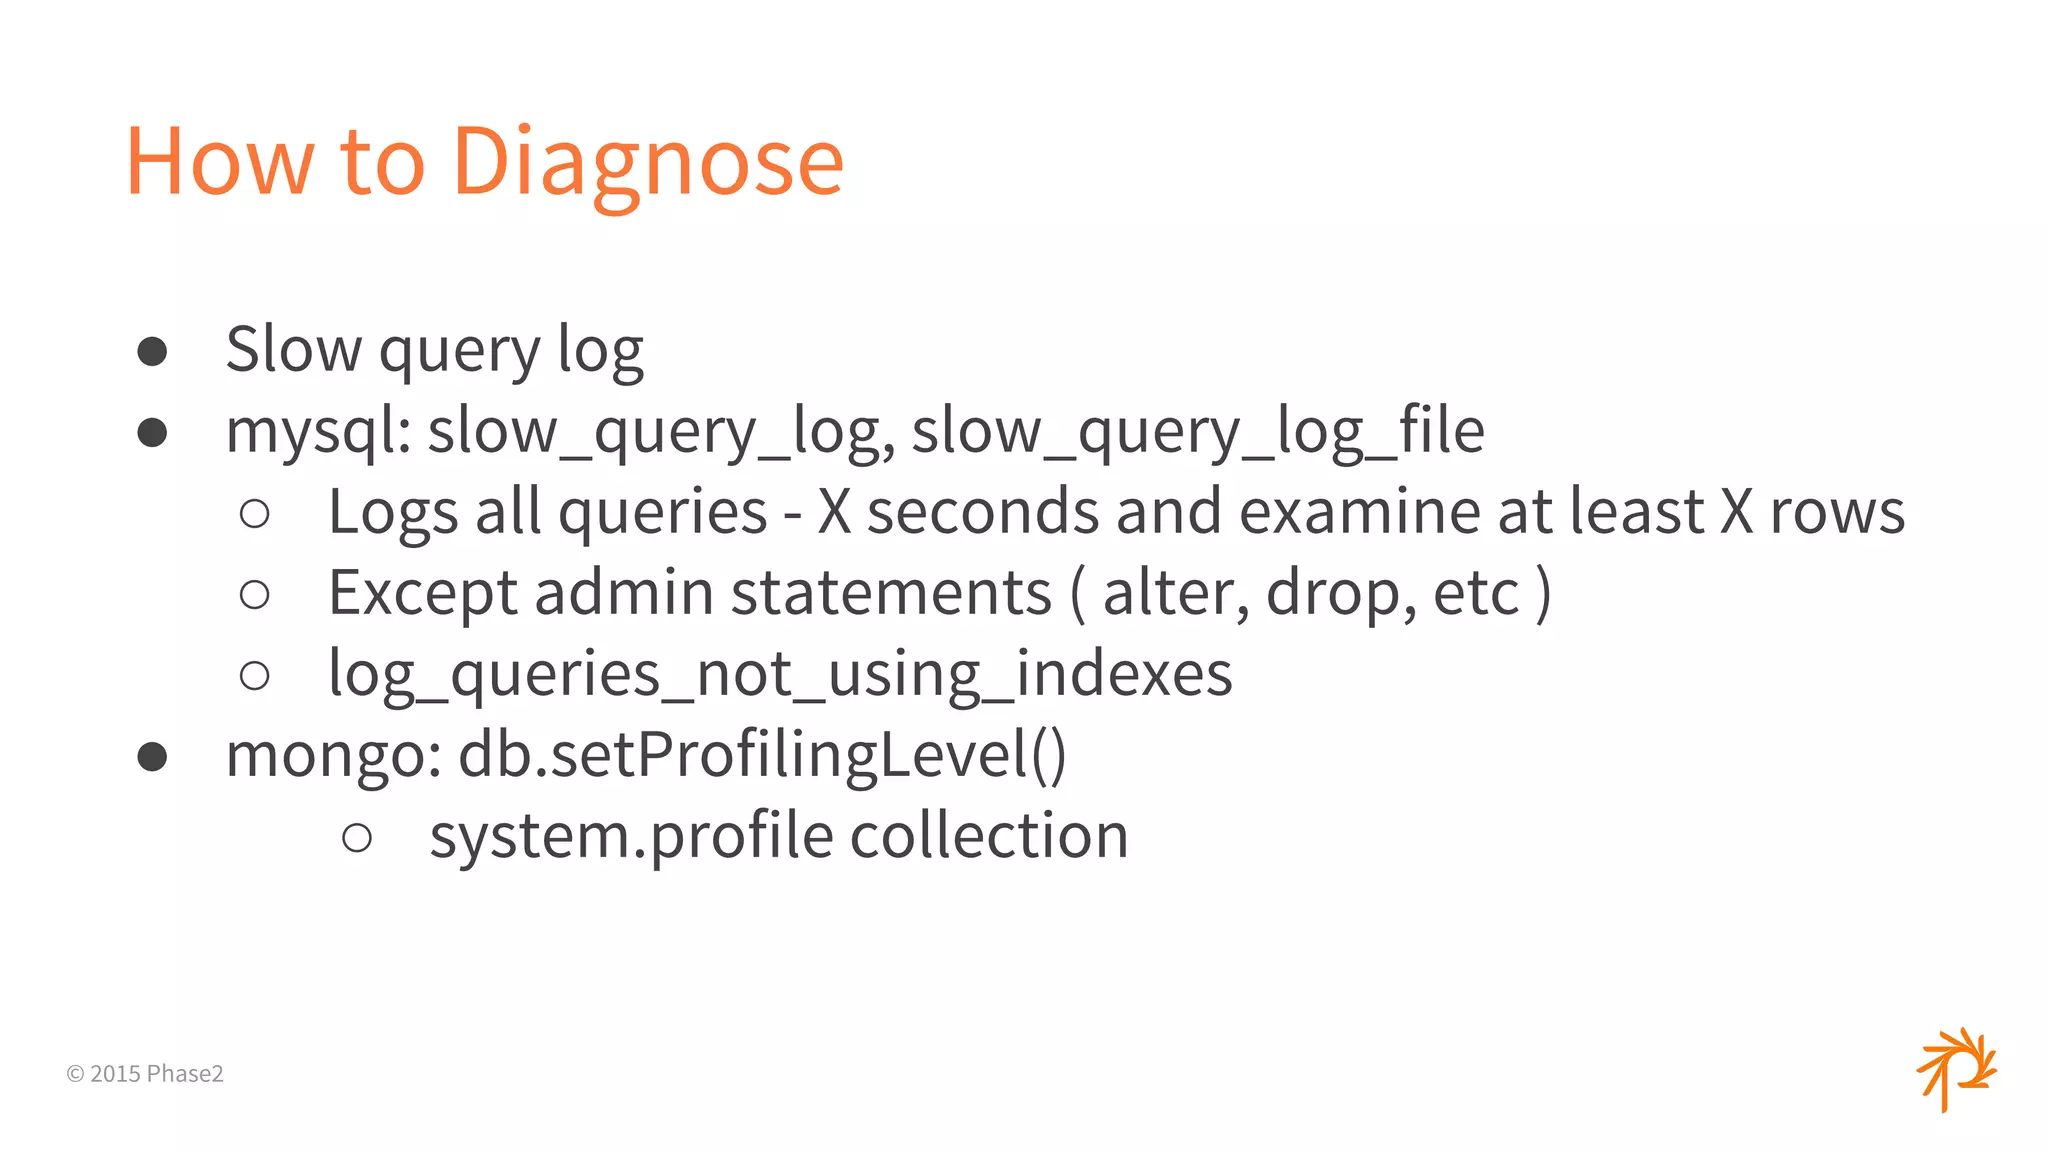
● SHOW [FULL] PROCESSLIST
○ Sending data, Copying to tmp table, Locked, etc
● mysqldumpslow
● Percona: pt-query-digest
● Logging in your app](https://image.slidesharecdn.com/performanceprofilingtoolstricks-ato2015-151022180331-lva1-app6892/75/Performance-Profiling-Tools-and-Tricks-35-2048.jpg)
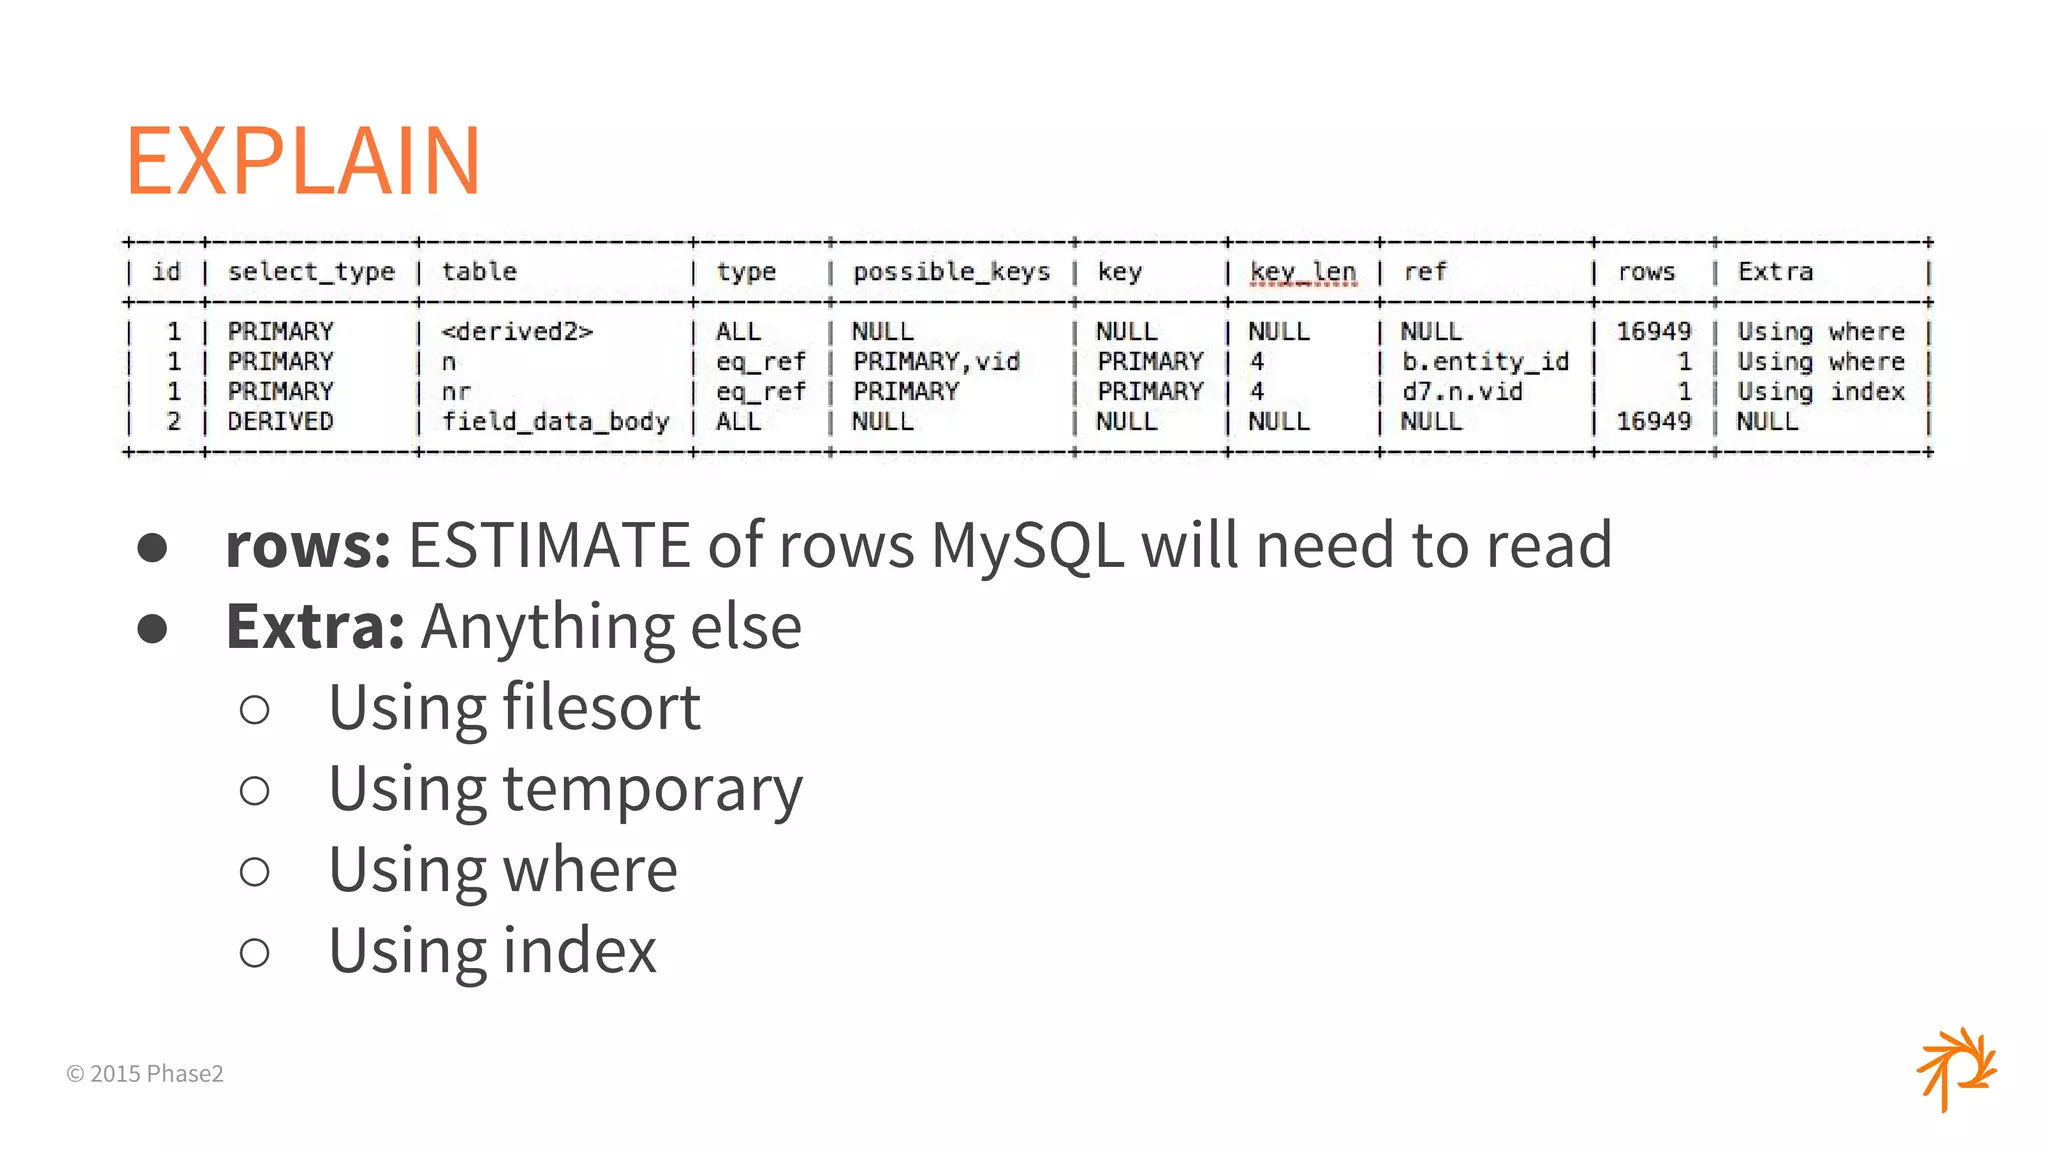
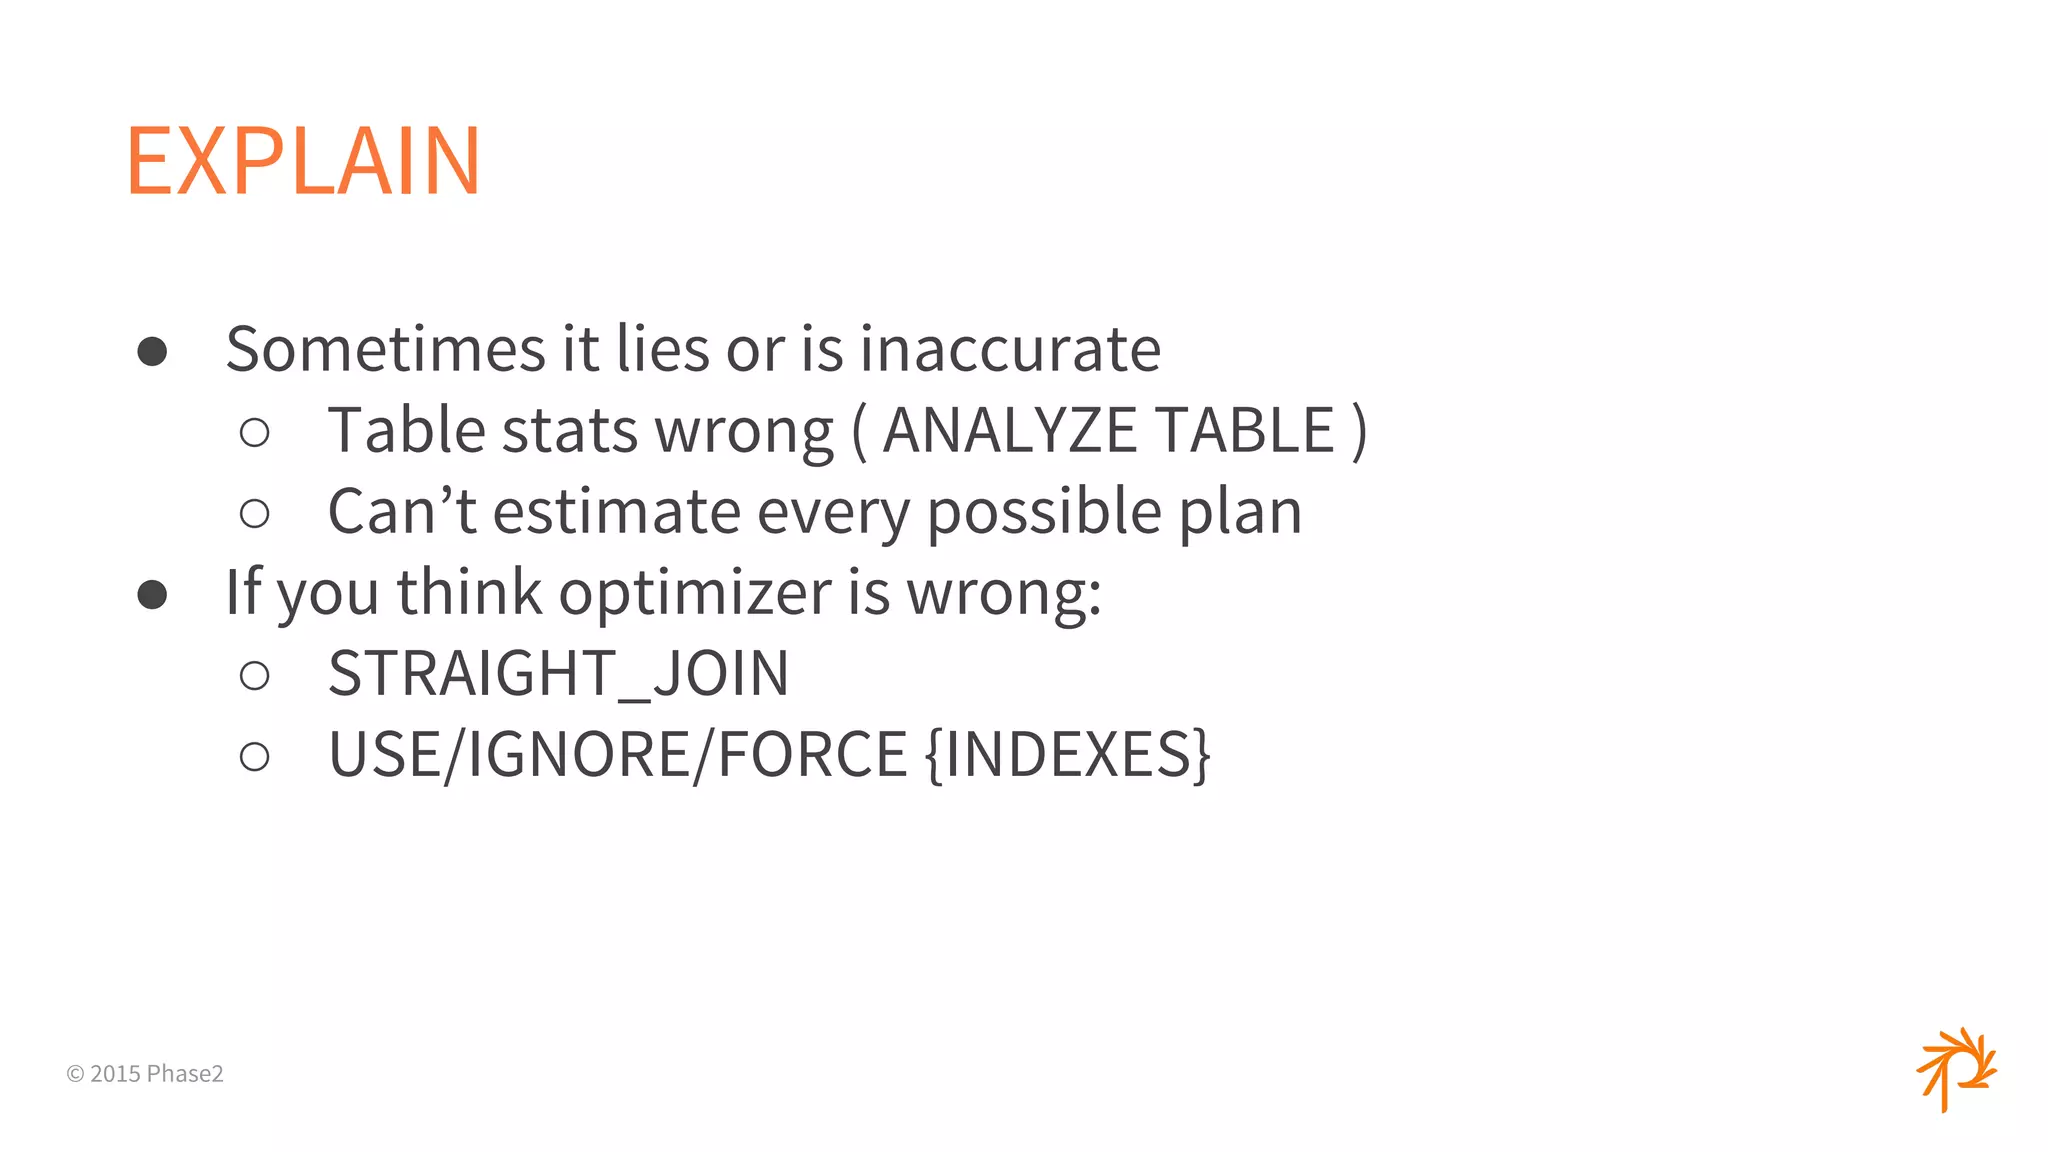

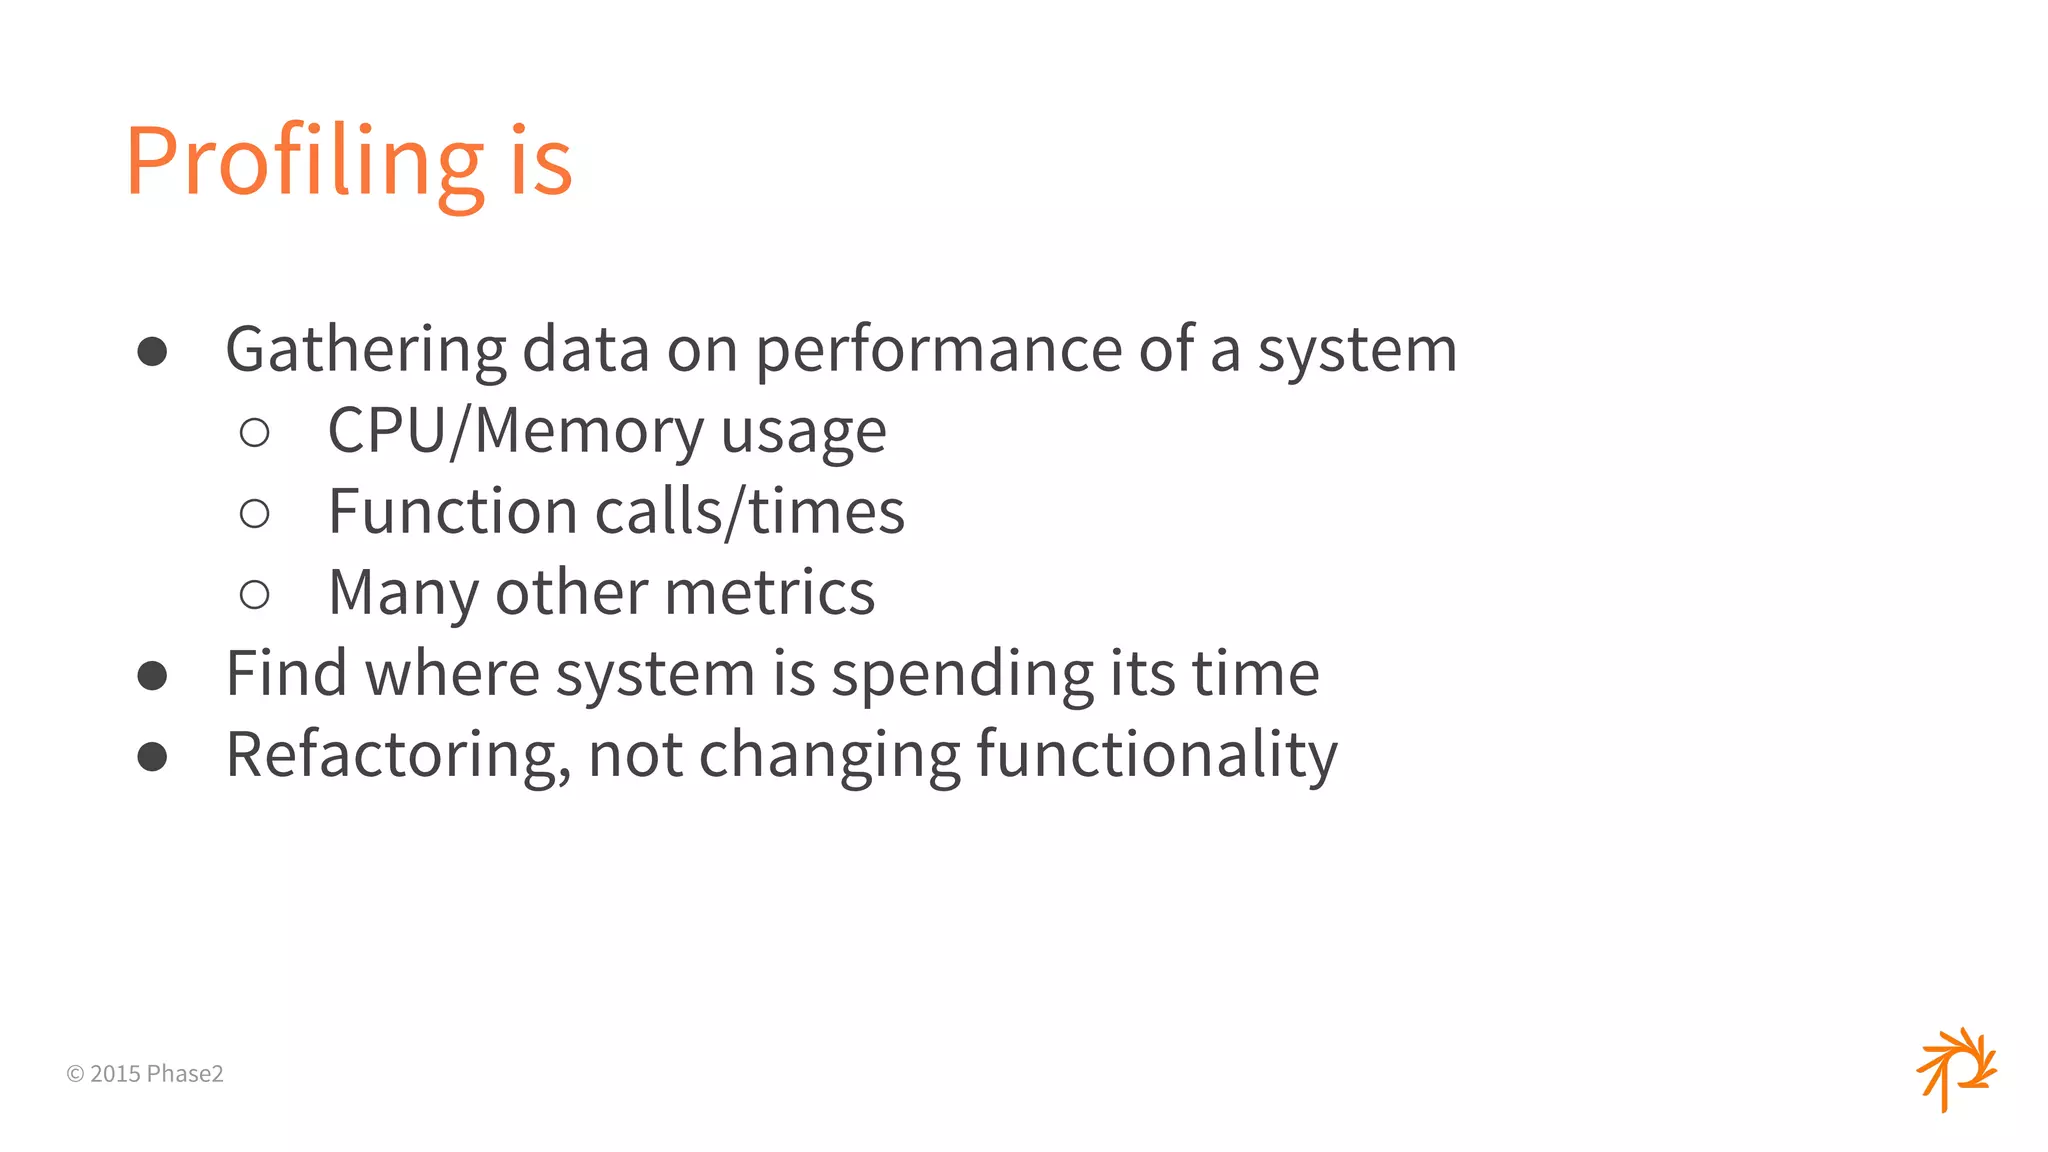
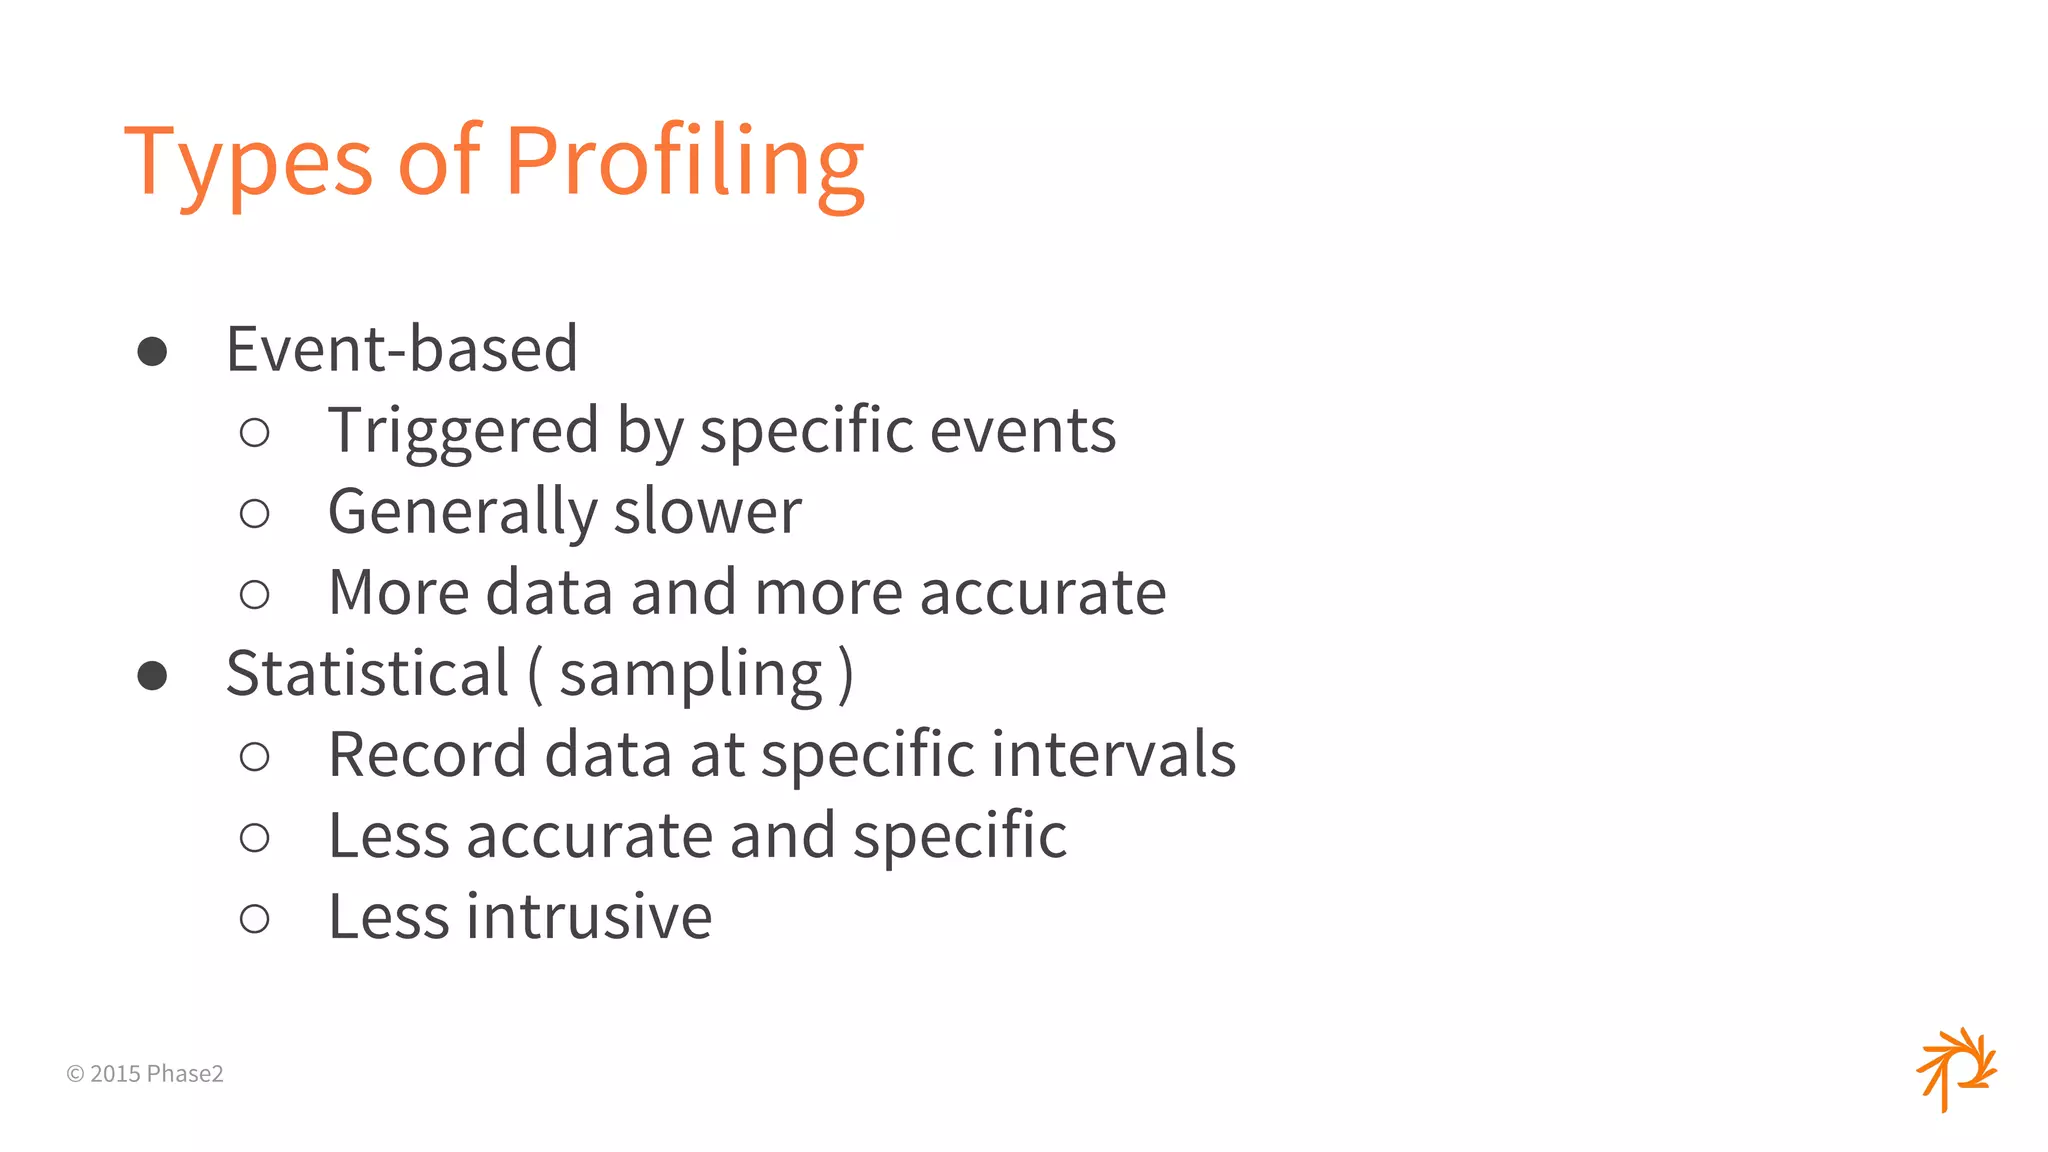
The document discusses profiling tools and techniques for optimizing performance. It begins with an introduction to profiling and defines it as gathering data on a system's performance metrics like CPU and memory usage to find where time is being spent. It then covers types of profiling like event-based and statistical profiling. The rest of the document provides tips on profiling different languages and frameworks like PHP, Ruby, and Node.js. It also discusses tools like XHProf, XDebug, flamegraphs, and EXPLAIN queries to help optimize databases.


![[ CNCF Q1 2024 ] Intro to Continuous Profiling and Grafana Pyroscope.pdf](https://cdn.slidesharecdn.com/ss_thumbnails/cncfq12024introtocontinuousprofilingandgrafanapyroscope-240407162420-9c15afb7-thumbnail.jpg?width=640&height=640&fit=bounds)