Download as PDF, PPTX
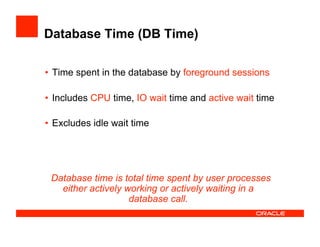
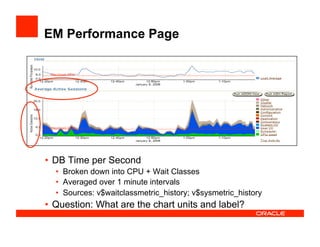

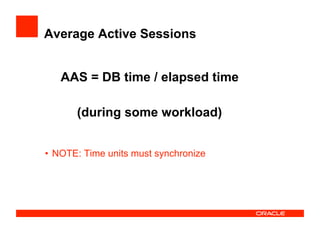
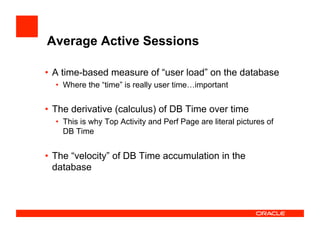
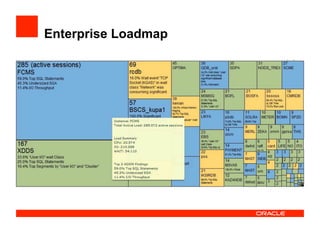
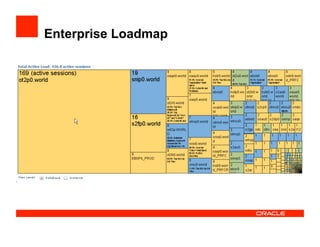
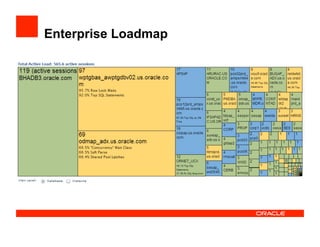
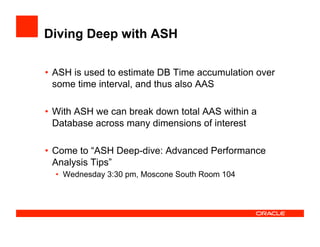
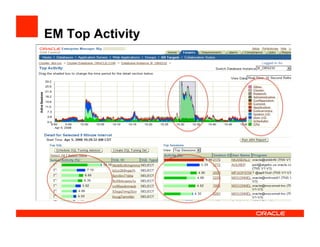
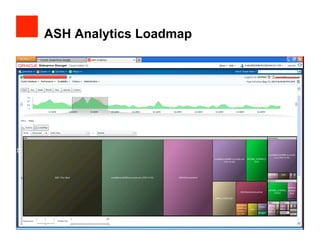
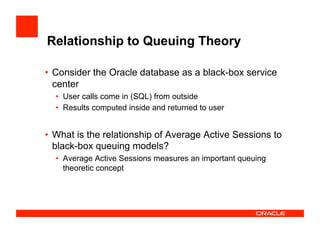
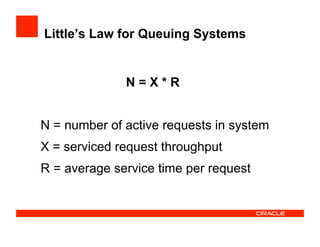
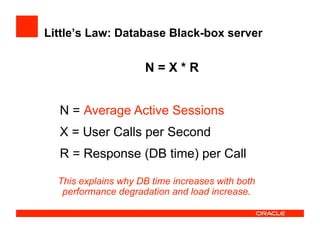
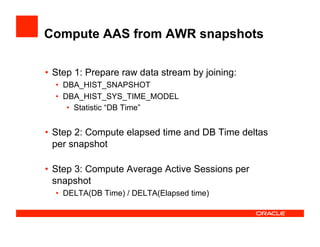
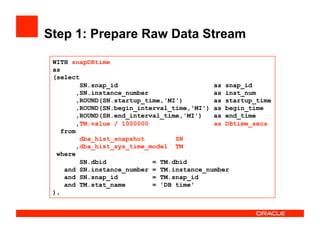
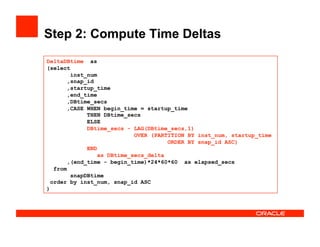
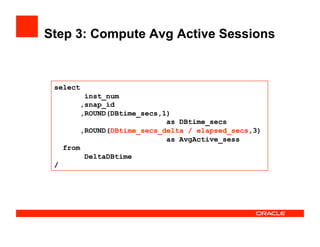


The document discusses monitoring database performance through average active sessions (AAS) and database time (DB time), emphasizing their relationship to user load and performance degradation. It explains the computation of AAS from AWR snapshots, detailing steps to prepare data and calculate relevant metrics for effective performance analysis. The presentation also touches on the connection between AAS and queuing theory, illustrating how performance metrics can be normalized for comparison across different databases and time periods.


![5G Explained! A High Level Overview [Introduction]](https://cdn.slidesharecdn.com/ss_thumbnails/5gexplainedahighleveloverview-260119165306-cc137a3e-thumbnail.jpg?width=640&height=640&fit=bounds)


