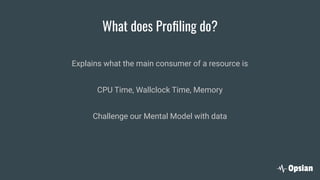
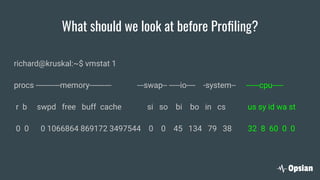
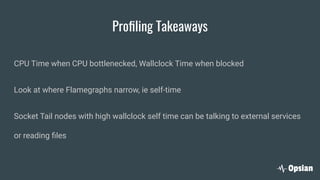
Fantastic Performance and Where
to Find It
Richard Warburton (@richardwarburto)
https://www.opsian.com
Where to Find It?
Profiling Examples
Profiling in the Real World
Conclusion
Fantastic Performance - what’s that?
Where to Find It?
Profiling Examples
Profiling in the Real World
Conclusion
What does Profiling do?
Explains what the main consumer of a resource is
CPU Time, Wallclock Time, Memory
Challenge our Mental Model with data
richard@kruskal:~$ vmstat 1
procs -----------memory---------- ---swap-- -----io---- -system-- ------cpu-----
r b swpd free buff cache si so bi bo in cs us sy id wa st
0 0 0 1066864 869172 3497544 0 0 45 134 79 38 32 8 60 0 0
What should we look at before Profiling?
https://github.com/Opsian/
PerformanceProblemsExample
Example #1 - CPU Bottleneck
Example #2 - Blocking Bottlenecks
Demo
Application
Legacy Bank
Service
Where to Find It?
Profiling Examples
Profiling in the Real World
Conclusion
Problem #1 - Being Representative
vs
Problem #1 - Being Representative
vs
Problem #1 - Being Representative
Solution #1 - Measure in Production
Real Systems, Data and Workload
Requires Low Overhead Profilers
Low Overhead Ad-Hoc Production Profilers
● Async-profiler
● Honest profiler
● Perf + perf-mapper-agent
● Flight Recorder
● Solaris Studio
Problem #2 - Intermittent Issues
Triggered by Bursts
Rare Issues - Weekly/Monthly/Annual
Timing Issues
Solution #2 - Continuous Profiling
Always Profile
Retain Historical Data
Enables comparison
Problem #3 - Infrequently Used Code
Traditional Profiling requires benchmark code to dominate the workload.
Production systems can have infrequent bottlenecks in valuable code
Eg: Customer Signups
Solution #3 - Querying Profiling Data
Query / Slice / Dice
Filtering Profiles by Method or Thread
Continuous Profiling gives you enough data points
Problem #4 & #5 - Access & Scale
Solution #4 & #5 - Decouple Profiling from Visualisation
Aggregation
service
Web Reports
JVM Agents
Where to Find It?
Profiling Examples
Profiling in the Real World
Conclusion
Profiling Thanks
Brendan Greg for Flamegraphs
Andre Pangin for Async-Profiler
Jeremy Manson for the original Lightweight Profiler
Johannes Rudolph for Java Perf Mapper Agent
Nitsan Wakart
The Solaris Studio and Mission Control Teams
Technical and Business Benefits
● Responsiveness & Reliability - Happier Users
● Cheaper Infrastructure - Happier Accountants
● Scalability - Happier VCs or Senior Management
Profiling Takeaways
CPU Time when CPU bottlenecked, Wallclock Time when blocked
Look at where Flamegraphs narrow, ie self-time
Socket Tail nodes with high wallclock self time can be talking to external services
or reading files
Data Driven Optimisation of Dominant
Consumer
Any Questions?
https://www.opsian.com/
"It's like a magnifying glass for our servers"
The End

Fantastic performance and where to find it

  • 1.
    Fantastic Performance andWhere to Find It Richard Warburton (@richardwarburto) https://www.opsian.com
  • 2.
    Where to FindIt? Profiling Examples Profiling in the Real World Conclusion
  • 3.
  • 6.
    Where to FindIt? Profiling Examples Profiling in the Real World Conclusion
  • 7.
    What does Profilingdo? Explains what the main consumer of a resource is CPU Time, Wallclock Time, Memory Challenge our Mental Model with data
  • 8.
    richard@kruskal:~$ vmstat 1 procs-----------memory---------- ---swap-- -----io---- -system-- ------cpu----- r b swpd free buff cache si so bi bo in cs us sy id wa st 0 0 0 1066864 869172 3497544 0 0 45 134 79 38 32 8 60 0 0 What should we look at before Profiling?
  • 9.
  • 10.
    Example #1 -CPU Bottleneck
  • 11.
    Example #2 -Blocking Bottlenecks
  • 12.
  • 13.
    Where to FindIt? Profiling Examples Profiling in the Real World Conclusion
  • 14.
    Problem #1 -Being Representative vs
  • 15.
    Problem #1 -Being Representative vs
  • 16.
    Problem #1 -Being Representative
  • 17.
    Solution #1 -Measure in Production Real Systems, Data and Workload Requires Low Overhead Profilers
  • 18.
    Low Overhead Ad-HocProduction Profilers ● Async-profiler ● Honest profiler ● Perf + perf-mapper-agent ● Flight Recorder ● Solaris Studio
  • 19.
    Problem #2 -Intermittent Issues Triggered by Bursts Rare Issues - Weekly/Monthly/Annual Timing Issues
  • 20.
    Solution #2 -Continuous Profiling Always Profile Retain Historical Data Enables comparison
  • 21.
    Problem #3 -Infrequently Used Code Traditional Profiling requires benchmark code to dominate the workload. Production systems can have infrequent bottlenecks in valuable code Eg: Customer Signups
  • 22.
    Solution #3 -Querying Profiling Data Query / Slice / Dice Filtering Profiles by Method or Thread Continuous Profiling gives you enough data points
  • 23.
    Problem #4 &#5 - Access & Scale
  • 24.
    Solution #4 &#5 - Decouple Profiling from Visualisation Aggregation service Web Reports JVM Agents
  • 25.
    Where to FindIt? Profiling Examples Profiling in the Real World Conclusion
  • 26.
    Profiling Thanks Brendan Gregfor Flamegraphs Andre Pangin for Async-Profiler Jeremy Manson for the original Lightweight Profiler Johannes Rudolph for Java Perf Mapper Agent Nitsan Wakart The Solaris Studio and Mission Control Teams
  • 27.
    Technical and BusinessBenefits ● Responsiveness & Reliability - Happier Users ● Cheaper Infrastructure - Happier Accountants ● Scalability - Happier VCs or Senior Management
  • 28.
    Profiling Takeaways CPU Timewhen CPU bottlenecked, Wallclock Time when blocked Look at where Flamegraphs narrow, ie self-time Socket Tail nodes with high wallclock self time can be talking to external services or reading files
  • 29.
    Data Driven Optimisationof Dominant Consumer
  • 31.
    Any Questions? https://www.opsian.com/ "It's likea magnifying glass for our servers"
  • 32.