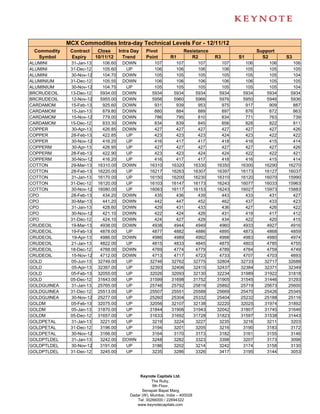
2. MCX Commodities Intra-day Technical Levels For - 12/11/12
Commodity Contract Close Intra Day Pivot Resistance Support
Symbol Expiry 10/11/12 Trend Point R1 R2 R3 S1 S2 S3
KAPAS 30-Mar-13 940.70 UP 940 943 946 952 937 934 928
KAPAS 30-Apr-13 964.60 UP 964 968 971 978 961 957 950
KAPASKHALI 30-Mar-13 1509.00 UP 1509 1512 1514 1520 1506 1503 1498
KAPASKHALI 28-Feb-13 1492.00 DOWN 1493 1499 1505 1517 1487 1481 1469
KAPASKHALI 31-Jan-13 1471.00 DOWN 1473 1478 1485 1497 1466 1461 1449
KAPASKHALI 31-Dec-12 1463.50 DOWN 1465 1470 1477 1489 1458 1453 1441
LEAD 31-Jan-13 118.45 UP 118 119 119 119 118 118 118
LEAD 31-Dec-12 118.40 DOWN 118 119 119 119 118 118 118
LEAD 30-Nov-12 118.70 DOWN 119 119 119 119 119 118 118
LEADMINI 28-Feb-13 118.45 UP 118 119 119 119 118 118 118
LEADMINI 31-Jan-13 118.45 UP 118 119 119 119 118 118 118
LEADMINI 31-Dec-12 118.45 DOWN 118 119 119 119 118 118 118
LEADMINI 30-Nov-12 118.70 UP 119 119 119 120 118 118 118
MENTHAOIL 31-Jan-13 1223.00 UP 1218 1231 1240 1261 1209 1196 1174
MENTHAOIL 28-Feb-13 1225.40 UP 1220 1234 1243 1266 1211 1197 1174
MENTHAOIL 31-Dec-12 1211.30 UP 1206 1221 1231 1255 1196 1181 1157
MENTHAOIL 30-Nov-12 1197.20 UP 1192 1207 1216 1240 1183 1168 1144
NATURALGAS 28-Jan-13 202.70 UP 202 203 204 205 202 201 200
NATURALGAS 26-Dec-12 200.70 DOWN 201 201 201 202 201 200 200
NATURALGAS 27-Nov-12 192.30 UP 192 193 193 194 192 191 191
NICKEL 28-Feb-13 906.20 UP 906 907 909 911 905 903 900
NICKEL 31-Jan-13 896.80 UP 897 898 899 901 896 895 893
NICKEL 31-Dec-12 886.20 UP 886 887 888 890 885 884 883
NICKEL 30-Nov-12 877.10 UP 877 878 879 881 876 875 873
NICKELM 28-Feb-13 906.20 DOWN 906 907 908 910 905 904 903
NICKELM 31-Jan-13 896.80 UP 897 898 899 901 896 894 892
NICKELM 31-Dec-12 886.40 DOWN 886 887 888 890 886 885 883
NICKELM 30-Nov-12 877.20 UP 877 878 879 881 876 875 873
POTATO 15-Apr-13 693.90 DOWN 694 696 698 701 692 691 687
POTATO 15-May-13 719.30 UP 718 722 724 730 716 713 707
POTATO 15-Mar-13 726.30 DOWN 726 728 729 732 725 723 720
SILVER 04-May-13 64277.00 UP 64252 64325 64373 64494 64204 64131 64010
SILVER 05-Mar-13 62778.00 UP 62743 62835 62892 63041 62686 62594 62445
SILVER 05-Dec-12 60920.00 UP 60885 60985 61050 61215 60820 60720 60555
SILVER1000 30-Nov-12 60799.00 UP 60795 60889 60980 61165 60704 60610 60425
SILVERM 30-Apr-13 64311.00 UP 64278 64354 64398 64518 64234 64158 64038
SILVERM 28-Feb-13 62791.00 UP 62748 62854 62917 63086 62685 62579 62410
SILVERM 30-Nov-12 60934.00 UP 60888 61015 61096 61304 60807 60680 60472
SILVERMIC 30-Apr-13 64303.00 UP 64267 64356 64410 64553 64213 64124 63981
SILVERMIC 28-Feb-13 62793.00 UP 62753 62857 62921 63089 62689 62585 62417
SILVERMIC 30-Nov-12 60936.00 UP 60893 61013 61089 61285 60817 60697 60501
STEELRPR 18-Jan-13 30790.00 DOWN 30813 30917 31043 31273 30687 30583 30353
STEELRPR 20-Dec-12 30610.00 UP 30603 30747 30883 31163 30467 30323 30043
ZINC 31-Jan-13 105.40 DOWN 105 105 106 106 105 105 105
ZINC 31-Dec-12 104.20 DOWN 104 104 105 105 104 104 104
ZINC 30-Nov-12 102.95 DOWN 103 103 103 104 103 103 102
Keynote Capitals Ltd.
The Ruby,
9th Floor,
Senapati Bapat Marg,
Dadar (W), Mumbai, India – 400028
Tel: 30266000 / 22694322
www.keynotecapitals.com
3. MCX Commodities Intra-day Technical Levels For - 12/11/12
Commodity Contract Close Intra Day Pivot Resistance Support
Symbol Expiry 10/11/12 Trend Point R1 R2 R3 S1 S2 S3
ZINCMINI 31-Jan-13 105.30 UP 105 105 105 105 105 105 105
ZINCMINI 31-Dec-12 104.20 DOWN 104 104 105 105 104 104 104
ZINCMINI 30-Nov-12 102.95 DOWN 103 103 103 104 103 103 102
Sanjay Bhatia (AVP – Technical Research), Email Id sanjay@keynotecapitals.net
Pivot Point: Intra- Day Trading Tool. - The key to the use of this tool is the use of Stop Loss
Intra Day Trend: It is valid only till the point where Price trades above Pivot Point. For Eg. “UP” would be valid till Price
remains above Pivot Point. It would become “DOWN” in event Price trades below Pivot Point.
Pivot Point (PP): This is a trigger point for Intra Day Buy / Sell based on the price range of the previous day.
R1: Resistance 1: 1st Resistance level over Pivot Point, R2: Resistance 2: Next Resistance level after R1.
R3: Resistance 3: Next Resistance level after R2.
S1: Support 1: 1st Support level after Pivot Point, S2: Support 2: Next Support level after S1.
S3: Support 3: Next Support level after S2.
Note: As per this tool, the trader should take BUY position just above the Pivot Point and keep the Pivot Point level as stop
loss and the first target would be R1 level (Resistance 1). If R1 is crossed then R2 (Resistance 2) becomes the next target
with the stop loss placed at R1 level. If R2 is crossed then R3 (Resistance 3) becomes the next target with the stop loss
placed at R2 level.
Similarly if price goes below the Pivot Point the trader should take a SELL position and keep the Pivot Point level as the
stop loss and the first target would be S1 level (Support 1). If S1 level is breached then S2 level (Support 2) becomes the
next target with the stop loss placed at S1 level. If S2 level is breached then S3 level (Support 3) becomes the next target
with the stop loss placed at S2 level.
Disclaimer: This document is not for public distribution and has been furnished to you solely for your information and must not be reproduced or
redistributed to any other person. Persons into whose possession this document may come are required to observe these restrictions. This material is
for the personal information of the authorized recipient, and we are not soliciting any action based upon it. This report is not to be construed as an offer
to sell or the solicitation of an offer to buy any security in any jurisdiction where such an offer or solicitation would be illegal. It is for the general
information of clients of Keynote Capitals Ltd. It does not constitute a personal recommendation or take into account the particular investment
objectives, financial situations, or needs of individual clients. We have reviewed the report, and in so far as it includes current or historical information,
it is believed to be reliable though its accuracy or completeness cannot be guaranteed. Neither Keynote Capitals Ltd., nor any person connected with
it, accepts any liability arising from the use of this document. The recipients of this material should rely on their own investigations and take their own
professional advice. Price and value of the investments referred to in this material may go up or down. Past performance is not a guide for future
performance. Certain transactions -including those involving futures, options and other derivatives as well as non-investment grade securities - involve
substantial risk and are not suitable for all investors. Reports based on technical analysis centers on studying charts of a stock’s price movement and
trading volume, as opposed to focusing on a company’s fundamentals and as such, may not match with a report on a company’s fundamentals.
Opinions expressed are our current opinions as of the date appearing on this material only. While we endeavor to update on a reasonable basis the
information discussed in this material, there may be regulatory, compliance, or other reasons that prevent us from doing so. Prospective investors and
others are cautioned that any forward-looking statements are not predictions and may be subject to change without notice. Our proprietary trading and
investment businesses may make investment decisions that are inconsistent with the recommendations expressed herein. We and our affiliates,
officers, directors, and employees world wide may: (a) from time to time, have long or short positions in, and buy or sell the securities thereof, of
company (ies) mentioned herein or (b) be engaged in any other transaction involving such securities and earn brokerage or other compensation or act
as a market maker in the financial instruments of the company (ies) discussed herein or act as advisor or lender / borrower to such company (ies) or
have other potential conflict of interest with respect to any recommendation and related information and opinions. The analyst for this report certifies
that all of the views expressed in this report accurately reflect his or her personal views about the subject company or companies and its or their
securities, and no part of his or her compensation was, is or will be, directly or indirectly related to specific recommendations or views expressed in this
report. No part of this material may be duplicated in any form and/or redistributed without Keynote Capitals Ltd’s., prior written consent.
Keynote Capitals Ltd.
The Ruby,
9th Floor,
Senapati Bapat Marg,
Dadar (W), Mumbai, India – 400028
Tel: 30266000 / 22694322
www.keynotecapitals.com