IndiaNivesh maintains positive stance on this ceramic stock; Hold
•
1 like•191 views

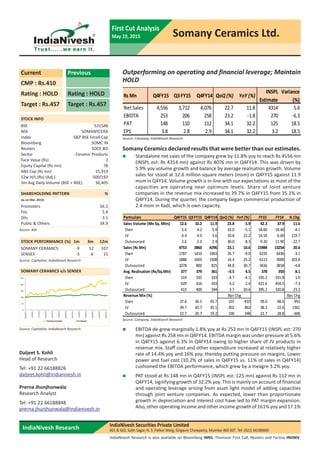
Somany Ceramics Q4FY15: Outperforming on operating and financial leverage, 'Hold' says IndiaNivesh

Recommended
Recommended
More Related Content
What's hot
What's hot (20)
Similar to IndiaNivesh maintains positive stance on this ceramic stock; Hold
Similar to IndiaNivesh maintains positive stance on this ceramic stock; Hold (20)
More from IndiaNotes.com
More from IndiaNotes.com (20)
Recently uploaded
Recently uploaded (20)
IndiaNivesh maintains positive stance on this ceramic stock; Hold
- 1. 0 50 100 150 200 250 May/2014 Jun/2014 Jul/2014 Aug/2014 Sep/2014 Oct/2014 Nov/2014 Dec/2014 Jan/2015 Feb/2015 Mar/2015 Apr/2015 May/2015 Somany Ceramics Sensex IndiaNivesh Research IndiaNivesh Securities Private Limited 601 & 602, Sukh Sagar, N. S. Patkar Marg, Girgaum Chowpatty, Mumbai 400 007. Tel: (022) 66188800 First Cut Analysis May 19, 2015 Somany Ceramics Ltd. IndiaNivesh Research is also available on Bloomberg INNS, Thomson First Call, Reuters and Factiva INDNIV. Daljeet S. Kohli Head of Research Tel: +91 22 66188826 daljeet.kohli@indianivesh.in Prerna Jhunjhunwala Research Analyst Tel: +91 22 66188848 prerna.jhunjhunwala@indianivesh.in CMP : Rs.410 Rating : HOLD Target : Rs.457 Rating : HOLD Target : Rs.457 Current Previous STOCK INFO BSE 531548 NSE SOMANYCERA Index S&P BSE Small Cap Bloomberg SOMC IN Reuters SOCE.BO Sector Ceramic Products Face Value (Rs) 2 Equity Capital (Rs mn) 78 Mkt Cap (Rs mn) 15,919 52w H/L (Rs) (Adj.) 500/193 3m Avg Daily Volume (BSE + NSE) 36,405 SHAREHOLDING PATTERN % (as on Mar. 2015) Promoters 56.2 FIIs 5.8 DIIs 3.1 Public & Others 34.9 Source: BSE STOCK PERFORMANCE (%) 1m 3m 12m SOMANY CERAMICS -9 12 107 SENSEX -3 -6 15 SOMANY CERAMICS v/s SENSEX Source: Capitaline, IndiaNivesh Research Source: Capitaline, IndiaNivesh Research Outperforming on operating and financial leverage; Maintain HOLD Rs Mn Q4FY15 Q3FY15 Q4FY14 QoQ (%) YoY (%) INSPL Estimate Variance (%) Net Sales 4,556 3,712 4,076 22.7 11.8 4314 5.6 EBIDTA 253 206 258 23.2 -1.8 270 -6.3 PAT 148 110 112 34.1 32.2 125 18.5 EPS 3.8 2.8 2.9 34.1 32.2 3.2 18.5 Somany Ceramics declared results that were better than our estimates. Standalone net sales of the company grew by 11.8% yoy to reach Rs 4556 mn (INSPL est: Rs 4314 mn) against Rs 4076 mn in Q4FY14. This was driven by 5.9% yoy volume growth and balance by average realisation growth. Volume sales for stood at 12.6 million square meters (msm) in Q4FY15 against 11.9 msm in Q4Y14. Volume growth is in-line with our expectations as most of the capacities are operating near optimum levels. Share of Joint venture companies in the revenue mix increased to 39.7% in Q4FY15 from 35.1% in Q4FY14. During the quarter, the company began commercial production of 2.4 msm in Kadi, which is own capacity. Source: Company, IndiaNivesh Research Particulars Q4FY15 Q3FY15 Q4FY14 QoQ (%) YoY (%) FY15 FY14 % Chg Sales Volume (Mn Sq. Mtrs) 12.6 10.2 11.9 23.8 5.9 42.3 37.9 11.6 Own 5.6 4.2 5.9 33.0 -5.1 18.60 19.40 -4.1 JV 4.4 4.0 3.6 10.8 22.2 14.50 6.60 119.7 Outsourced 2.6 2.0 2.4 30.0 8.3 9.20 11.90 -22.7 Sales (Rs Mn) 4753 3860 4296 23.1 10.6 15984 13254 20.6 Own 1787 1410 1963 26.7 -9.0 6235 6436 -3.1 JV 1888 1650 1508 14.4 25.2 6113 3000 103.8 Outsourced 1078 800 825 34.8 30.7 3636 3818 -4.8 Avg. Realisation (Rs/Sq.Mtr) 377 379 361 ‐0.5 4.5 378 350 8.1 Own 319 335 333 -4.7 -4.1 335.2 331.8 1.0 JV 429 416 419 3.2 2.4 421.6 454.5 -7.3 Outsourced 415 400 344 3.7 20.6 395.2 320.8 23.2 Revenue Mix (%) Bps Chg Own 37.6 36.5 45.7 107 -810 39.0 48.6 -955 JV 39.7 42.7 35.1 -302 462 38.2 22.6 1561 Outsourced 22.7 20.7 19.2 196 348 22.7 28.8 -606 Bps Chg Source: Company, IndiaNivesh Research EBITDA de-grew marginally 1.8% yoy at Rs 253 mn in Q4FY15 (INSPL est: 270 mn) against Rs 258 mn in Q4FY14. EBITDA margin was under pressure at 5.6% in Q4FY15 against 6.3% in Q4FY14 owing to higher share of JV products in revenue mix. Staff cost and other expenditure increased at relatively higher rate of 14.4% yoy and 16% yoy; thereby putting pressure on margins. Lower power and fuel cost (10.2% of sales in Q4FY15 vs. 11% of sales in Q4FY14) cushioned the EBITDA performance, which grew by a meagre 3.2% yoy. PAT stood at Rs 148 mn in Q4FY15 (INSPL est: 125 mn) against Rs 112 mn in Q4FY14, signifying growth of 32.2% yoy. This is mainly on account of financial and operating leverage arising from asset light model of adding capacities through joint venture companies. As expected, lower than proportionate growth in depreciation and interest cost have led to PAT margin expansion. Also, other operating income and other income growth of 161% yoy and 17.1%
- 2. IndiaNivesh Research Somany Ceramics Ltd.|First Cut Analysis May 19, 2015 | 2 First Cut Analysis (contd...) yoy aided margin expansion. Effective tax rate was lower at 25.8% in Q4FY15 against 39.9% in Q4FY14. Adjusting for higher other income and other income, PAT stood at Rs 94 mn in Q4FY15 against Rs 83 mn in Q4FY14, a growth of 13.9% yoy. For FY15, net sales grew 22% yoy to reach Rs 15313 mn against Rs 12556 mn in FY14. This was led by volume growth of 11.6% and average realisation growth of 8.1%. EBITDA grew 11.6% yoy to reach Rs 865 mn against Rs 775 mn in FY14. EBITDA margin contracted 52 bps yoy to reach 5.7% in FY15 against 6.2% in FY14 led by higher share of lower margin JV sales in revenue mix (38.2% in FY15 against 22.6% in FY14). PAT grew 58.3% yoy to reach Rs 444 mn in FY15 against Rs 280 mn in FY14. PAT margin expanded 66 bps to reach 2.9% in FY15 from 2.2% in FY14. Adjusting for other operating income and other income, adj. PAT stood at Rs 268 mn in FY15 against Rs 212 mn in FY14, growth of 26.6% yoy. PBT margin improved 77 bps yoy against management guidance of 50bps yoy improvement, which is a key positive. The capacity of the company increased to ~52 msm in FY15 from 44.6 msm in FY14. Other developments The company is planning Brownfield capacity expansion of 4 msm at its Haryana plant, which is likely to commence production in FY16E. We would like further clarity on timeline and capex costto incorporate it in our estimates. The company has received notice from sellers of gas (Gail and IOC) worth Rs 241.5 mn in lieu of under drawn gas quantity as part of long term gas supply agreements. The total under drawn quantities of RLNG is equivalent to Rs 609 mn for CY2014. The company is representing the sellers to reduce the amount demanded, which is pending resolution. The management is of the opinion, that it may be able to use the under drawn quantities in future due to additional capacities coming under operation in Kasar. Hence, it has not been provided in financials by the management. In our opinion, Rs 609 mn is a significant amount for the company considering its FY15 PAT of Rs 444 mn. We would view it as a contingent liability till a resolution is finalised, and it would remain an overhang for the stock. Valuation At CMP of Rs 410, the stock trades at PE of 27.4x and 20.6x its FY16E and FY17E earnings of Rs 15 and Rs 19.9 per share respectively. The company has outperformed its guidance of 20% topline growth and 50 bps improvement in PBT margin. It is likely to be one of the beneficiaries of Swachh Bharat Mission of the government, which increases its revenue visibility. Its asset light strategy of investing in joint venture companies is likely to improve the bottomline. We expect the company ROE to improve going forward due to improving profitability. We would revise our estimates, if required, post the conference call with management. Till then, we maintain our positive stance on the company with HOLD rating and target price of Rs 457 (valuing the company at 23x FY17E earnings).
- 3. IndiaNivesh Research Somany Ceramics Ltd.|First Cut Analysis May 19, 2015 | 3 First Cut Analysis (contd...) Financial Performance Rs in mn Q4FY15 Q3 FY15 Q4FY14 QoQ (%) YoY (%) FY15 FY14 Chg (%) Net sales 4,556 3,712 4,076 22.7 11.8 15,313 12,556 22.0 Raw Materials 3,096 2,369 2,726 30.7 13.6 9,853 7,776 26.7 Power and Fuel 463 441 449 5.1 3.2 1,776 1,647 7.8 Staff cost 232 242 203 ‐4.0 14.4 954 823 15.9 Other expenditure 511 455 441 12.4 16.0 1,865 1,535 21.5 Operating Expenses 4,302 3,506 3,818 22.7 12.7 14,448 11,780 22.6 EBITDA 253 206 258 23.2 ‐1.8 865 775 11.6 EBITDA Margin (%) 5.6% 5.5% 6.3% 5.7% 6.2% Other Operating Income 36 37 14 ‐3.8 161.0 97 41 136.7 Other Income 18 25 15 ‐29.4 17.1 78 27 185.8 Depreciation 60 56 56 6.0 6.6 223 221 1.0 Profit bef. Int. & Tax 247 211 231 16.8 7.0 818 623 31.3 Interest & finance ch. 48 41 45 15.5 6.5 163 183 ‐10.9 Profit before tax 199 170 186 17.2 7.2 655 440 48.8 PBT Margin (%) 4.4 4.6 4.6 4.3 3.5 Total tax expenses 52 60 74 ‐14.0 ‐30.6 211 160 32.1 PAT 148 110 112 34.1 32.2 444 280 58.3 Adj. PAT 94 48 83 96.5 13.9 268 212 26.6 Effective tax rate 25.8% 35.2% 39.9% 32.3% 36.3% PAT Margins (%) 3.2% 3.0% 2.7% 2.9% 2.2% EPS- Diluted 3.8 2.8 2.9 34.1 32.2 11.4 7.2 58.3 Source: Company, IndiaNivesh Research
- 4. IndiaNivesh Research Somany Ceramics Ltd.|First Cut Analysis May 19, 2015 | 4 First Cut Analysis (contd...) IndiaNivesh Research is also available on Bloomberg INNS, Thomson First Call, Reuters and Factiva INDNIV. IndiaNivesh Securities Private Limited 601 & 602, Sukh Sagar, N. S. Patkar Marg, Girgaum Chowpatty, Mumbai 400 007. Tel: (022) 66188800 / Fax: (022) 66188899 e-mail: research@indianivesh.in | Website: www.indianivesh.in Disclaimer: This document has been prepared by IndiaNivesh Securities Private Limited (“INSPL”), for use by the recipient as information only and is not for circulation or public distribution. INSPL includes subsidiaries, group and associate companies, promoters, employees and affiliates. INSPL researches, aggregates and faithfully reproduces information available in public domain and other sources, considered to be reliable and makes them available for the recipient, though its accuracy or completeness has not been verified by INSPL independently and cannot be guaranteed. The third party research material included in this document does not represent the views of INSPL and/or its officers, employees and the recipient must exercise independent judgement with regard to such content. This document has been published in accordance with the provisions of Regulation 18 of the Securities and Exchange Board of India (Research Analysts) Regulations, 2014. This document is not to be altered, transmitted, reproduced, copied, redistributed, uploaded or published or made available to others, in any form, in whole or in part, for any purpose without prior written permission from INSPL. This document is solely for information purpose and should not to be construed as an offer to sell or the solicitation of an offer to buy any security. Recipients of this document should be aware that past performance is not necessarily a guide for future performance and price and value of investments can go up or down. The suitability or otherwise of any investments will depend upon the recipients particular circumstances. INSPL does not take responsibility thereof. The research analysts of INSPL have adhered to the code of conduct under Regulation 24 (2) of the Securities and Exchange Board of India (Research Analysts) Regulations, 2014. This document is based on technical and derivative analysis center on studying charts of a stock’s price movement, outstanding positions and trading volume, as opposed to focusing on a company’s fundamentals and, as such, may not match with a report on a company’s fundamentals. Nothing in this document constitutes investment, legal, accounting and/or tax advice or a representation that any investment or strategy is suitable or appropriate to recipients’ specific circumstances. INSPL does not accept any responsibility or whatever nature for the information, assurances, statements and opinion given, made available or expressed herein or for any omission or for any liability arising from the use of this document. Opinions expressed are our current opinions as of the date appearing on this document only. The opinions are subject to change without any notice. INSPL directors/employees and its clients may have holdings in the stocks mentioned in the document. This report is based / focused on fundamentals of the Company and forward-looking statements as such, may not match with a report on a company’s technical analysis report Each of the analysts named below hereby certifies that, with respect to each subject company and its securities for which the analyst is responsible in this report, (1) all of the views expressed in this report accurately reflect his or her personal views about the subject companies and securities, and (2) no part of his or her compensation was, is, or will be, directly or indirectly, related to the specific recommendations or views expressed in this report: Daljeet S Kohli, Amar Maurya, Abhishek Jain, Yogesh Hotwani, Prerna Jhunjhunwala, Kaushal Patel, Rahul Koli, Tushar Manudhane & Dharmesh Kant. Following table contains the disclosure of interest in order to adhere to utmost transparency in the matter: INSPL, its affiliates, directors, its proprietary trading and investment businesses may, from time to time, make investment decisions that are inconsistent with or contradictoryto the recommendations expressed herein. The views contained in this document are those of the analyst, and the company may or may not subscribe to all the views expressed within. This information is subject to change, as per applicable law, without any prior notice. INSPL reserves the right to make modifications and alternations to this statement, as may be required, from time to time. Definitions of ratings BUY. We expect this stock to deliver more than 15% returns over the next 12 months. HOLD. We expect this stock to deliver -15% to +15% returns over the next 12 months. SELL. We expect this stock to deliver <-15% returns over the next 12 months. Our target prices are on a 12-month horizon basis. Other definitions NR = Not Rated. The investment rating and target price, if any, have been arrived at due to certain circumstances not in control of INSPL CS = Coverage Suspended. INSPL has suspended coverage of this company. UR=Under Review. Such e invest review happens when any developments have already occurred or likely to occur in target company & INSPL analyst is waiting for some more information to draw conclusion on rating/target. NA = Not Available or Not Applicable. The information is not available for display or is not applicable. NM = Not Meaningful. The information is not meaningful and is therefore excluded. Research Analyst has not served as an officer, director or employee of Subject Company One year Price history of the daily closing price of the securities covered in this note is available at www.nseindia.com and www.economictimes.indiatimes.com/markets/stocks/stock-quotes. (Choose name of company in the list browse companies and select 1 year in icon YTD in the price chart) Home Disclosure of Interest Statement 1. Details of business activity of IndiaNivesh Securities Private Limited (INSPL) INSPL is a Stock Broker registered with BSE, NSE and MCX - SX in all the major segments viz. Cash, F & O and CDS segments. INSPL is also a Depository Participant and registered with both Depository viz. CDSL and NSDL. Further, INSPL is a Registered Portfolio Manager and is registered with SEBI. 2. Details of Disciplinary History of INSPL No disciplinary action is / was running / initiated against INSPL 3. Details of Associates of INSPL 4. Research analyst or INSPL or its relatives'/associates' financial interest in the subject No (except to the extent of shares held by Research analyst or INSPL or its relatives'/associates') company and nature of such financial interest 5. Research analyst or INSPL or its relatives'/associates' actual/beneficial ownership of 1% or more in securities of the subject company, at the end of the month immediately preceding the date of publication of the document. 6. Research analyst or INSPL or its relatives'/associates' any other material conflict of interest at the time of publication of the document No 7. Has research analyst or INSPL or its associates received any compensation from the subject company in the past 12 months No 8. Has research analyst or INSPL or its associates managed or co-managed public offering of securities for the subject company in the past 12 months No 9. Has research analyst or INSPL or its associates received any compensation for investment banking or merchant banking or brokerage services from the subject company in the past 12 months No 10. Has research analyst or INSPL or its associates received any compensation for products or services other than investment banking or merchant banking or brokerage services from the subject company in the past 12 months No 11. Has research analyst or INSPL or its associates received any compensation or other benefits from the subject company or third party in connection with the document. No 12. Has research analyst served as an officer, director or employee of the subject company No 13. Has research analyst or INSPL engaged in market making activity for the subject company No 14. Other disclosures No Please refer to the important 'Stock Holding Disclosure' report on the IndiaNivesh website (investment Research Section - http://www.indianivesh.in/Admin/Upload/635615016831250000_Stock%20Holding%20Disclosure%20list%20as%20on%20February%2028%202015.pdflink). Also, please refer to the latest update on respective stocks for the disclosure status in respect of those stocks. INSPL and its affiliates may have investment positions in the stocks recommended in this report. Please refer to the important 'Stock Holding Disclosure' report on the IndiaNivesh website (investment Research Section - http://www.indianivesh.in/Admin/Upload/635615016831250000_Stock%20Holding%20Disclosure%20list%20as%20on%20February%2028%202015.pdflink). Also, please refer to the latest update on respective stocks for the disclosure status in respect of those stocks. INSPL and its affiliates may have investment positions in the stocks recommended in this report.