Q4FY15 results: Revenue up 16.73%; Buy for a target of 1950
•
0 likes•274 views

During Q4 FY15, Net profit jumps to Rs. 65.10 million from Rs. 45 million in the corresponding quarter of the previous year, an increase of 44.67%.

Recommended
Recommended
More Related Content
What's hot
What's hot (19)
Viewers also liked
Viewers also liked (18)
Similar to Q4FY15 results: Revenue up 16.73%; Buy for a target of 1950
Similar to Q4FY15 results: Revenue up 16.73%; Buy for a target of 1950 (20)
More from IndiaNotes.com
More from IndiaNotes.com (20)
Recently uploaded
Recently uploaded (20)
Q4FY15 results: Revenue up 16.73%; Buy for a target of 1950
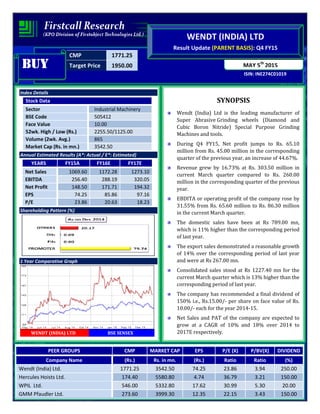
- 1. CMP 1771.25 Target Price 1950.00 ISIN: INE274C01019 MAY 5th 2015 WENDT (INDIA) LTD Result Update (PARENT BASIS): Q4 FY15 BUYBUYBUYBUY Index Details Stock Data Sector Industrial Machinery BSE Code 505412 Face Value 10.00 52wk. High / Low (Rs.) 2255.50/1125.00 Volume (2wk. Avg.) 865 Market Cap (Rs. in mn.) 3542.50 Annual Estimated Results (A*: Actual / E*: Estimated) YEARS FY15A FY16E FY17E Net Sales 1069.60 1172.28 1273.10 EBITDA 256.40 288.19 320.05 Net Profit 148.50 171.71 194.32 EPS 74.25 85.86 97.16 P/E 23.86 20.63 18.23 Shareholding Pattern (%) 1 Year Comparative Graph WENDT (INDIA) LTD BSE SENSEX SYNOPSIS Wendt (India) Ltd is the leading manufacturer of Super Abrasive Grinding wheels (Diamond and Cubic Boron Nitride) Special Purpose Grinding Machines and tools. During Q4 FY15, Net profit jumps to Rs. 65.10 million from Rs. 45.00 million in the corresponding quarter of the previous year, an increase of 44.67%. Revenue grew by 16.73% at Rs. 303.50 million in current March quarter compared to Rs. 260.00 million in the corresponding quarter of the previous year. EBDITA or operating profit of the company rose by 31.55% from Rs. 65.60 million to Rs. 86.30 million in the current March quarter. The domestic sales have been at Rs 789.00 mn, which is 11% higher than the corresponding period of last year. The export sales demonstrated a reasonable growth of 14% over the corresponding period of last year and were at Rs 267.00 mn. Consolidated sales stood at Rs 1227.40 mn for the current March quarter which is 13% higher than the corresponding period of last year. The company has recommended a final dividend of 150% i.e., Rs.15.00/- per share on face value of Rs. 10.00/- each for the year 2014-15. Net Sales and PAT of the company are expected to grow at a CAGR of 10% and 18% over 2014 to 2017E respectively. PEER GROUPS CMP MARKET CAP EPS P/E (X) P/BV(X) DIVIDEND Company Name (Rs.) Rs. in mn. (Rs.) Ratio Ratio (%) Wendt (India) Ltd. 1771.25 3542.50 74.25 23.86 3.94 250.00 Hercules Hoists Ltd. 174.40 5580.80 4.74 36.79 3.21 150.00 WPIL Ltd. 546.00 5332.80 17.62 30.99 5.30 20.00 GMM Pfaudler Ltd. 273.60 3999.30 12.35 22.15 3.43 150.00
- 2. QUARTERLY HIGHLIGHTS (PARENT BASIS) Results updates- Q4 FY15, The company’s net profit jumps to Rs. 65.10 million against Rs. 45.00 million in the corresponding quarter ending of previous year, an increase of 44.67%. The company achieved a turnover of Rs. 303.50 million registering an increase of 16.73% for the 4th quarter of the current year 2014-15 as against Rs. 260.00 million in the corresponding quarter of the previous year. Reported earnings per share of the company stood at Rs. 32.55 a share during the quarter as against Rs. 22.50 over previous year period. Profit before interest, depreciation and tax is Rs. 86.30 million as against Rs. 65.60 million in the corresponding period of the previous year, grew by 31.55%. Break up of Expenditure Break up of Expenditure (Rs. in Million) Q4 FY15 Q4 FY14 % Chng Cost of material consumed 103.60 86.90 19% Purchase of stock in trade 7.80 4.00 95% Employee benefits expenses 42.20 51.90 -19% Depreciation & amortisation expenses 20.00 12.20 64% Other Expenditure 98.30 84.30 17% Months MAR -15 MAR -14 % Change Net Sales 303.50 260.00 16.73 PAT 65.10 45.00 44.67 EPS 32.55 22.50 44.67 EBITDA 86.30 65.60 31.55
- 3. Segment Revenue Latest Updates • The domestic sale has been at Rs 789.00 mn, which is 11% higher than the corresponding period of last year. The major industry segments which attributed to the growth of domestic business wereauto, auto component, engineering, cutting tool, ceramics, glass, refractories etc. • The company has recommended a final dividend of 150% i.e., Rs.15.00/- per share on face value of Rs. 10.00/- each for the year 2014-15. • The export sales demonstrated a reasonable growth with the current year sales at Rs 267.00 million, a growth of 14% over the corresponding period of last year. This was mainly on account of higher exports to countries like UK, USA, UAE,Spain, Belgium, Austria, Australia etc. • Consolidated sales stood at Rs. 1227.40 mn for the current quarter which is 13% higher than the corresponding period of last year.
- 4. COMPANY PROFILE Wendt (India) Ltd (WIL) was incorporated in 1980 as a Joint Venture between Wendt GmbH and The House of Khataus. Murugappa Group Company acquired the Khatau’s stake in the business has been a 40 - 40 Joint Venture between Wendt GmbH and CUMI. The public holds the balance 20% equity. Wendt India is ranked among the Top 25 successful Indo-German JVs by the Indo-German Chamber of Commerce (IGCC). The company technology leaders in Super Abrasive products - manufactures a wide range of Diamond/CBN Grinding Wheels and Tools. These products are find applications in industries like Automobile, Cutting Tools, Engineering, Bearing, Aerospace, Steel, Defense, Refractory, Ceramic, Glass, Textile etc and also provides high precision and high performance specialized CNC Rotary Surface Grinding Machines, Wheel Profiling and Dressing Machines, Precision Honing Machines, Guide Roll Grinding and Special Purpose Grinding Machines. Companies refurbish Insert Grinding Machines. Wendt India draws its Technological Superiority from Wendt GmbH which is a part of Winterthur Technology Group (WTG) Switzerland and Sound and Ethical Management practices from Murugappa group but when Wendt GmbH-the pioneers in Super abrasive tooling solutions and high precision grinding machines for Insert grinding and Steel industries for over 8 decades, the 100 year Murugappa Group is the market leader in diverse businesses such as Engineering, Abrasives, Finance, General Insurance, Cycles, Sugar, Farm Inputs, Fertilizers, Plantations, Bio-products and Nutraceuticals having 29 companies with manufacturing facilities spread across 13 states in India. The group is among the fastest growing diversified business houses in India. It is known for its diversified and impressive Product Portfolio, Innovation strategy, strong Product Development, Personalized technical services and providing Technology Solutions in Grinding to 750+ direct customers in the domestic market. Company believes in direct sales to its customers who are serviced through highly trained application Oriented sales engineers located in all major Industrial cities across India. Exports constitute over 30% of Wendt India’s total business. Subsidiary companies • Wendt Grinding Technologies Ltd The South East Asian markets, Wendt (India) Ltd has established its 100% owned subsidiary during the year 2005 - Wendt Grinding Technologies Limited., in Thailand. • Wendt Middle East FZE: Extrapolating the success of WGTL, to address Middle East market, the second subsidiary company was established in the year 2008 – Wendt Middle East FZE, Sharjah in UAE.
- 5. FINANCIAL HIGHLIGHT (PARENT BASIS) (A*- Actual, E* -Estimations & Rs. In Millions) Balance Sheet as at March31, 2014 -2017E WENDT (INDIA) LTD FY14A FY15A FY16E FY17E EQUITY AND LIABILITIES Shareholder's Funds Share Capital 20.00 20.00 20.00 20.00 Reserves and Surplus 803.10 879.00 966.90 1044.25 1) Net worth 823.10 899.00 986.90 1064.25 Non Current Liabilities Deferred Tax Liabilities 48.70 53.10 56.82 60.23 Other Long Term Liabilities 4.10 4.30 4.56 4.74 Long Term Provisions 18.30 25.70 31.10 34.83 2) Long term liabilities 71.10 83.10 92.47 99.79 Current Liabilities: Trade Payables 159.60 154.40 151.31 149.80 Other Current Liabilities 47.60 37.90 33.35 30.02 Short Term Provisions 37.10 42.90 46.76 50.03 3) Current Liabilities 244.30 235.20 231.43 229.85 TOTAL EQUITY AND LIABILITIES (1+2+3) 1138.50 1217.30 1310.80 1393.90 Non Current Assets Fixed Assets: Tangible Assets 511.30 520.90 538.61 546.15 Intangible Assets 12.40 14.90 17.28 19.78 Capital work-in-progress 27.30 24.90 23.41 21.77 a) Sub Total - Fixed Assets 551.00 560.70 579.30 587.70 b) Non-Current Investments 43.10 43.10 43.10 43.10 c) Long Term Loans and Advances 21.00 47.20 68.44 85.55 4) Non Current Assets 615.10 651.00 690.84 716.35 Current Assets Current Investments 127.20 143.60 161.41 179.16 Inventories 155.40 164.40 179.20 193.53 Trade receivables 202.10 211.10 224.00 241.80 Cash and Bank Balances 6.00 7.00 7.77 8.47 Short-terms loans & advances 30.80 37.90 44.87 51.60 Other Current Assets 1.90 2.30 2.71 2.99 5) Current Assets 523.40 566.30 619.96 677.55 TOTAL ASSETS (4+5) 1138.50 1217.30 1310.80 1393.90
- 6. Annual Profit & Loss Statement for the period of 2014 to 2017E Value(Rs.in.mn) FY14A FY15A FY16E FY17E Description 12m 12m 12m 12m Net Sales 956.50 1069.60 1172.28 1273.10 Other Income 49.50 66.40 78.35 90.89 Total Income 1006.00 1136.00 1250.63 1363.99 Expenditure -796.00 -879.60 -962.44 -1043.94 Operating Profit 210.00 256.40 288.19 320.05 Interest -0.20 -0.80 0.00 0.00 Gross profit 209.80 255.60 288.19 320.05 Depreciation -45.80 -79.20 -87.12 -94.09 Profit Before Tax 164.00 176.40 201.07 225.96 Tax -45.30 -27.90 -29.36 -31.63 Net Profit 118.70 148.50 171.71 194.32 Equity capital 20.00 20.00 20.00 20.00 Reserves 803.10 879.00 966.90 1044.25 Face value 10.00 10.00 10.00 10.00 EPS 59.35 74.25 85.86 97.16 Quarterly Profit & Loss Statement for the period of 30th Sep, 2014 to 30th June, 2015E Value(Rs.in.mn) 30-Sep-14 31-Dec-14 31-Mar-15 30-Jun-15E Description 3m 3m 3m 3m Net sales 274.00 251.80 303.50 281.04 Other income 28.00 3.90 30.50 6.59 Total Income 302.00 255.70 334.00 287.63 Expenditure -220.20 -215.10 -247.70 -227.92 Operating profit 81.80 40.60 86.30 59.70 Interest 0.00 -0.40 -0.40 -0.30 Gross profit 81.80 40.20 85.90 59.40 Depreciation -19.50 -19.80 -20.00 -23.00 Profit Before Tax 62.30 20.40 65.90 36.40 Tax -16.50 -4.00 -0.80 -3.86 Net Profit 45.80 16.40 65.10 32.55 Equity capital 20.00 20.00 20.00 20.00 Face value 10.00 10.00 10.00 10.00 EPS 22.90 8.20 32.55 16.27
- 7. Ratio Analysis Particulars FY14A FY15A FY16E FY17E EPS (Rs.) 59.35 74.25 85.86 97.16 EBITDA Margin (%) 21.96 23.97 24.58 25.14 PBT Margin (%) 17.15 16.49 17.15 17.75 PAT Margin (%) 12.41 13.88 14.65 15.26 P/E Ratio (x) 29.84 23.86 20.63 18.23 ROE (%) 14.42 16.52 17.40 18.26 ROCE (%) 31.08 37.33 38.03 38.91 EV/EBITDA (x) 16.23 13.23 11.71 10.48 Book Value (Rs.) 411.55 449.50 493.45 532.13 P/BV 4.30 3.94 3.59 3.33 Charts
- 8. OUTLOOK AND CONCLUSION At the current market price of Rs. 1771.25, the stock P/E ratio is at 20.63 x FY16E and 18.23 x FY17E respectively. Earning per share (EPS) of the company for the earnings for FY16E and FY17E is seen at Rs. 85.86 and Rs. 97.16 respectively. Net Sales and PAT of the company are expected to grow at a CAGR of 10% and 18% over 2014 to 2017E respectively. On the basis of EV/EBITDA, the stock trades at 11.71 x for FY16E and 10.48 x for FY17E Price to Book Value of the stock is expected to be at 3.59 x and 3.33 x respectively for FY16E and FY17E. We recommend ‘BUY’ in this particular scrip with a target price of Rs.1950.00 for Medium to Long term investment. INDUSTRY OVERVIEW The Indian Super Abrasive Tooling Market largely remains fragmented in nature and operates in a highly competitive environment often characterized by the presence of few organized players such as the Company and many small time and proprietor-driven organizations with strong focus on regional presence & dominance across the country. Company remains as a major supplier of Super Abrasive Products with its comprehensive range and regarded as Total Grinding & Honing Solution Provider, thus enjoys a preferred supplier status, oftentimes a single-source tier-II supplier for many major customers for a wide spectrum of industry. As a result, Company's growth continues to be dependent mainly on the performance of these customers. A major contribution Company's topline in the coming year is expected to come from sectors such as Automotive, Engineering, Cutting Tools, Refractory, Aerospace, Defence, Steel, Ceramics and Construction. Therefore, The Company's performance will also be in congruence with the performance levels of these industries in the coming year. As always, Company will strive to focus on exploring every new opportunity, which would open up in both Super Abrasive Tools and Machine Tool areas. The company would focus on growth prospects coming out of new Projects and higher demand from existing and new customers. Accordingly, it has been working on various projects and has added some new products to enhance the product basket especially in the Precision Grinding areas. At the same time it is also consciously working on progressively minimizing dependency on few specific industries e.g. Automobile and its related industries. The effect of this endeavor is evident from the fact that Company has developed many new products for precision applications for industries like Aerospace, Turbine, Gears, Defence, Textile, Ceramics, Bearing, Construction, Infrastructure, Healthcare and Paper & Printing.
- 9. Disclaimer: This document is prepared by our research analysts and it does not constitute an offer or solicitation for the purchase or sale of any financial instrument or as an official confirmation of any transaction. The information contained herein is from publicly available data or other sources believed to be reliable but we do not represent that it is accurate or complete and it should not be relied on as such. Firstcall Research or any of its affiliates shall not be in any way responsible for any loss or damage that may arise to any person from any inadvertent error in the information contained in this report. Firstcall Research and/ or its affiliates and/or employees will not be liable for the recipients’ investment decision based on this document.
- 10. Firstcall India Equity Research: Email – info@firstobjectindia.com C.V.S.L.Kameswari Pharma & Diversified U. Janaki Rao Capital Goods B. Anil Kumar Auto, IT & FMCG M. Vinayak Rao Diversified G. Amarender Diversified Firstcall Research Provides Industry Research on all the Sectors and Equity Research on Major Companies forming part of Listed and Unlisted Segments For Further Details Contact: Tel.: 022-2527 2510/2527 6077 / 25276089 Telefax: 022-25276089 040-20000235 /20000233 E-mail: info@firstobjectindia.com www.firstcallresearch.com