

Recommended
More Related Content
Similar to Countries health wealth_2016_v151
Similar to Countries health wealth_2016_v151 (20)
More from Anochi.com.
More from Anochi.com. (20)
Recently uploaded
Recently uploaded (20)
Countries health wealth_2016_v151
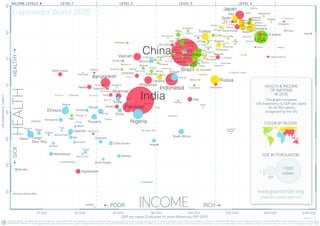
- 1. DATA SOURCES—INCOME: World Bank’s GDP per capita, PPP (2011 international $). Income of Syria & Cuba are Gapminder estimates. X-axis uses log-scale to make a doubling income show same distance on all levels. POPULATION: Data from UN Population Division. LIFE EXPECTANCY: IHME GBD-2015, as of Oct 2016. ANIMATING GRAPH: Go to www.gapminder.org/tools to see how this graph changed historically and compare 500 other indicators. LICENSE: Our charts are freely available under Creative Commons Attribution License. Please copy, share, modify, integrate and even sell them, as long as you mention: ”Based on a free chart from www.gapminder.org”. $1 000 $2 000 $16 000$4 000 $8 000 $32 000 $64 000 $128 000 LEVEL 2LEVEL 1 LEVEL 3 LEVEL 4INCOME LEVELS 5060557065807585 INCOMEPOOR RICH version 15 apminder World 2015 India Japan Indonesia Spain Vietnam Ethiopia Congo Dem. Rep. Czech Rep. South Africa Sudan Tanzania Switzerland Mali Burkina Faso Madagascar Slovak Rep. Uganda Kenya Norway Cameroon Guinea Ghana Zimbabwe Niger Cote d'Ivoire Bosnia & Herz. Senegal Burundi Rwanda Moldova Benin Sierra Leone Chad Lao Papua N. G. Malawi Tajikistan Togo Maced F. Dominican R. Eritrea Nicaragua Liberia Honduras Congo, Rep. Mauritania Oman Trinidad & Tobago Singapore Gabon Palestine Guyana Monten. Luxembourg Gambia Fiji Comoros Equatorial Guinea Kuwait Solomon Isl. Djibouti Kiribati Micronesia Brunei Seychelles Mars. Isl. Andorra United Arab Em. Central African Rep. Somalia Guinea-Bissau Mozambique Afghanistan Lesotho Haiti North Korea Timor-Leste Nepal Bangladesh Kyrgyz Rep. Cambodia Swaziland Pakistan Nigeria USA Saudi Arabia Russia Egypt Philippines Italy France Australia Sweden Ireland Netherlands Germany Austria BelgiumDenm. UK Finl. N. Zeal. South Korea Sloven. Greece Portugal IsraelMalta Cyprus Iceland Algeria Brazil Mexico Argentina Malaysia Azerbaijan Suriname Belarus Costa Rica Maldives South Sudan Zambia Vanuatu Myanmar SyriaSao T & P Uzbekistan Tonga Samoa Bolivia Cape Verde Georgia Guatemala Bhutan Ukraine Belize St.V&G Grenada Morocco Armenia El Salvador Jamaica Paraguay St. Lucia Dominica Ecuador Sri Lanka Albania Tunisia Jordan Colombia Peru Serbia Barbados Lebanon Turkey Thailand Iran Venezuela Bulgaria Libya Mauritius Romania Latvia Lithuania Bahamas Kazakhastan Iraq Namibia Mongolia Uruguay Croatia Panama Cuba Chile Poland Hungary Estonia Antig.& B. Puerto Rico Bahrain Aruba Angola Qatar Turkmenistan Canada Bermuda Yemen China COLOR BY REGION SIZE BY POPULATION www.gapminder.org 1 10 100 1 000 million This graph compares Life Expectancy & GDP per capita for all 182 nations recognized by the UN. a free fact-based worldview HEALTH & INCOME OF NATIONS IN 2015 HEALTHSICKHEALTHY Lifeexpectancy(years) GDP per capita ($ adjusted for price differences, PPP 2011)