![CHE 3323_Mass Transfer_Lab04_Determination of Column Efficiency Page 2 of 11
Determine the Overall Column Efficiency on a Continuous Plate
Distillation Column operation at total reflux
1. Objective:
To calculate the number of theoretical plates for the given separation at total reflux
2. Theory: Formula: FENSKE’s Method
OR
𝐿𝑜𝑔 [(
𝑋𝐴
𝑋𝐵
) 𝑖𝑛 𝑡𝑜𝑝 𝑝𝑟𝑜𝑑𝑢𝑐𝑡 . (
𝑋𝐵
𝑋𝐴
) 𝑖𝑛 𝑏𝑜𝑡𝑡𝑜𝑚𝑠 𝑝𝑟𝑜𝑑𝑢𝑐𝑡 ]
𝑛 + 1 = ________________________________________________________
Log
α
av
Where Nmin = Minimum number of theoretical plates
XD = mole fraction of morevolatile component in the distillate (Top Product)
XB = mole fraction of the more volatile componentin the Bottom product.
α
AB =average relative volatility
Subscripts DBindicate the distillate and bottoms respectively
α
av = √ 𝛼𝐷. 𝛼𝐵
The efficiency is given by
𝐸 =
𝑁𝑢𝑚𝑏𝑒𝑟 𝑜𝑓 𝑇ℎ𝑒𝑜𝑟𝑒𝑡𝑖𝑐𝑎𝑙 𝑝𝑙𝑎𝑡𝑒𝑠
𝑁𝑢𝑚𝑏𝑒𝑟 𝑜𝑓 𝐴𝑐𝑡𝑢𝑎𝑙 𝑝𝑙𝑎𝑡𝑒𝑠
𝑥 100
AB
DB
BD
min
ln
)x(x
)x(x
ln
N
1
1](data:image/gif;base64,R0lGODlhAQABAIAAAAAAAP///yH5BAEAAAAALAAAAAABAAEAAAIBRAA7)
Recommended
Recommended
More Related Content
What's hot
What's hot (20)
Similar to Determining Column Efficiency
Similar to Determining Column Efficiency (20)
Recently uploaded
Recently uploaded (20)
Determining Column Efficiency
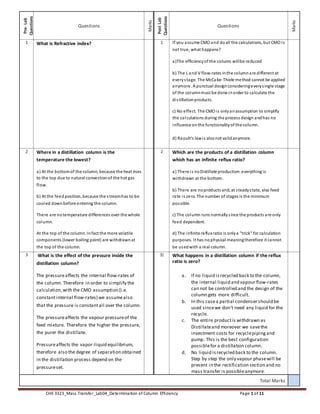
- 1. CHE 3323_Mass Transfer_Lab04_Determination of Column Efficiency Page 1 of 11 Pre-Lab Questions Questions Marks PostLab Questions Questions Marks 1 What is Refractive index? 1 If you assume CMO and doall the calculations, but CMO is not true, what happens? a)The efficiencyof the column willbe reduced b) The L and V flow-rates inthe columnare different at everystage. The McCabe-Thiele method cannot be applied anymore. A punctual designconsideringeverysingle stage of the columnmust be done inorder to calculate the distillationproducts. c) No effect. The CMO is onlyanassumption to simplify the calculations during the process design andhas no influence onthe functionalityof the column. d) Raoult's lawis alsonot validanymore. 2 Where in a distillation column is the temperature the lowest? a) At the bottomof the column, because the heat rises to the top due to natural convectionof the hot gas flow. b) At the feedposition,because the streamhas to be cooled downbefore entering the column. There are notemperature differences over the whole column. At the top of the column. Infact the more volatile components (lower boiling point) are withdrawnat the top of the column. 2 Which are the products of a distillation column which has an infinite reflux ratio? a) There is noDistillate production:everything is withdrawn at the bottom. b) There are noproducts and, at steadystate, also feed rate is zero. The number of stages is the minimum possible. c) The column runs normallysince the products are only feed dependent. d) The infinite reflux ratio is onlya "trick" for calculation purposes. It has nophysical meaningtherefore it cannot be usedwith a real column. 3 What is the effect of the pressure inside the distillation column? The pressureaffects the internal flow-rates of the column. Therefore in order to simplify the calculation,with the CMO assumption (i.e. constantinternal flow-rates) we assumealso that the pressure is constantall over the column. The pressureaffects the vapour pressureof the feed mixture. Therefore the higher the pressure, the purer the distillate. Pressureaffects the vapor-liquid equilibrium, therefore also the degree of separation obtained in the distillation process depend on the pressureset. No effect. Only the temperature is the parameter to consider in a distillation process. 3) What happens in a distillation column if the reflux ratio is zero? a. If no liquid isrecycled back to the column, the internal liquid and vapour flow-rates can not be controlled and the design of the column gets more difficult. b. In this casea partial condenser should be used sincewe don't need any liquid for the recycle. c. The entire productis withdrawn as Distillateand moreover we savethe investment costs for recyclepipingand pump. This is the best configuration possiblefor a distillation column. d. No liquid isrecycled back to the column. Step by step the only vapour phasewill be present in the rectification section and no mass transfer is possibleanymore. Total Marks
- 2. CHE 3323_Mass Transfer_Lab04_Determination of Column Efficiency Page 2 of 11 Determine the Overall Column Efficiency on a Continuous Plate Distillation Column operation at total reflux 1. Objective: To calculate the number of theoretical plates for the given separation at total reflux 2. Theory: Formula: FENSKE’s Method OR 𝐿𝑜𝑔 [( 𝑋𝐴 𝑋𝐵 ) 𝑖𝑛 𝑡𝑜𝑝 𝑝𝑟𝑜𝑑𝑢𝑐𝑡 . ( 𝑋𝐵 𝑋𝐴 ) 𝑖𝑛 𝑏𝑜𝑡𝑡𝑜𝑚𝑠 𝑝𝑟𝑜𝑑𝑢𝑐𝑡 ] 𝑛 + 1 = ________________________________________________________ Log α av Where Nmin = Minimum number of theoretical plates XD = mole fraction of morevolatile component in the distillate (Top Product) XB = mole fraction of the more volatile componentin the Bottom product. α AB =average relative volatility Subscripts DBindicate the distillate and bottoms respectively α av = √ 𝛼𝐷. 𝛼𝐵 The efficiency is given by 𝐸 = 𝑁𝑢𝑚𝑏𝑒𝑟 𝑜𝑓 𝑇ℎ𝑒𝑜𝑟𝑒𝑡𝑖𝑐𝑎𝑙 𝑝𝑙𝑎𝑡𝑒𝑠 𝑁𝑢𝑚𝑏𝑒𝑟 𝑜𝑓 𝐴𝑐𝑡𝑢𝑎𝑙 𝑝𝑙𝑎𝑡𝑒𝑠 𝑥 100 AB DB BD min ln )x(x )x(x ln N 1 1
- 3. CHE 3323_Mass Transfer_Lab04_Determination of Column Efficiency Page 3 of 11 waterofMW waterofMass MethanolofMW MethanolofMass MethanolofMW MethanolofMass FractionMole Methanol = CH3OH Water = H2O 3. Equipment: 1. ContinuousPlate DistillationColumn (youneedasketchforthis) 2. 250 ml measuring cylinder 3. Stop watch 4. Refractometer. See the attachednotesforequipmentdetailsandoperation waterofMassMethanolofMass ofMethanolMass FractionMass
- 4. CHE 3323_Mass Transfer_Lab04_Determination of Column Efficiency Page 4 of 11 ATAGO ABBE Recfractometer - DR-A1 Eye piece Display View finder Sample compartment What is "refractometer"? When a chopstick is dipped in water in a glass, it looks bent. If the chopstick is dipped in thick sugar water, it looks bent much more. This phenomenon arises from "refraction of light beam". Applying this principle (with increase of solution in concentration, the refractive index becomes high in proportion to it) to practical use, Dr. Ernst Abbe (German) first devised the refractometer at the beginning of the 20th century. What is "refractive index The refractive index n of an optical medium is defined as the ratio of the speed of light in vacuum, c = 299792458 m/s, and the phase velocity v of light in the medium, [1] 𝑛 = 𝑐/𝑣
- 5. CHE 3323_Mass Transfer_Lab04_Determination of Column Efficiency Page 5 of 11 4. Safety: Studentsmustweargoggles,laboratorycoatsandhandgloves duringpractical classes. 5-a. Procedure (Refractometer): 1) Switch on the refractometer 2) Open the lid of the sample compartment, clean the quartz surface with fibreless tissue socked in acetone. Leave it to dry 3) Add a few drops of pure known component over the Quartz surface.(never use glass dropping pipettes!) 4) Adjust the view finder to match the boundary line appearing in the refraction field of vision with the intersection point of the cross line. 5) As this knob is turned, the refractive index (nD) appearing in the display continuously changes and the measurement value is displayed when the boundary line and the intersection point of the cross line match with each other. 6) Record the nD of the pure component and refer it with nD of standard component. 7) Open the lid, clean the surface with fibreless clean tissue soaked in acetone. Leave it to dry 8) Add a few drops of the sample to be tested over the quartz surface, adjust the view finder to match, record the refractive index (nD) of the sample. 9) Open the lid, wipe the surface with fibreless tissue followed by acetone socked tissue. 10) Close the lid switch off the power.
- 6. CHE 3323_Mass Transfer_Lab04_Determination of Column Efficiency Page 6 of 11 5-b. Procedure: a) Make calibration curve of Methanol/water mixture at different composition. b) Plot the Calibration Curve for Methanol – Water Mixture c) The equipment will be set up to operate at total reflux so the charge of feed mixture can be loaded directly into the re boiler through the filler cap provided without first charging the feed tank. At total reflux there will be no feed or top product or bottom product. d) Make up 10 liters of mixture of 50 mole percent Methanol and 50 mol percent water. e) Prepare a calibration graph for ethanol water mixture for reference using refractometer f) Note: Three way distillate receiver (C1) can be used to take the boil up rates. While total reflex not in operation, the condensate will be collected in top product receiver. g) Fill the boiler with 10 liter Methanol/Water mixture. h) Set the heater controller high at first and then reduce heat as reflux is introduced to give steady bubbling on all trays and total reflux. i) Leave the apparatus for 30 minutes so that the systemcan reach equilibrium condition. j) Using valve C1, record three different boil up rates and take the average. k) Take the sample of the overhead through valve C1 and record the refractive index l) Record the temperature T5 and T6 to calculate the average column temperature m) Repeat this procedure for several different boil up rates to cover the operating range of the column. n) The calibration graph can be used to determine the concentrations of the components
- 7. CHE 3323_Mass Transfer_Lab04_Determination of Column Efficiency Page 7 of 11 6. Readings and Calculations: Temperature Location Temperature ° C Top Tray Temperature T1 BottomTray Temperature T8 Select the heating value in the Reboiler: Heat input KW Boil up rate Liters / hour Bottom Tray Temperature °C @ T8 Top tray Temperature °C @ T1 Overhead composition RI Bottom composition R2 0.65 0.75 0.85 0.95 0.105
- 8. CHE 3323_Mass Transfer_Lab04_Determination of Column Efficiency Page 8 of 11 Composition of Methanol in Water by Mole fraction Volume Of Methanol(g) Volume Of Water(g) Total Volume(g) Refractive Index 0 30.0019 30.0019 1.334 4.9612 25.1371 30.0983 1.3379 10.4179 20.0961 30.514 1.3419 14.9032 15.1198 30.023 1.3433 19.9421 10.0031 29.9452 1.3418 25.0047 5.0154 30.0201 1.3317 26.1635 4.1856 30.3491 1.3358 27.227 2.776 30.003 1.3348 28.226 2.1671 30.3931 1.3341 29.1643 1.1125 30.2768 1.3331 30.1018 0 30.1018 1.3296 Mole fraction of Methanol in water 32 18 Mass of methanol molesof methanol Mass of water Molesof water total molesof waterand methanol Methanol Mole fraction nD 0 0 30.0019 1.666772222 1.666772222 0 1.334 4.9612 0.1550375 25.1371 1.396505556 1.551543056 0.099924717 1.3379 10.4179 0.325559375 20.0961 1.11645 1.442009375 0.225767863 1.3419 14.9032 0.465725 15.1198 0.839988889 1.305713889 0.356682275 1.3433 19.9421 0.623190625 10.0031 0.555727778 1.178918403 0.528612178 1.3418 25.0047 0.781396875 5.0154 0.278633333 1.178918403 0.662808277 1.3382 26.1635 0.817609375 4.1856 0.232533333 1.050142708 0.778569778 1.3358 27.227 0.85084375 2.776 0.154222222 1.005065972 0.848758398 1.3348 28.226 0.8820625 2.1671 0.120394444 1.002456944 0.879900633 1.3341 29.1643 0.911384375 1.1125 0.061805556 0.973189931 0.906362132 1.3331 30 0.9375 0 0 0.9375 1 1.3296
- 9. CHE 3323_Mass Transfer_Lab04_Determination of Column Efficiency Page 9 of 11 a) Using the formulae given in page3, calculate the number of theoretical plates b) Column efficiency 1.328 1.33 1.332 1.334 1.336 1.338 1.34 1.342 1.344 0 0.2 0.4 0.6 0.8 1 1.2 Refractive Index Methaol Mole Fraction Mole Fraction of Methanol in Water
- 10. CHE 3323_Mass Transfer_Lab04_Determination of Column Efficiency Page 10 of 11 Lab report Format and Marking Scheme 1. Objectives 5 % Purpose of experiment Possible outcomes results of experiment 2. Introduction& Theory 10 % Introduction to the topic and purpose of the experiment Explanation of the relevant theory in detail, including relevant laws, equations or theorems Indication of the methods that will be used for analysis 3. Apparatus and Resources 5% List no. of chemicals , Equipment’s 4. Procedure 10% Write step by step procedure in detail 5. Experimental Data/ Readings 10% Data table Formulas , calculations 6. Results andCalculations 20% Use Formula in lab report to calculate number of theoretical plates Calculate column efficiency 7. Discussions 25% Discuss the results you obtained; 1. Determining the effect of power and temperature in column efficiency 2. What will be effect if number of plates increase or decrease? Compare the expected and experimental results Explain any unexpected results
- 11. CHE 3323_Mass Transfer_Lab04_Determination of Column Efficiency Page 11 of 11 8. Conclusions 10% This section will summarize the key results and discussion points. Indicate to what extent the aims of the experiment were achieved. Summarize the main points of the findings including key values. Summarize important limitations and the cause of unexpected results. Recommend improvements to overcome experimental limitations. 9. References 5%