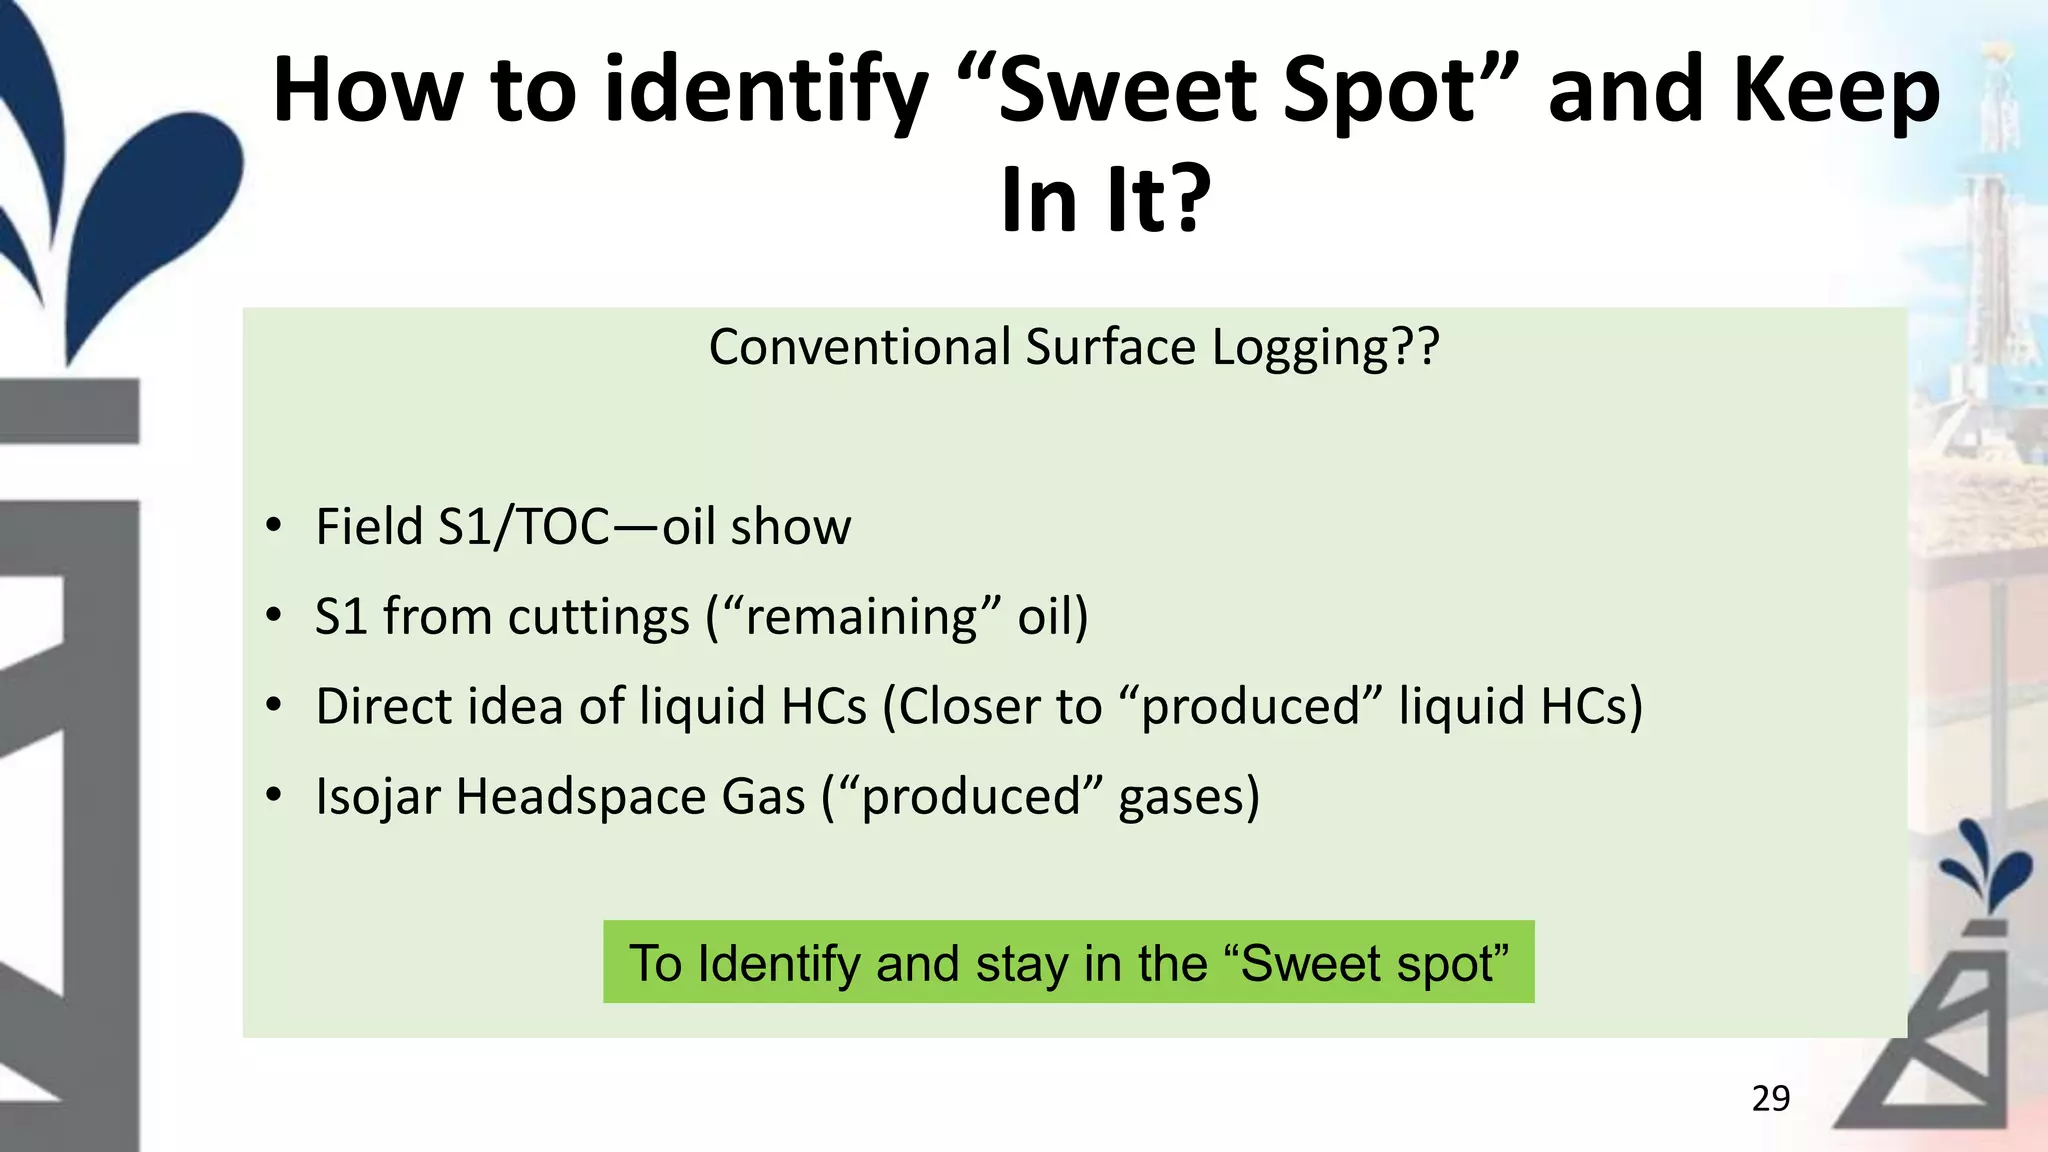
1. PALADIN GEOLOGICAL SERVICES
1
Advanced Techniques to Increase
Returns for Horizontal Wells and
Reservoirs
Tom Arnold, Director of Training @ Paladin Geological Service
GEOGAP Training Service Co-Founder & Director
12. 12
What can be learned from
this new DATA?
…increased analysis of formation evaluation?
13. Average Specific Gravity of
Typical Hydrocarbons
Gas .56 - .66
Condensate Gas .6 - .8
Volatile Oil .77+
Heavy Oil 1
Air=1
What is the importance of Specific Gravity?
Specific gravity is unit-
less and is the density
of the gas divided by
the density of air at 68
deg F. @ 1 atmosphere.
Gas Specific Gravity
Knowing the Specific Gravity of a gas sample
can tell you what type of hydrocarbon created it!
14. Gas Specific Gravity
It provides a possible indicator of the type of hydrocarbon in the reservoir!
Constants: Gas SG
C1 = .55
C2 = .75
C3 = 1.53
C4+= 2
SG = ([ C1/TG ] *.55 ) + ([ C2/TG ] * .75) + ([ C3/TG ] * 1.53) + ([ C4/TG ] * 2)
Nomenclature
SG = Specific Gravity
TG = Total Gas
C1-4 = Component Gas Value
15. Gas Specific Gravity Examples
Example 1
TG = 68
C1 = (60 units / 68) * .55 = .642
C2 = (8 units / 68) * .75 = .086
SG = .728 Dry Gas
•Example 2
TG = 680
C1 = (500 units / 680) * .55 = .404
C2 = (150 units / 680) * .75 = .165
C3 = (25 units / 680 ) * 1.53 = .056
C4 = (5 units / 680 ) * 2 = .015
SG = .640 Gas Condensate
Example 3
TG = 1200
C1 = (650 units / 1200) * .55 = .298
C2 = (200 units / 1200) * .75 = .125
C3 = (175 units / 1200) * 1.53 = .223
C4 = (100 units / 1200 ) * 2 = .167
C5 = (75 units / 1200 ) * 2 = .125
SG = .938 Oil
16. Based on the specific gravity of each of the component gases in the total gas
sample, the gas specific gravity gives a direct indicator of the type of
hydrocarbon that produced it.
Specific Gravity in Cross-Section
Well A
22. Evaluation of Hydrocarbon
Fluorescence for Fluid Type
A simple visual examination
of the fluorescence of
hydrocarbon can yield a
general idea as to the
nature of the oil.
23. Evaluation of Hydrocarbon
Fluorescence for Fluid Type
By measuring the frequency at
which a hydrocarbon sample
produces light under fluorescence,
the type of oil can be readily
determined. Thus quantifying the
visual inspection discussed
previously.
24. Quantitative Fluorescence Testing (QFT)
At the rig UV-fluorescence
technique for detecting and
analyzing extractable whole oil
from drill cuttings.
Users can obtain both oil
quantity and API gravity from
emission measurements at
two wavelengths.
HC Fluorescence – Oil / Gas Shows
25. Advantages
• Provides repeatable results with
greatly improved sensitivity over
visual methods, especially for
light oils and condensates.
•Provides immediately useful
weight percent oil (Wt % Oil)
instead of relative (subjective)
visual or descriptive values of
fluorescence.
• Provides API gravity estimates
that help characterize in-situ
hydrocarbons.
• Provides a direct estimate of oil
in the formation.
HC Fluorescence – Oil / Gas Shows
27. Advanced Geochemistry in Surface
Logging
• Prediction Of Producible Oil Via Real-time Onsite Rock Eval
• Hollow Fiber Micro-extraction To Measure Oil Content (C5+)
• Stage-wise Degassing For Rock Porosity And Permeability
• Real-time Onsite Isotope Analysis (GC-IR2)
28. Field Requirement in Shale Oil/Gas
Systems
GLWD with in-situ, on-site advanced geochemistry!
• There is a significant amount of samples available from the drilling
wells. Normally, these samples will be shipped to laboratory for
advanced chemical and isotopic analysis.
• However, by the time of analysis, a prominent amount of light HCs
are gone forever.
• In addition, drilling cannot wait for laboratory analysis, which
usually requires turning-around time up to months.
28
29. How to identify “Sweet Spot” and Keep
In It?
Conventional Surface Logging??
• Field S1/TOC—oil show
• S1 from cuttings (“remaining” oil)
• Direct idea of liquid HCs (Closer to “produced” liquid HCs)
• Isojar Headspace Gas (“produced” gases)
To Identify and stay in the “Sweet spot”
29
34. (1) Sources of gases
• Biogenic vs. Thermogenic (biological or heat created)
• Shale vs. Coalbed
• Primary vs. Secondary
34
Specific Advantages of Geochemistry
35. (2) Thermal Maturity
• In general, gas
Isotopes increase
with maturation.
• As thermal
indicator, gas
isotopes can tell if
the reservoir is at
the right window
for oil, condensate
and gas
generation.
35
36. “Sweet Spot” can be predicted by:
• Secondary Cracking Source (oil-related)
• High Nano porosity and permeability
• Isotope Reversal
(3) “Sweet Spot” prediction
36
37. (4) Primary vs. Secondary
• Gas isotopes help
differentiate the
sources of gases
(primary vs.
secondary).
• Oil-related gas wells
are usually of high
production rates.-50
-40
-30
-20
-10
-55 -45 -35 -25
delta13C3(permil)
delta 13C2 (per mil)
Red: High Production Well
Blue: Low Production Well
Gas from secondary cracking of oil
or condensate
Gas from Kerogen
(adapted from JIP Report , 2013)
37
38. (5) Production Decline Prediction
Two inputs:
Gas production
rates
Real time C1
isotopes for
minimum of 6
months
(Gao et al., in prep, GCA)
38
40. When Everything Works Right….
When the gamma
data is good and
matches the offset,
life is good. The bad
news is that it is often
not the case.
Lay-over correlation
The wellbore
remains near
the center-
line of the
target zone.
41. When Faulting Occurs… It Gets
Interesting!
start
end
major change
resultWithout the aid of software, determining
the throw of the fault would require
careful analysis of the drill cuttings. Even
then, the exact displacement would be in
question. But with good software the
value is known to the foot.
42. Eroded Top: Mississippi Formation
The wellbore entered the top of
the Mississippi as it emerged
from the unconformity, showing
a normal transition between
shale and carbonate. Then after
drilling several hours, the
wellbore entered the eroded
surface indicating shale once
more.
Know your geologic setting and never loose
sight of the BIG PICTURE! Otherwise this could
have been miss-interpreted as a fault.
43. Mississippian Carbonate Signature
What appears to be
noisy gamma, may
indicate fractures and
micro-faults within the
formation.
..many are present but a few are pointed out.
44. Delaware Basin Turbidities
Gamma indicated significant shift in
lithology. Drill cutting confirmed the
same, showing extensive clastic
detritus.
45. The Smaller the Pay Zone, the more
Critical the Fault
fault
compression
fold
4’ fault begins
fault
ends
With small pay zones, a fault of only a few feet can make a big
difference. Couple that with increased dip angles and folding,
makes interpretation while drilling a nightmare. Without good
software to keep the wellbore in zone and either knowledge of
the area or experience to assist, the productivity of the well can
come into doubt.
46. Even without geologic changes, other factors effect the wellbore;
directional drillers, drill motors, anisotropy, other equipment, etc…
These situations lead to porpoising of the wellbore or drilling out the
pay zone . This can mean having difficulty during completion.
Other Factors
porpoising
47. Often times all we have
is the general shape
between the LWD and
offset gamma to work
with.
Since carbonates have such a low gamma signature, how is correlation possible?
Geosteering in a Carbonate
offset
LWD
Other times we have
nothing more than an
educated guess. The
‘educated ‘ part comes
from experience.
48. Bakken
The Final Product
Accurate Geosteering requires being able to
see the ‘Big Picture’. That means the ability to
look beyond the LWD data. When correlations
come into question, consider the lithology and
gas data from the logger. Account for other
information from LWD sensors like resistivity,
azimuthal gamma ray, neutron density and
others if available. When you add in
experience, this is the point where both
science and art merge.
The assimilation and analysis of ALL DATA available
provides the most accurate correlations and are
necessary to assure the successful completion of a
horizontal well.
Successful Horizontal!