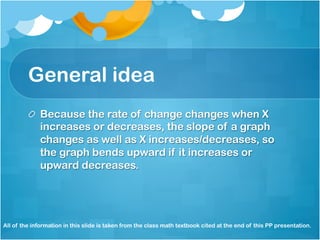
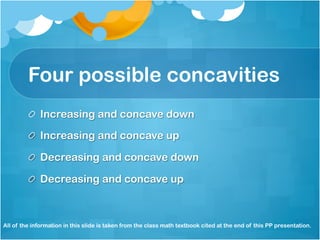
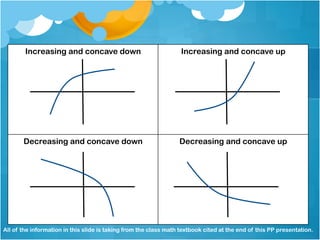
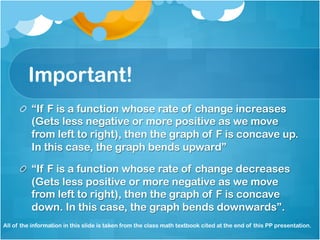
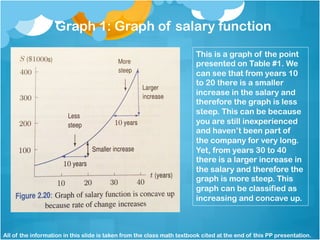
Concavity Lesson 
Prof: Ana Maria Lopez
Lesson purpose 
! Learn about the different concavities of a graph 
and relating it to rate of change. 
! Explore a real life situation
General idea 
! Because the rate of change changes when X 
increases or decreases, the slope of a graph 
changes as well as X increases/decreases, so 
the graph bends upward if it increases or 
upward decreases. 
All of the information in this slide is taken from the class math textbook cited at the end of this PP presentation.
Four possible concavities 
! Increasing and concave down 
! Increasing and concave up 
! Decreasing and concave down 
! Decreasing and concave up 
All of the information in this slide is taken from the class math textbook cited at the end of this PP presentation.
Increasing and concave down Increasing and concave up 
Decreasing and concave down 
Decreasing and concave up 
All of the information in this slide is taking from the class math textbook cited at the end of this PP presentation.
Important! 
! “If F is a function whose rate of change increases 
(Gets less negative or more positive as we move 
from left to right), then the graph of F is concave up. 
In this case, the graph bends upward” 
! “If F is a function whose rate of change decreases 
(Gets less positive or more negative as we move 
from left to right), then the graph of F is concave 
down. In this case, the graph bends downwards”. 
All of the information in this slide is taken from the class math textbook cited at the end of this PP presentation.
Real life example! 
! When you eventually work and get a salary that 
increases, this function would create an 
increasing graph, meaning it would be concave 
up. 
All of the information in this slide is taken from the class math textbook cited at the end of this PP presentation.
Table 1 à Salary: increasing rate of change 
T ( Time) S: Salary ($100s) Rate of change 
0 40 
10 72 
20 128 
30 230 
40 411 
3.2 
5.6 
10.2 
18.1 
All of the information in this slide is taken from the class math textbook cited at the end of this PP presentation.
Graph 1: Graph of salary function 
This is a graph of the point 
presented on Table #1. We 
can see that from years 10 
to 20 there is a smaller 
increase in the salary and 
therefore the graph is less 
steep. This can be because 
you are still inexperienced 
and haven’t been part of 
the company for very long. 
Yet, from years 30 to 40 
there is a larger increase in 
the salary and therefore the 
graph is more steep. This 
graph can be classified as 
increasing and concave up. 
All of the information in this slide is taken from the class math textbook cited at the end of this PP presentation.
Sources 
! Hughes-Hallett, Deborah, Andrew M. Gleason, 
and Et. Al. "Ch 2.5: Concavity." Functions 
Modeling Change: A Preparation for Calculus. By 
Eric Connally. 4th ed. N.p.: John Wiley & Sons, 
2011,2006,2003. 93-97. Print.

Concavity lesson Ana Maria Lopez

  • 1.
    Concavity Lesson Prof:Ana Maria Lopez
  • 2.
    Lesson purpose !Learn about the different concavities of a graph and relating it to rate of change. ! Explore a real life situation
  • 3.
    General idea !Because the rate of change changes when X increases or decreases, the slope of a graph changes as well as X increases/decreases, so the graph bends upward if it increases or upward decreases. All of the information in this slide is taken from the class math textbook cited at the end of this PP presentation.
  • 4.
    Four possible concavities ! Increasing and concave down ! Increasing and concave up ! Decreasing and concave down ! Decreasing and concave up All of the information in this slide is taken from the class math textbook cited at the end of this PP presentation.
  • 5.
    Increasing and concavedown Increasing and concave up Decreasing and concave down Decreasing and concave up All of the information in this slide is taking from the class math textbook cited at the end of this PP presentation.
  • 6.
    Important! ! “IfF is a function whose rate of change increases (Gets less negative or more positive as we move from left to right), then the graph of F is concave up. In this case, the graph bends upward” ! “If F is a function whose rate of change decreases (Gets less positive or more negative as we move from left to right), then the graph of F is concave down. In this case, the graph bends downwards”. All of the information in this slide is taken from the class math textbook cited at the end of this PP presentation.
  • 7.
    Real life example! ! When you eventually work and get a salary that increases, this function would create an increasing graph, meaning it would be concave up. All of the information in this slide is taken from the class math textbook cited at the end of this PP presentation.
  • 8.
    Table 1 àSalary: increasing rate of change T ( Time) S: Salary ($100s) Rate of change 0 40 10 72 20 128 30 230 40 411 3.2 5.6 10.2 18.1 All of the information in this slide is taken from the class math textbook cited at the end of this PP presentation.
  • 9.
    Graph 1: Graphof salary function This is a graph of the point presented on Table #1. We can see that from years 10 to 20 there is a smaller increase in the salary and therefore the graph is less steep. This can be because you are still inexperienced and haven’t been part of the company for very long. Yet, from years 30 to 40 there is a larger increase in the salary and therefore the graph is more steep. This graph can be classified as increasing and concave up. All of the information in this slide is taken from the class math textbook cited at the end of this PP presentation.
  • 10.
    Sources ! Hughes-Hallett,Deborah, Andrew M. Gleason, and Et. Al. "Ch 2.5: Concavity." Functions Modeling Change: A Preparation for Calculus. By Eric Connally. 4th ed. N.p.: John Wiley & Sons, 2011,2006,2003. 93-97. Print.