SlideShare a Scribd company logo
1 of 86
U.S. Geological Survey
U.S. Department of Interior
Global croplands for food and water security in the twenty-first century using
Earth Observing (EO) big-data analytics, machine learning, and cloud computing
May 8-10, 2023, New Techniques for Water Management II @
2023 Water for Food Global Conference, Nebraska , USA
Dr. Prasad S.Thenkabail, Dr. Pardhasaradhi G. Teluguntla
(pthenkabail@usgs.gov; pteluguntla@usgs.gov)
Mr. Adam Oliphant, Dr. Itiya Aneece, and Mr. Daniel Foley
United States Geological Survey (USGS)
U.S. Geological Survey
U.S. Department of Interior
Background
https://www.usgs.gov/apps/croplands/app/map (www.croplands.org)
https://lpdaac.usgs.gov/news/release-of-gfsad-30-meter-cropland-extent-products/
https://lpdaac.usgs.gov/news/release-of-lgrip30-data-product/
www.usgs.gov/wgsc/gfsad30
Global Croplands for Food and Water Security in the Twenty-first Century
Importance of Global Croplands for Life and Livelihoods
U.S. Geological Survey
U.S. Department of Interior
Requires
Energy
Availability of
Land
for Food Security
Availability of
Water
for Food Security
Contributes to
Nutritional needs
Needed for
Feeding animals
Adapting to
Climate Change
for Food Security
Global
Croplands
Affects
Economy,
Population,
Peace
Leveraging
Virtual Land &
Water
for Food Security
U.S. Geological Survey
U.S. Department of Interior
Global Croplands for Food and Water Security in the Twenty-first Century
Background: Global Population Dynamics
Source: Data from the History Database of the Global Environment, HYDE V3.2
U.S. Geological Survey
U.S. Department of Interior
1540 Mha
240 Mha
Sources:
Cao et al., 2021, Goldewijk et al., 2010, Ramankutty and Foley,
1999, HYDE 2.0, Houghton et al., 1983, Thenkabail et al., 2015
140 Mha
36 Mha
84 Mha
52 Mha
145 Mha
200 Mha
293 Mha
840 Mha
260 Mha
429 Mha
Global Croplands for Food and Water Security in the Twenty-first Century
Background: Global Cropland Dynamics
1800 Mha in 2020
U.S. Geological Survey
U.S. Department of Interior
Current State-of-Art
https://www.usgs.gov/apps/croplands/app/map (www.croplands.org)
https://lpdaac.usgs.gov/news/release-of-gfsad-30-meter-cropland-extent-products/
https://lpdaac.usgs.gov/news/release-of-lgrip30-data-product/
www.usgs.gov/wgsc/gfsad30
U.S. Geological Survey
U.S. Department of Interior
….typically, in 250m-10 km & as a result precision and accuracies of
croplands location as well as cropland areas are lacking
Global Croplands for Food and Water Security in the Twenty-first Century
Existing Irrigated and Rainfed Cropland Products @ Coarse Resolution
Sno Name
*
Institution
**
Sensors
***
Resolution, Nominal Time, Nominal Classes Reference
(meters) (year)
A. Global cropland products
1 GCEP30 USGS Landsat 7 & 8 30 2021 Croplands Thenkabail et al. (2021)
2 UCL UCDL Multiple 250 2010 Croplands, irrigated, rainfed Waldner et al. (2016)
3 MODIS Cropland SDSU & UMD MODIS 250 2000 Croplands Pitman et al. (2010)
4 GRIPC BU MODIS 500 2005 Croplands, irrigated, rainfed Salmon et al. (2015)
5 GFSADCD1KM USGS AVHRR 1000 2010 Crop dominance, irrigated, rainfed Thenkabail et al. (2012)
6 GFSADCM1KM USGS AVHRR, MODIS, Landsat 1000 2010 Croplands, irrigated, rainfed Teluguntla et al. (2015)
7 GIAM IWMI AVHRR, SPOT VEG 1000-10,000 2000 Croplands, irrigated Thenkabail et al. (2009)
8 GMRCA IWMI AVHRR, SPOT VEG 1000-10,000 2000 Croplands, rainfed Biradar et al. (2009)
9 MIRCA2000 UB 10,000 2000 Croplands. irrigated Portman, Seibert & Doll (2009)
10 SAGE-Crop UW 100,000 2000 Croplands, crop dominance Monfreda, Ramankutty & Foley (2008)
11 SAGE-Agri UW 100,000 2000 Croplands, crop dominance Ramankutty et al.(2008)
B. Global LULC products in which cropland classes exist
12 WorldCover10V2 ESA Sentnel-2 10 2021 LULC Zanaga et al. (2022)
13 WorldCover10V1 ESA Sentnel-2 10 2020 LULC Zanaga et al. (2021), Karra et al. (2021)
14 Globeland30 NGCC Landsat 7 30 2010 LULC Chen et al. (2015)
15 FROM-GLC CAS Landsat 7 30 2000 Croplands Yu et al. (2013)
16 FROMGC CESS Landsat 7 30 Circa 2010 LULC Gong et al. (2013)
17 CGLS-LC100 Copernicus PROBA-V 100 2015 LULC Buchhorn et al.(2020)
18 MODIS-JRC JRC/MARS MODIS, Landsat 250 2009 LULC Vancutsem et al. (2012)
19 Globcover ESA MERIS 300 2005, 2009 LULC Defourny et al. (2009)
20 MCD12Q1 NASA MODIS 500 2004 - now LULC Leroux et al. (2014)
21 GLC BU MODIS 500 LULC Friedal et al. (2010)
22 DISCover USGS AVHRR 1000 1992-93 LULC Loveland et al.(2000)
23 LULC 2000 USGS AVHRR 2000 2000 LULC Soulard et al. (2014)
24 GLC 2000 JRC SPOT 1/112° 2000 LULC Fritz et al. (2010)
Note:
* = GCEP30= Global cropland extent product@30m; UCL = Unified Cropland Layer; GFSADCM1KM= Global Food Security-Support Analysis Data Cropland Mask @ 1-km;
GRIPC= Global Rainfed, Irrigated, and Paddy Croplands;GFSADCD1KM= Global Food Security-Support Analysis Data Crop Dominance @ 1-km;
MIRCA2000= Global monthly irrigated and rainfed crop areas around the year 2000; GIAM- Global Irrigated Area Map; GMRCA= Global Map of Rainfed Cropland Areas;
SAGE= Center for Sustainability and the Global Environment;LULC = land use and land cover: MCD12Q1= MODIS Land Cover Type product;
FROM-GLC = Fine Resolution Observation and Monitoring of Global Land Cover;FROMGC = Finer Resolution Observation and Monitoring of Global Land Cover
CGLS= Copernicus Global Land Cover Layers; MODIS-JRC = MODIS Joint Research center; GLC = Global Land Cover.
** = UCDL = Université Catholique de Louvain, Belgium; USGS = United States Geological Survey; BU = Boston University SDSU = South Dakota State University.
UMD = University of Maryland; UB = University of Bonn; IWMI= International Water Management Institute; UW = University of Wisconsin.
NGCC = National Geomatics Center of China; NASA = National Aeronautics and Space Administration; CAS = Chinese Academy of Sciences.
MARS = Monitoring Agricultural Resources; ESA = The European Space Agency.
*** = AVHRR = Advanced Very High Resolution radiometer; MODIS = Moderate Resolution Imaging Spectroradiometer; SPOT = Satellite Pour l’Observation de la Terre
MERIS = Medium-Spectral Resolution, Imaging Spectrometer; Proba-V sensor is a European follow-on to the SPOT VGT mission
U.S. Geological Survey
U.S. Department of Interior
GRIP1000-2class map. An aggregated 2-class SPOT-Vegetation, AVHRR and other ancillary data
derived global rainfed and irrigated-area product @ 1000m (GRIP1000) developed using multiple-
satellite sensor time-series data and ancillary data as reported in Teluguntla et al. (2016, 2015).
Global Croplands for Food and Water Security in the Twenty-first Century
GFSAD @ 1KM (GRIP1000): 2 Class Map
Thenkabail et al., 2012. PE&RS, Vol. 78, No.8 using data from Glieck, 2011
How Countries consume water for Agriculture to grow food
Predicting and Preventing Crisis in Cropland Water Use in a Changing Climate through
Agricultural Crop Water Use
U.S. Geological Survey
U.S. Department of Interior
Foley, D.J., Thenkabail, P.S., Aneece, I., and Teluguntla, P. 2019. A meta-analysis of global crop water productivity of three
leading world crops (wheat, corn, and rice) in the irrigated areas over three decades, International Journal of Digital Earth,
DOI: 10.1080/17538947.2019.1651912 Link to this article: https://doi.org/10.1080/17538947.2019.1651912 IP-105160
Predicting and Preventing Crisis in Cropland Water Use in a Changing Climate through
Global Food productivity Increases through Crop Water Productivity: Wheat Crop (kgm3)
U.S. Geological Survey
U.S. Department of Interior
Goal and Products
https://www.usgs.gov/apps/croplands/app/map (www.croplands.org)
https://lpdaac.usgs.gov/news/release-of-gfsad-30-meter-cropland-extent-products/
https://lpdaac.usgs.gov/news/release-of-lgrip30-data-product/
www.usgs.gov/wgsc/gfsad30
U.S. Geological Survey
U.S. Department of Interior
Global Croplands for Food and Water Security in the Twenty-first Century
Global Food Security Support Analysis Data (GFSAD) Project
Mapping Global Irrigated and Rainfed Croplands
The overarching goal of GFSAD project is to make
effective use of USGS and NASA multiple satellite sensor
Petabyte-volume Planet-scale data on the cloud using
automated machine learning algorithms to derive a
series of nominal 30-m cropland products to help us
understand, assess, and manage global agriculture,
water, and food security.
U.S. Geological Survey
U.S. Department of Interior
1. Global Cropland Extent Product
2. Global Irrigated versus
Rainfed Croplands
4. Global Major Crop Types
3. Global Cropping Intensities
Global Croplands for Food and Water Security in the Twenty-first Century
Baseline Cropland Products for Food and Water Security
Four
Baseline
Cropland
Products
U.S. Geological Survey
U.S. Department of Interior
Within and Across Field Variability
1. Croplands versus non-croplands
2. Irrigated versus Rainfed croplands
3. Cropping intensities
4. Crop types
5. Crop growth stages
6. Cropland fallows versus croplands
7. Crop productivity
8. Crop water use
9. Crop water productivity
10. Species composition (e.g., Oryza sativa, O. glaberrima);
11. Vegetation or crop type (e.g., soybeans vs. corn);
12. Biophysical properties (e.g., LAI, biomass, yield, density);
13. Biochemical properties (e.g, Carotenoids, Chlorophyll);
14. Disease and stress (e.g., insect infestation, drought),
15. Nutrients (e.g., Nitrogen),
16. Moisture (e.g., leaf moisture),
17. Light use efficiency,
18. Net primary productivity and so on.
Global Croplands for Food and Water Security in the Twenty-first Century
Global Cropland Products from Satellites Allow us to
Model, Map, Monitor Every Farm in the World for Every Parameter
U.S. Geological Survey
U.S. Department of Interior
Mapping the World’s Croplands
from Earth Observing (EO) Satellites
https://www.usgs.gov/apps/croplands/app/map (www.croplands.org)
https://lpdaac.usgs.gov/news/release-of-gfsad-30-meter-cropland-extent-products/
https://lpdaac.usgs.gov/news/release-of-lgrip30-data-product/
www.usgs.gov/wgsc/gfsad30
U.S. Geological Survey
U.S. Department of Interior
Landsat-derived Global Cropland Extent Product at 30m (LGCEP30)
Understanding Cropland Extent
Definitions: Net Cropland Extent Includes
Croplands + cropland fallows + Plantations
All croplands cultivated for food, feed, and fiber, including plantations (e.g., orchards,
vineyards, coffee, tea, rubber) or croplands that are left fallow
U.S. Geological Survey
U.S. Department of Interior
Landsat-derived Global Rainfed and Irrigated-Cropland Product at 30m (LGRIP30)
Definitions: Irrigated Areas
• Irrigation is defined as artificial application of any amount of water to
overcome crop water stress.
• Irrigated areas are those areas which are irrigated one or more times
during crop growing season. This definition is key to mapping. Even if
croplands get artificial watering one or more times during the growing
season, it is defined as irrigated areas for purpose of this mapping.
• Artificial irrigation can come from various sources such as canals
delivering water from reservoirs (e.g., from major, medium, or minor
dams or tanks), and ground water pumping. Water is, typically,
delivered by gravity (e.g., river diversions or canals delivering water
directly by flooding) or drip or sprinklers or any other means
including hand carried and delivered.
U.S. Geological Survey
U.S. Department of Interior
Landsat-derived Global Rainfed and Irrigated-Cropland Product at 30m (LGRIP30)
Irrigated Areas Sample Illustrations
Center Pivots (Texas, USA) Run of the river (Ganges, India) Major Reservoirs (Mysore, India)
River deltas (Tamil Nadu, India)
Canal systems (California, USA) Deltas, Reservoirs Riverine systems (Egypt) Flood plains (Pakistan & India)
Minor reservoirs (Central India) Canal systems (Rajasthan, India)
U.S. Geological Survey
U.S. Department of Interior
Yellow river basin, China Xin Jiang, China Yangon, Myanmar
Bali, Indonesia N of Cape Town, South Africa
Mekong River Delta, Vietnam Chao Phraya Basin near Bangkok, Thailand Java, Indonesia
South of Casablanca, Morocco
Landsat-derived Global Rainfed and Irrigated-Cropland Product at 30m (LGRIP30)
Irrigated Areas Sample Illustrations
U.S. Geological Survey
U.S. Department of Interior
Landsat-derived Global Rainfed and Irrigated-Cropland Product at 30m (LGRIP30)
Definitions: Rainfed Areas
Cropland areas that have no irrigation whatsoever and
are fully dependent on precipitation (rainfall or moisture
retained from snowfall).
Thereby, rainfed areas are those croplands that are not
watered by artificial means but purely dependent on
nature.
U.S. Geological Survey
U.S. Department of Interior
Mid West, Ohio, USA Winnipeg, Canada Pampas, Argentina
Sahel, Niger
NE Dublin, Ireland
Wales, UK West of Perth, Australia
Sudan Savanna, Nigeria Derzhavinskiy, Kazakhstan
Landsat-derived Global Rainfed and Irrigated-Cropland Product at 30m (LGRIP30)
Rainfed Areas Sample Illustrations
U.S. Geological Survey
U.S. Department of Interior
North of Birmingham, UK North of Nantes, France N&NW Hamburg, Germany
Rajasthan, India
East of Nairobi, Kenya
North of Dakar, Senegal East of Bulawayo, Zimbabwe
South of Moscow, Russia NE China
Landsat-derived Global Rainfed and Irrigated-Cropland Product at 30m (LGRIP30)
Rainfed Areas Sample Illustrations
U.S. Geological Survey
U.S. Department of Interior
Methods
Global Food Security-support Analysis Data (GFSAD) Products
https://www.usgs.gov/apps/croplands/app/map (www.croplands.org)
https://lpdaac.usgs.gov/news/release-of-gfsad-30-meter-cropland-extent-products/
https://lpdaac.usgs.gov/news/release-of-lgrip30-data-product/
www.usgs.gov/wgsc/gfsad30
U.S. Geological Survey
U.S. Department of Interior
3. Machine LearningDeep Learning Algorithms
Pixel-based supervised MLAs) along with
Object-based hierarchical segmentation (HSEG)
A. Random forest algorithms
B. Support vector machines
C. Automated cropland classification algorithms
D. Spectral matching techniques
E. Decision Tree algorithms
F. Linear discriminant analysis
G. Principal component analysis, change detection analysis
H. kMeans, Isoclass clustering
I. Classification and Regression Tree (CART)
J. Tree-based regression algorithm
K. Phenology based methods
L. Fourier harmonic analysis
M. Hierarchical segmentation
4. Cloud Computing (e.g., Google Earth Engine)
1. Multiple Satellite Image Acquisitions
2. Analysis Ready Data (ARD)
Credit: NASAEarthdataCEOS
Mega-file Data-cube: Harmonized;Standardized
USGS Landsat Collection 2 release for the World: 49 years of data
• https://www.usgs.gov/news/usgs-releases-most-advanced-landsat-archive-date
Landsat-derived Global Cropland Mapping Methods
A “paradigm-shift” in how we Produce Global Cropland Maps
5. Automation and Artificial Intelligence
U.S. Geological Survey
U.S. Department of Interior
Landsat-derived Global Cropland Mapping Methods
Global Mapping Methods: Croplands, Irrigated Vs. Rainfed
Machine Learning Algorithms (MLAs)
U.S. Geological Survey
U.S. Department of Interior
Landsat-derived Global Cropland Mapping Methods
74 Agroecological Zones (AEZs) of the World
Derived off: https://gaez.fao.org/
U.S. Geological Survey
U.S. Department of Interior
Landsat-derived Global Cropland Mapping Methods
Analysis Ready Data (ARD) Data Cubes
Also see: USGS Landsat Collection 2 release for the World: 49 years of data
• https://www.usgs.gov/news/usgs-releases-most-advanced-landsat-archive-date
• Landsat-8, 9, Sentinel-2, and NASA’s Harmonized Landsat Sentinel-2 (HLS) Landsat product (HLSL30) for 2013-
present and HLS S2 product (HLSS30) for 2015-present (Masek et al., 2022)
U.S. Geological Survey
U.S. Department of Interior
72 AEZ’s
Landsat 2013-2016
Gorelick, N., et al., 2017. Google Earth Engine: Planetary-
scale geospatial analysis for everyone, Remote Sensing of
Environment, http://dx.doi.org/10.1016/j.rse.2017.06.031
Landsat-derived Global Cropland Mapping Methods
Analysis Ready Data, Machine Learning, Cloud computing
U.S. Geological Survey
U.S. Department of Interior
Table. Characteristics of some of the twenty-first century
satellites1.
PlanetScope Doves RapidEye SkySat Landsat 8 Sentinel-2
Number of
satellites 200+ 5 13 1 2
Spectral
resolution 4-8 bands 5 bands 5 bands (R, G, B, NIR, pan) 11 bands (VNIR, SWIR, TIR, pan) 13 bands (VNIR, SWIR)
Spatial
resolution 3-4 m 6.5 m 0.5-1 m 30 m multispectral, 15 m pan 10, 20, or 60 m depending on band
Temporal
resolution Daily at nadir
Daily off-nadir, 5.5
days at nadir 4-5 days 16 days 5 days
Image
dimension 24 by 7 km
77 km by up to
300 km 3.2 by 1.3 km 185 by 180 km 290 by 300 km
Radiometric
resolution 8 to 16 bit 8 to 16 bit 8 to 16 bit 12 to 16 bit 12 bit
Note:
1 = This Table was compiled by Dr. Itiya Aneece, Mendenhall Post-doctoral researcher @
Timelapse credit:
Will Marshall,
Planet Labs Inc.
200+ satellites gather 0.5 to 3
meter data daily for the entire
Planet. Realistically, weekly of
bi-weekly composites @ 3-m to
overcome cloud issues
Timelapse credit:Planet Labs Inc.
Planetscope 200+ satellites ; 350 M+ km2/day
Rapideye 5 satellites ; 6.5 M km2/day
Skysat 15 satellites ; 0.5 M km2/day
Source: Planet Labs Inc.
Note: 7 Petabytes currently; adding ~ 7+ terabytes daily
Landsat-derived Global Cropland Mapping Methods
Sourcing Reference data from Hyperspatial (sub-meter to 5-m) Data of the World
U.S. Geological Survey
U.S. Department of Interior
Reference samples of irrigated areas from sub-meter to 5-m very high-resolution imagery (VHRI). These
data are used in :
1. Training machine learning and other algorithms,
2. Identifying and labeling classes, and
3. Validation of cropland products.
Landsat-derived Global Cropland Mapping Methods
Sourcing Reference Data from Very High-Resolution Imagery: Irrigated Areas
Sourcing Reference Data for Training and Validation: Croplands
Illustrations for Australia (~2000 samples) and China (~4000 samples)
U.S. Geological Survey
U.S. Department of Interior
Australia: Ground-data (top); VHRI (bottom) China: Ground-data (top); VHRI (bottom)
U.S. Geological Survey
U.S. Department of Interior
Ground data samples of irrigated areas. These data were gathered from various sources and compiled into
database. These data are used in :
1. Training machine learning and other algorithms,
2. Identifying and labeling classes, and
3. Validation of cropland products.
Landsat-derived Global Cropland Mapping Methods
Sourcing Reference Data from the Ground: Irrigated Areas
U.S. Geological Survey
U.S. Department of Interior
Landsat-derived Global Cropland Mapping Methods
Sourcing Reference Data from Very High-Resolution Imagery: Rainfed Areas
Reference samples of rainfed areas from sub-meter to 5-m very high-resolution imagery (VHRI). These
data are used in :
1. Training machine learning and other algorithms,
2. Identifying and labeling classes, and
U.S. Geological Survey
U.S. Department of Interior
Ground data samples of rainfed areas. These data were gathered from various sources and compiled into
database. These data are used in :
1. Training machine learning and other algorithms,
2. Identifying and labeling classes, and
Landsat-derived Global Cropland Mapping Methods
Sourcing Reference Data from the Ground: : Rainfed Areas
U.S. Geological Survey
U.S. Department of Interior
Distribution of Reference training, testing, and validation data gathered from multiple sources either through ground data or
through sub-meter to 5-m very high-resolution imagery data (Teluguntla et al., 2023, Thenkabail et al., 2021, Congalton et al., 2017).
These data are used in :
1. Training machine learning and other algorithms,
2. Identifying and labeling classes, and
Landsat-derived Global Cropland Mapping Methods
Reference Data Synthesis: Croplands Vs Non-croplands for the World
U.S. Geological Survey
U.S. Department of Interior
Landsat-derived Global Cropland Mapping Methods
Reference Data Synthesis: Irrigated cropland samples for the World
Distribution of Reference training, testing, and validation data gathered from multiple sources either through ground data or
through sub-meter to 5-m very high-resolution imagery data (Teluguntla et al., 2023, Thenkabail et al., 2021, Congalton et al., 2017).
These data are used in :
1. Training machine learning and other algorithms,
2. Identifying and labeling classes, and
U.S. Geological Survey
U.S. Department of Interior
Landsat-derived Global Cropland Mapping Methods
Reference Data Synthesis: Rainfed cropland samples for the World
Distribution of Reference training, testing, and validation data gathered from multiple sources either through ground data or
through sub-meter to 5-m very high-resolution imagery data (Teluguntla et al., 2023, Thenkabail et al., 2021, Congalton et al., 2017).
These data are used in :
1. Training machine learning and other algorithms,
2. Identifying and labeling classes, and
Landsat-derived Global Cropland Mapping Methods
Sampling for Knowledge generation for Croplands vs. Non-croplands
U.S. Geological Survey
U.S. Department of Interior
Landsat-derived Global Cropland Mapping Methods
Knowledge generation for Machine Learning Algorithms to Map Croplands vs. Non-croplands
U.S. Geological Survey
U.S. Department of Interior
Landsat-derived Global Cropland Mapping Methods
Croplands vs. Non-croplands Map for an area in Africa using Multiple Machine Learning Algorithms
(a) the pixel-based classification from random forest classifier; (b) the object-based RHSeg image segmentation
result; (c) the merged results with RHSeg segmentation result with pixel-based Random Forest classification; and
(d) a true color Google Earth Imagery for reference.
U.S. Geological Survey
U.S. Department of Interior
Landsat-derived Global Cropland Mapping Methods
Knowledge generation for Machine Learning Algorithms to Map Irrigated vs. Rainfed
U.S. Geological Survey
U.S. Department of Interior
Landsat-derived Global Cropland Mapping Methods
Unsupervised Machine Learning Algorithm for Irrigated vs. Rainfed croplands
Irrigated Classes of Africa: 40 to 21 Classes
Grouping classes from the irrigated area mask. All similar classes
were grouped together and labeled. Here we illustrate 40 classes
reduced to 21 similar classes.
2. Irrigated area classes: Preliminary 40 class signatures
3. Grouping distinct Irrigated area classes together: 40 to 21 classes
1. Irrigated area classes: Preliminary 40 classes
U.S. Geological Survey
U.S. Department of Interior
Landsat-derived Global Cropland Mapping Methods
Irrigated Class Identifying and Labelling: Spectral matching Techniques (SMTs)
1. Ideal spectra from reference data
2. Class spectra of similar classes from Isoclass
3. Match Class spectra with ideal spectra
4. Group class spectra and match with ideal spectra
Quantitative spectral
matching techniques
(SMTs):
1. Spectral correlation
similarity (SCR) R2:
Shape measure.
2. Spectral similarity
value (SSV): Shape and
Magnitude measure.
3. Modified spectral
angle similarity (MSAS):
Angle measure
(Thenkabail et al., 2007,
Teluguntla et al, 2017)
U.S. Geological Survey
U.S. Department of Interior
Landsat-derived Global Cropland Mapping Methods
Irrigated Class Identifying and Labelling: Spectral matching Techniques
(SMTs)
)
1. Ideal spectra from reference data 2. Class spectra of similar classes from Isoclass
3. Match Class spectra with ideal spectra 4. Group class spectra and match with ideal spectra
Classes are
grouped,
identified, labeled
Quantitative
spectral matching
techniques (SMTs):
1. Spectral
correlation
similarity (SCR) R2:
Shape measure.
2. Spectral
similarity value
(SSV): Shape and
Magnitude
measure.
3. Modified
spectral angle
similarity (MSAS):
Angle measure
(Thenkabail et al.,
2007, Teluguntla et
U.S. Geological Survey
U.S. Department of Interior
Space-time spectral curves (ST SCs): See how the irrigated, rainfed, and
other classes move around in 2D space during a calendar year.
Landsat-derived Global Cropland Mapping Methods
Irrigated versus Rainfed: Space-Time Spiral Curves (ST SCs)
Dots indicate Julian dates of a calendar year and
how they move around in 2-D space
U.S. Geological Survey
U.S. Department of Interior
Landsat-derived Global Cropland Mapping Methods
Irrigated Area Classes for Africa (Level I): 24 Classes
Irrigated,
single crop
is dominant
in Africa
……………
………..
But,
there is
significant
irrigated
double crop
U.S. Geological Survey
U.S. Department of Interior
Landsat-derived Global Cropland Mapping Methods
Rainfed Area Classes for Africa (Level I): 23 Classes
Rainfed,
single
crop is
dominant
in Africa
U.S. Geological Survey
U.S. Department of Interior
Landsat-derived Global Cropland Mapping Methods
Irrigated 5 classes and Rainfed 6 Classes (Level II)
Africa rainfed cropland area: 263.5 Mha
U.S. Geological Survey
U.S. Department of Interior
Landsat-derived Global Cropland Mapping Methods
Irrigated and Rainfed combined 11 Classes (Level II)
rainfed
rainfed
irrigated
irrigated
U.S. Geological Survey
U.S. Department of Interior
Results
Global Food Security-support Analysis Data (GFSAD) Products
https://www.usgs.gov/apps/croplands/app/map (www.croplands.org)
https://lpdaac.usgs.gov/news/release-of-gfsad-30-meter-cropland-extent-products/
https://lpdaac.usgs.gov/news/release-of-lgrip30-data-product/
www.usgs.gov/wgsc/gfsad30
Landsat-derived Global Cropland Mapping: Results
Landsat-derived Global Cropland Extent at 30m (LGCEP30) for Africa
U.S. Geological Survey
U.S. Department of Interior
Landsat-derived Global Cropland Mapping: Results
Landsat-derived Global Rainfed and Irrigated-Cropland Product at 30m (LGRIP30) for Africa
rainfed
rainfed
irrigated
irrigated
U.S. Geological Survey
U.S. Department of Interior
Landsat-derived Global Cropland Mapping: Results
Landsat-derived Global Cropland Extent at 30m (LGCEP30) for CONUS
U.S. Geological Survey
U.S. Department of Interior
Landsat-derived Global Cropland Mapping: Results
Landsat-derived Global Rainfed and Irrigated-Cropland Product at 30m (LGRIP30) for CONUS
U.S. Geological Survey
U.S. Department of Interior
Results: Global
Global Food Security-support Analysis Data (GFSAD) Products
https://www.usgs.gov/apps/croplands/app/map (www.croplands.org)
https://lpdaac.usgs.gov/news/release-of-gfsad-30-meter-cropland-extent-products/
https://lpdaac.usgs.gov/news/release-of-lgrip30-data-product/
www.usgs.gov/wgsc/gfsad30
U.S. Geological Survey
U.S. Department of Interior
Landsat-derived Global Cropland Mapping: Results
Landsat-derived Global Cropland Extent at 30m (LGCEP30)
Total cropland areas = 1.8 billion hectares
U.S. Geological Survey
U.S. Department of Interior
Landsat-derived Global rainfed & irrigated product @ 30m (LGRIP30)
for the nominal year 2015
Landsat-derived Global Cropland Mapping: Results
Landsat-derived Global Rainfed and Irrigated-Cropland Product at 30m (LGRIP30)
39%
61% Total cropland areas = 1.8 billion hectares
U.S. Geological Survey
U.S. Department of Interior
Landsat-derived Global Cropland Mapping: Results
Landsat-derived Global Rainfed and Irrigated-Cropland Product at 30m (LGRIP30) :
State and County-wise Irrigated and Rainfed Area
25%
75%
Total cropland Area 168 Mha
Irrigated croplands (~25%)
Rainfed croplands (~75%)
U.S. Geological Survey
U.S. Department of Interior
Landsat-derived Global rainfed & irrigated product @ 30m (LGRIP30)
for the nominal year 2015. Zoom in views of Nebraska, USA.
Landsat-derived Global Cropland Mapping: Results
Landsat-derived Global Rainfed and Irrigated-Cropland Product at 30m (LGRIP30) :
County-wise Irrigated and Rainfed Area: Nebraska
U.S. Geological Survey
U.S. Department of Interior
Landsat-derived Global rainfed & irrigated product @ 30m (LGRIP30)
for the nominal year 2015. Zoom in views of California, USA.
Landsat-derived Global Cropland Mapping: Results
Landsat-derived Global Rainfed and Irrigated-Cropland Product at 30m (LGRIP30) :
County-wise Irrigated and Rainfed Area: California
U.S. Geological Survey
U.S. Department of Interior
Landsat-derived Global Cropland Mapping: Results
Landsat-derived Global Rainfed and Irrigated-Cropland Product at 30m (LGRIP30) :
Causes for Increase in Irrigated Areas of the World
1.Definition of irrigated area: Supplemental irrigation has become a norm. So, these irrigated
areas are swiftly increasing when we consider supplemental irrigation.
2. Technological advances in water delivery to agriculture: In much of the world technological
advances has created greater and greater irrigation facility. For example, most farmers these
days use some form of irrigation either by pumping water directly from rivers or from open
wells or from deep acquirer wells. In India, for example, between 1950 and 2010, the number of
drilled tube wells increased from 1 million to nearly 30 million (World Bank, 2020). The number
of deep tube wells in the country saw surge from 1.46 million to 2.6 million in just between 2006-
07 and 2013-14 (Business Standard, 2017).
3. Equipped area for irrigation: our irrigated areas consider all irrigated areas equipped for
irrigation as irrigated areas even when part of those are not irrigated at times (or left fallows).
For example, significant pasturehay are included in irrigated areas in few countries.
4. Climate factor: In an increasingly changing climate, purely rainfall dependent agriculture is
reducing swiftly. Even when rainfall amount is normal, it’s timeliness in delivery varies. Crops
need water in timely manner and when rainfall fails to follow a pattern during the growing
season, plants will need water from irrigation and hence supplemental irrigation is greatly
increasing, primarily through pumping from open wells, tube-wells, and directly from rivers.
U.S. Geological Survey
U.S. Department of Interior
Landsat-derived Global Cropland Mapping: Results
Landsat-derived Global Rainfed and Irrigated-Cropland Product at 30m (LGRIP30) :
Causes for Increase in Irrigated Areas of the World
The global net irrigated areas (GNIA) reported in our study (715 Mha) is substantially higher
compared to previous studies which report GNIA that varied between 307-450 Mha (Puy et al.,
2020, Salmon et al., 2015, Siebert et al., 2013, 2001, FAO, 2012b, FAO, 2015, Thenkabail et al.
2012, 2011, 2009a). This is not surprising. Indeed, in a recent study by Puy et al., (2020) of
Princeton University in a paper in the Nature Communications suggested that the amount of
irrigated land could in fact increase to as high as 1.8 billion hectares by 2050. They suggested in
the paper that “Policymakers should acknowledge that irrigated areas can grow much more than
previously thought in order to avoid underestimating potential environmental costs”. Puy et al.
(2020) clearly demonstrate that the current models underestimate irrigated areas. Rosa et al.
(2020) showed that up to 35% of the current rainfed areas have potential for irrigation
expansion in a climate change scenario of temperature warming between 1.5-3 degree Celsius.
Our results show that this irrigation expansion is already happening at a rapid phase. In an
increasingly changing climate, complete dependance on precipitation which has wide variability
is becoming unsustainable and some supplemental irrigation in the least is necessary to ensure
optimal productivity andor to sustain any productivity at all in rainfed croplands. Further,
most of lower irrigated areas reported in the range around 307-450 Mha estimates were for the
2000-2005 period (Salmon et al., 2015, Thenkabail et al., 2011, 2009a). These estimates were 307-
311 Mha for 2000-2008 period (Siebert et al., 2015, FAO, 2012b, Siebert and Döll, 2001, 2010,
Siebert at al., 2013), 314 Mha for 2005 by Salmon et al. (2015), and 399 Mha by Thenkabail et
al. (2011, 2009a) for nominal 2000.
U.S. Geological Survey
U.S. Department of Interior
Accuracies
Global Food Security-support Analysis Data (GFSAD) Products
https://www.usgs.gov/apps/croplands/app/map (www.croplands.org)
https://lpdaac.usgs.gov/news/release-of-gfsad-30-meter-cropland-extent-products/
https://lpdaac.usgs.gov/news/release-of-lgrip30-data-product/
www.usgs.gov/wgsc/gfsad30
Landsat-derived Global Cropland Mapping: Accuracies
Landsat-derived Global Cropland Extent at 30m (LGCEP30)
Zone-by-Zone Error Matrices
U.S. Geological Survey
U.S. Department of Interior
Reference Data
Crop No-Crop Total User Accuracy
Map
Data Crop 255 48 303 84.16%
No-Crop 51 830 881 94.21%
Total 306 878 1,184
Producer Accuracy 83.33% 94.53% 91.64%
Reference Data
Crop No-Crop Total User Accuracy
Map
Data
Crop 140 18 158 88.61%
No-Crop 24 67 91 73.63%
Total 164 85 249
Producer Accuracy 85.37% 78.82% 83.13%
Reference Data
Crop No-Crop Total User Accuracy
Map
Data
Crop 43 5 48 89.58%
No-Crop 4 198 202 98.02%
Total 47 203 250
Producer Accuracy 91.49% 97.54% 96.40%
Landsat-derived Global Cropland Mapping: Accuracies
Landsat-derived Global Cropland Extent at 30m (LGCEP30)
Accuracy Error Matrices: Global
For the entire world, the global cropland extent product had an overall accuracy of 91.7%.
For the cropland class, the producer’s accuracy was 83.4% (errors of omission of 16.6%)
and user’s accuracies of 78.3% (errors of commissions of 21.7%).
U.S. Geological Survey
U.S. Department of Interior
U.S. Geological Survey
U.S. Department of Interior
Distribution of Reference validation data used accuracy assessments of Landsat-
derived Global Rainfed and Irrigated-Cropland Product @ 30-m (LGRIP30).
There were 10,477 samples of which 5667 were rainfed and 4810 were irrigated.
Landsat-derived Global Cropland Mapping: Accuracies
Landsat-derived Global Rainfed and Irrigated-Cropland Product at 30m (LGRIP30)
Reference Validation Data: Irrigated versus Rainfed
U.S. Geological Survey
U.S. Department of Interior
Accuracy error matrix of the world.:
Global accuracy assessment error matrix showing the overall accuracies, user’s
accuracies, and producer’s accuracies. Number of validation samples, N = 10477.
Landsat-derived Global Cropland Mapping: Accuracies
Landsat-derived Global Rainfed and Irrigated-Cropland Product at 30m (LGRIP30)
Accuracy Error Matrices: Global
ReferenceData
Class Irrigated Rainfed Row total
Commission
error
Irrigated 4171 774 4945 15.7%
Rainfed 639 4893 5532 11.6%
Column total 4810 5667 10477
Omission error 13.3% 13.7%
Producer accuracy 86.7% 86.3%
User accuracy 84.3% 88.4%
Overall accuracy 86.5%
U.S. Geological Survey
U.S. Department of Interior
Area Statistics
Global Food Security-support Analysis Data (GFSAD) Products
https://www.usgs.gov/apps/croplands/app/map (www.croplands.org)
https://lpdaac.usgs.gov/news/release-of-gfsad-30-meter-cropland-extent-products/
https://lpdaac.usgs.gov/news/release-of-lgrip30-data-product/
www.usgs.gov/wgsc/gfsad30
/
What you would like to get out of the summit
●
●
Landsat-derived Global Cropland Mapping: Area Results
Landsat-derived Global Cropland Extent at 30m (LGCEP30)
Cropland Area by Country as % of Total Net Global Cropland Areas
U.S. Geological Survey
U.S. Department of Interior
U.S. Geological Survey
U.S. Department of Interior
Landsat-derived Global Cropland Mapping: Area Results
Landsat-derived Global Rainfed and Irrigated-Cropland Product at 30m (LGRIP30)
Irrigated Areas as percentage of the Global Net Irrigated Areas
U.S. Geological Survey
U.S. Department of Interior
Landsat-derived Global Cropland Mapping: Area Results
Landsat-derived Global Rainfed and Irrigated-Cropland Product at 30m (LGRIP30)
Rainfed Areas as percentage of the Global Net Rainfed Areas
U.S. Geological Survey
U.S. Department of Interior
Landsat-derived Global Cropland Mapping: Area Results
Irrigated Area Map of CONUS: County-wise
Fresno
Merced,
Tulare,
San Joaquin
& Kenn
Grant
Mississippi
U.S. Geological Survey
U.S. Department of Interior
Landsat-derived Global Cropland Mapping: Area Results
Rainfed Area of CONUS: County-wise Rainfed Area
Chouteau & Hill
Cass,
Stutsman &
Ward
Whitman county
U.S. Geological Survey
U.S. Department of Interior
Landsat-derived Global Cropland Mapping: Area Results
Total (Irrigated and Rainfed) cropland area Map of CONUS: County-wise
U.S. Geological Survey
U.S. Department of Interior
Way Forward
Global Food Security-support Analysis Data (GFSAD) Products
https://www.usgs.gov/apps/croplands/app/map (www.croplands.org)
https://lpdaac.usgs.gov/news/release-of-gfsad-30-meter-cropland-extent-products/
https://lpdaac.usgs.gov/news/release-of-lgrip30-data-product/
www.usgs.gov/wgsc/gfsad30
/
U.S. Geological Survey
U.S. Department of Interior
Landsat-derived Global Cropland Mapping: Level I, Detailed Mapping
Telangana State, India: Irrigated Areas, Level I 37 classes
U.S. Geological Survey
U.S. Department of Interior
Landsat-derived Global Cropland Mapping: Level I, Class Signatures
Telangana State, India: Irrigated, Level I, 37 Class Signatures
U.S. Geological Survey
U.S. Department of Interior
Landsat-derived Global Cropland Mapping: Level I, Detailed Mapping
Telangana State, India: Rainfed Areas, Level I, 22 classes
U.S. Geological Survey
U.S. Department of Interior
Landsat-derived Global Cropland Mapping: Level II, Aggregated Classes
Telangana State, India: Rainfed and Irrigated (LGRIP30-Telangana), Level II, 6 classes
U.S. Geological Survey
U.S. Department of Interior
Landsat-derived Global Cropland Mapping: Level III, Aggregated Classes
Telangana State, India: Rainfed and Irrigated (LGRIP30-Telangana), Level III, 2 classes
U.S. Geological Survey
U.S. Department of Interior
Landsat-derived Global Cropland Mapping: Level III, Aggregated Classes
Telangana State, India: Rainfed and Irrigated (LGRIP30-Telangana), Level III, 2 classes
Accuracies:
Irrigated area class
Producer accuracy:
92.9%
(Errors of
Omissions: 7.1%)
User accuracy:
98.5%
(Errors of
Commissions:
1.5%)
U.S. Geological Survey
U.S. Department of Interior
Impact
Global Food Security-support Analysis Data (GFSAD) Products
https://www.usgs.gov/apps/croplands/app/map (www.croplands.org)
https://lpdaac.usgs.gov/news/release-of-gfsad-30-meter-cropland-extent-products/
https://lpdaac.usgs.gov/news/release-of-lgrip30-data-product/
www.usgs.gov/wgsc/gfsad30
U.S. Geological Survey
U.S. Department of Interior
Landsat-derived Global Cropland Mapping: Impact
Monthly Data Users and Downloads: 126 Countries Have used GFSAD Data
Oliphant, A., Thenkabail, P.S., and Teluguntla, P., 2022. Global Food Security-support
Analysis Data at 30 meters (GFSAD30) Cropland Product: Impact Analysis November
2017 through December 2019. Open File Report, United States Geological Survey. IP-
119165.
GFSAD data from
NASA’s
LP DAAC.
2018-2021,
126 countries,
2022
72 countries
2021
96 countries
2023
Every month about 20
countries use our data
U.S. Geological Survey
U.S. Department of Interior
Global Croplands for Food and Water Security in the Twenty-first Century
DATA AccessDissemination
Peer-reviewed Manuscripts
USGS Professional Paper:
Thenkabail, P.S., Teluguntla, P.G., Xiong, J., Oliphant, A., Congalton,
R.G., Ozdogan, M., Gumma, M.K., Tilton, J.C., Giri, C., Milesi, C., Phalke,
A., Massey, R., Yadav, K., Sankey, T., Zhong, Y., Aneece, I., and Foley, D.,
2021, Global cropland-extent product at 30-m resolution (GCEP30)
derived from Landsat satellite time-series data for the year 2015 using
multiple machine-learning algorithms on Google Earth Engine cloud:
U.S. Geological Survey Professional Paper 1868, 63 p.,
https://doi.org/10.3133/pp1868. https://lpdaac.usgs.gov/news/release-of-
gfsad-30-meter-cropland-extent-products/ IP-119164.
For 12 other related publications, go to “Publications”
section in:
www.usgs.gov/wgsc/gfsad30
Note: From 2017-present: these papers have over 2000 citations
U.S. Geological Survey
U.S. Department of Interior
Dissemination
Global Food Security-support Analysis Data (GFSAD) Products
https://www.usgs.gov/apps/croplands/app/map (www.croplands.org)
https://lpdaac.usgs.gov/news/release-of-gfsad-30-meter-cropland-extent-products/
https://lpdaac.usgs.gov/news/release-of-lgrip30-data-product/
www.usgs.gov/wgsc/gfsad30
What you would like to get out of the summit
●
●
1. GFSAD Web Sites:
www.usgs.gov/wgsc/gfsad30
2. Data Download from LP DAAC:
30m Products:
https://lpdaac.usgs.gov/news/release-of-gfsad-30-meter-cropland-extent-products/
https://lpdaac.usgs.gov/news/release-of-lgrip30-data-product/
https://lpdaac.usgs.gov/products/lgrip30v001/
1Km products:
https://lpdaac.usgs.gov/products/gfsad1kcdv001/
https://lpdaac.usgs.gov/products/gfsad1kcmv001/
3. Browse and View
www.croplands.org
Landsat-derived Global Cropland Mapping

More Related Content

Similar to Mapping Global Croplands for Food Security

Drought monitoring, Precipitation statistics, and water balance with freely a...
Drought monitoring, Precipitation statistics, and water balance with freely a...Drought monitoring, Precipitation statistics, and water balance with freely a...
Drought monitoring, Precipitation statistics, and water balance with freely a...AngelosAlamanos
 
Global Climate Change: Drought Assessment + Impacts
Global Climate Change: Drought Assessment + ImpactsGlobal Climate Change: Drought Assessment + Impacts
Global Climate Change: Drought Assessment + ImpactsJenkins Macedo
 
Advances in agricultural drought monitoring and forecasting
Advances in agricultural drought monitoring and forecastingAdvances in agricultural drought monitoring and forecasting
Advances in agricultural drought monitoring and forecastingAbhilash Singh Chauhan
 
RemoteSensingProjectPaper
RemoteSensingProjectPaperRemoteSensingProjectPaper
RemoteSensingProjectPaperJames Sherwood
 
drought monitoring and management using remote sensing
drought monitoring and management using remote sensingdrought monitoring and management using remote sensing
drought monitoring and management using remote sensingveerendra manduri
 
Geographical Information System
Geographical Information SystemGeographical Information System
Geographical Information SystemDevegowda S R
 
Agusan River Basin Hydrological Modeling
Agusan River Basin Hydrological ModelingAgusan River Basin Hydrological Modeling
Agusan River Basin Hydrological Modelingglenn_batincila
 
Multi-Scale Investigation of Winter Runoff and Nutrient Loss Processes in Act...
Multi-Scale Investigation of Winter Runoff and Nutrient Loss Processes in Act...Multi-Scale Investigation of Winter Runoff and Nutrient Loss Processes in Act...
Multi-Scale Investigation of Winter Runoff and Nutrient Loss Processes in Act...National Institute of Food and Agriculture
 
Yield Forecasting to Sustain the Agricultural Transportation UnderStochastic ...
Yield Forecasting to Sustain the Agricultural Transportation UnderStochastic ...Yield Forecasting to Sustain the Agricultural Transportation UnderStochastic ...
Yield Forecasting to Sustain the Agricultural Transportation UnderStochastic ...IJRESJOURNAL
 
The West Africa-America Chamber of Commerce & Industries presents: Big Data &...
The West Africa-America Chamber of Commerce & Industries presents: Big Data &...The West Africa-America Chamber of Commerce & Industries presents: Big Data &...
The West Africa-America Chamber of Commerce & Industries presents: Big Data &...David Lary
 
1 Introduction to yield gap analysis
1 Introduction to yield gap analysis1 Introduction to yield gap analysis
1 Introduction to yield gap analysisCIP-PSE
 
6. papia guha, pritam aitch and gupinath bhandari
6. papia guha, pritam aitch and gupinath bhandari6. papia guha, pritam aitch and gupinath bhandari
6. papia guha, pritam aitch and gupinath bhandariJournal of Global Resources
 
DSD-INT 2017 Groundwater in Global Hydrology - Bierkens
DSD-INT 2017 Groundwater in Global Hydrology - BierkensDSD-INT 2017 Groundwater in Global Hydrology - Bierkens
DSD-INT 2017 Groundwater in Global Hydrology - BierkensDeltares
 

Similar to Mapping Global Croplands for Food Security (20)

NASA - NACD Panel 20220718 (1).pptx
NASA - NACD Panel 20220718 (1).pptxNASA - NACD Panel 20220718 (1).pptx
NASA - NACD Panel 20220718 (1).pptx
 
Drought monitoring, Precipitation statistics, and water balance with freely a...
Drought monitoring, Precipitation statistics, and water balance with freely a...Drought monitoring, Precipitation statistics, and water balance with freely a...
Drought monitoring, Precipitation statistics, and water balance with freely a...
 
WA+ Praveen Kalura.pptx
WA+ Praveen Kalura.pptxWA+ Praveen Kalura.pptx
WA+ Praveen Kalura.pptx
 
Global Climate Change: Drought Assessment + Impacts
Global Climate Change: Drought Assessment + ImpactsGlobal Climate Change: Drought Assessment + Impacts
Global Climate Change: Drought Assessment + Impacts
 
Advances in agricultural drought monitoring and forecasting
Advances in agricultural drought monitoring and forecastingAdvances in agricultural drought monitoring and forecasting
Advances in agricultural drought monitoring and forecasting
 
RemoteSensingProjectPaper
RemoteSensingProjectPaperRemoteSensingProjectPaper
RemoteSensingProjectPaper
 
12 ijcse-01224
12 ijcse-0122412 ijcse-01224
12 ijcse-01224
 
Mohsin final seminar
Mohsin final seminarMohsin final seminar
Mohsin final seminar
 
drought monitoring and management using remote sensing
drought monitoring and management using remote sensingdrought monitoring and management using remote sensing
drought monitoring and management using remote sensing
 
Geographical Information System
Geographical Information SystemGeographical Information System
Geographical Information System
 
Water Productivity Mapping (WPM) at various Resolutions (scales) using Remote...
Water Productivity Mapping (WPM) at various Resolutions (scales) using Remote...Water Productivity Mapping (WPM) at various Resolutions (scales) using Remote...
Water Productivity Mapping (WPM) at various Resolutions (scales) using Remote...
 
Agusan River Basin Hydrological Modeling
Agusan River Basin Hydrological ModelingAgusan River Basin Hydrological Modeling
Agusan River Basin Hydrological Modeling
 
Multi-Scale Investigation of Winter Runoff and Nutrient Loss Processes in Act...
Multi-Scale Investigation of Winter Runoff and Nutrient Loss Processes in Act...Multi-Scale Investigation of Winter Runoff and Nutrient Loss Processes in Act...
Multi-Scale Investigation of Winter Runoff and Nutrient Loss Processes in Act...
 
Yield Forecasting to Sustain the Agricultural Transportation UnderStochastic ...
Yield Forecasting to Sustain the Agricultural Transportation UnderStochastic ...Yield Forecasting to Sustain the Agricultural Transportation UnderStochastic ...
Yield Forecasting to Sustain the Agricultural Transportation UnderStochastic ...
 
Available data for crop modelling
Available data for crop modelling Available data for crop modelling
Available data for crop modelling
 
The West Africa-America Chamber of Commerce & Industries presents: Big Data &...
The West Africa-America Chamber of Commerce & Industries presents: Big Data &...The West Africa-America Chamber of Commerce & Industries presents: Big Data &...
The West Africa-America Chamber of Commerce & Industries presents: Big Data &...
 
1 Introduction to yield gap analysis
1 Introduction to yield gap analysis1 Introduction to yield gap analysis
1 Introduction to yield gap analysis
 
6. papia guha, pritam aitch and gupinath bhandari
6. papia guha, pritam aitch and gupinath bhandari6. papia guha, pritam aitch and gupinath bhandari
6. papia guha, pritam aitch and gupinath bhandari
 
Mapping and modeling affected areas by environment and climate stresses: Egyp...
Mapping and modeling affected areas by environment and climate stresses: Egyp...Mapping and modeling affected areas by environment and climate stresses: Egyp...
Mapping and modeling affected areas by environment and climate stresses: Egyp...
 
DSD-INT 2017 Groundwater in Global Hydrology - Bierkens
DSD-INT 2017 Groundwater in Global Hydrology - BierkensDSD-INT 2017 Groundwater in Global Hydrology - Bierkens
DSD-INT 2017 Groundwater in Global Hydrology - Bierkens
 

More from Daugherty Water for Food Global Institute

Local Solutions to Drought: Groundwater Transfers in Nebraska – From policies...
Local Solutions to Drought: Groundwater Transfers in Nebraska – From policies...Local Solutions to Drought: Groundwater Transfers in Nebraska – From policies...
Local Solutions to Drought: Groundwater Transfers in Nebraska – From policies...Daugherty Water for Food Global Institute
 
Drought risk financing: Why writing the last chapter first matters – From pol...
Drought risk financing: Why writing the last chapter first matters – From pol...Drought risk financing: Why writing the last chapter first matters – From pol...
Drought risk financing: Why writing the last chapter first matters – From pol...Daugherty Water for Food Global Institute
 
Catalyzing and coordinating action: Insight from the development of drought a...
Catalyzing and coordinating action: Insight from the development of drought a...Catalyzing and coordinating action: Insight from the development of drought a...
Catalyzing and coordinating action: Insight from the development of drought a...Daugherty Water for Food Global Institute
 
Building Collaborations and Combined Drought Indicators Aimed at Bettering ou...
Building Collaborations and Combined Drought Indicators Aimed at Bettering ou...Building Collaborations and Combined Drought Indicators Aimed at Bettering ou...
Building Collaborations and Combined Drought Indicators Aimed at Bettering ou...Daugherty Water for Food Global Institute
 
Global efforts to address drought risk: Perspectives from the UNCCD – From po...
Global efforts to address drought risk: Perspectives from the UNCCD – From po...Global efforts to address drought risk: Perspectives from the UNCCD – From po...
Global efforts to address drought risk: Perspectives from the UNCCD – From po...Daugherty Water for Food Global Institute
 
Drought and Health: Engaging Public Health and Other Stakeholders – Coping wi...
Drought and Health: Engaging Public Health and Other Stakeholders – Coping wi...Drought and Health: Engaging Public Health and Other Stakeholders – Coping wi...
Drought and Health: Engaging Public Health and Other Stakeholders – Coping wi...Daugherty Water for Food Global Institute
 
Global View of Health and Air Quality at NASA - Coping with the impacts of dr...
Global View of Health and Air Quality at NASA - Coping with the impacts of dr...Global View of Health and Air Quality at NASA - Coping with the impacts of dr...
Global View of Health and Air Quality at NASA - Coping with the impacts of dr...Daugherty Water for Food Global Institute
 
USDA Farm Service Agency: Addressing Drought – Coping with the impacts of dro...
USDA Farm Service Agency: Addressing Drought – Coping with the impacts of dro...USDA Farm Service Agency: Addressing Drought – Coping with the impacts of dro...
USDA Farm Service Agency: Addressing Drought – Coping with the impacts of dro...Daugherty Water for Food Global Institute
 
Breaking the Link between Drought and Suicide: Understanding the Mental Healt...
Breaking the Link between Drought and Suicide: Understanding the Mental Healt...Breaking the Link between Drought and Suicide: Understanding the Mental Healt...
Breaking the Link between Drought and Suicide: Understanding the Mental Healt...Daugherty Water for Food Global Institute
 
Drought Impacts on Health – Coping with the impacts of drought on human healt...
Drought Impacts on Health – Coping with the impacts of drought on human healt...Drought Impacts on Health – Coping with the impacts of drought on human healt...
Drought Impacts on Health – Coping with the impacts of drought on human healt...Daugherty Water for Food Global Institute
 
Oil Palm Intensification in indonesia Reconciles Economic and Environmental O...
Oil Palm Intensification in indonesia Reconciles Economic and Environmental O...Oil Palm Intensification in indonesia Reconciles Economic and Environmental O...
Oil Palm Intensification in indonesia Reconciles Economic and Environmental O...Daugherty Water for Food Global Institute
 
Learning from Farmers Fields to Improve Yield and Profit: a case study for so...
Learning from Farmers Fields to Improve Yield and Profit: a case study for so...Learning from Farmers Fields to Improve Yield and Profit: a case study for so...
Learning from Farmers Fields to Improve Yield and Profit: a case study for so...Daugherty Water for Food Global Institute
 
Increasing wheat production with a lower environmental footprint – Sustainabl...
Increasing wheat production with a lower environmental footprint – Sustainabl...Increasing wheat production with a lower environmental footprint – Sustainabl...
Increasing wheat production with a lower environmental footprint – Sustainabl...Daugherty Water for Food Global Institute
 
Good agronomy is needed for increasing corn yields and self-sufficiency in Su...
Good agronomy is needed for increasing corn yields and self-sufficiency in Su...Good agronomy is needed for increasing corn yields and self-sufficiency in Su...
Good agronomy is needed for increasing corn yields and self-sufficiency in Su...Daugherty Water for Food Global Institute
 
Intensification of Brazilian Agriculture: reconciling protection of the Amazo...
Intensification of Brazilian Agriculture: reconciling protection of the Amazo...Intensification of Brazilian Agriculture: reconciling protection of the Amazo...
Intensification of Brazilian Agriculture: reconciling protection of the Amazo...Daugherty Water for Food Global Institute
 
Sustainable crop intensification: from concept to real world examples – Susta...
Sustainable crop intensification: from concept to real world examples – Susta...Sustainable crop intensification: from concept to real world examples – Susta...
Sustainable crop intensification: from concept to real world examples – Susta...Daugherty Water for Food Global Institute
 
Intensification of Brazilian Agriculture: reconciling protection of the Amazo...
Intensification of Brazilian Agriculture: reconciling protection of the Amazo...Intensification of Brazilian Agriculture: reconciling protection of the Amazo...
Intensification of Brazilian Agriculture: reconciling protection of the Amazo...Daugherty Water for Food Global Institute
 
The Colorado River: Behind The Headlines: Views From The Field – Plenary III ...
The Colorado River: Behind The Headlines: Views From The Field – Plenary III ...The Colorado River: Behind The Headlines: Views From The Field – Plenary III ...
The Colorado River: Behind The Headlines: Views From The Field – Plenary III ...Daugherty Water for Food Global Institute
 
Impacts of deficit irrigation practices for conserving water in horticultural...
Impacts of deficit irrigation practices for conserving water in horticultural...Impacts of deficit irrigation practices for conserving water in horticultural...
Impacts of deficit irrigation practices for conserving water in horticultural...Daugherty Water for Food Global Institute
 

More from Daugherty Water for Food Global Institute (20)

Local Solutions to Drought: Groundwater Transfers in Nebraska – From policies...
Local Solutions to Drought: Groundwater Transfers in Nebraska – From policies...Local Solutions to Drought: Groundwater Transfers in Nebraska – From policies...
Local Solutions to Drought: Groundwater Transfers in Nebraska – From policies...
 
Drought risk financing: Why writing the last chapter first matters – From pol...
Drought risk financing: Why writing the last chapter first matters – From pol...Drought risk financing: Why writing the last chapter first matters – From pol...
Drought risk financing: Why writing the last chapter first matters – From pol...
 
Catalyzing and coordinating action: Insight from the development of drought a...
Catalyzing and coordinating action: Insight from the development of drought a...Catalyzing and coordinating action: Insight from the development of drought a...
Catalyzing and coordinating action: Insight from the development of drought a...
 
Building Collaborations and Combined Drought Indicators Aimed at Bettering ou...
Building Collaborations and Combined Drought Indicators Aimed at Bettering ou...Building Collaborations and Combined Drought Indicators Aimed at Bettering ou...
Building Collaborations and Combined Drought Indicators Aimed at Bettering ou...
 
Global efforts to address drought risk: Perspectives from the UNCCD – From po...
Global efforts to address drought risk: Perspectives from the UNCCD – From po...Global efforts to address drought risk: Perspectives from the UNCCD – From po...
Global efforts to address drought risk: Perspectives from the UNCCD – From po...
 
Drought and Health: Engaging Public Health and Other Stakeholders – Coping wi...
Drought and Health: Engaging Public Health and Other Stakeholders – Coping wi...Drought and Health: Engaging Public Health and Other Stakeholders – Coping wi...
Drought and Health: Engaging Public Health and Other Stakeholders – Coping wi...
 
Global View of Health and Air Quality at NASA - Coping with the impacts of dr...
Global View of Health and Air Quality at NASA - Coping with the impacts of dr...Global View of Health and Air Quality at NASA - Coping with the impacts of dr...
Global View of Health and Air Quality at NASA - Coping with the impacts of dr...
 
USDA Farm Service Agency: Addressing Drought – Coping with the impacts of dro...
USDA Farm Service Agency: Addressing Drought – Coping with the impacts of dro...USDA Farm Service Agency: Addressing Drought – Coping with the impacts of dro...
USDA Farm Service Agency: Addressing Drought – Coping with the impacts of dro...
 
Breaking the Link between Drought and Suicide: Understanding the Mental Healt...
Breaking the Link between Drought and Suicide: Understanding the Mental Healt...Breaking the Link between Drought and Suicide: Understanding the Mental Healt...
Breaking the Link between Drought and Suicide: Understanding the Mental Healt...
 
Drought Impacts on Health – Coping with the impacts of drought on human healt...
Drought Impacts on Health – Coping with the impacts of drought on human healt...Drought Impacts on Health – Coping with the impacts of drought on human healt...
Drought Impacts on Health – Coping with the impacts of drought on human healt...
 
Oil Palm Intensification in indonesia Reconciles Economic and Environmental O...
Oil Palm Intensification in indonesia Reconciles Economic and Environmental O...Oil Palm Intensification in indonesia Reconciles Economic and Environmental O...
Oil Palm Intensification in indonesia Reconciles Economic and Environmental O...
 
Learning from Farmers Fields to Improve Yield and Profit: a case study for so...
Learning from Farmers Fields to Improve Yield and Profit: a case study for so...Learning from Farmers Fields to Improve Yield and Profit: a case study for so...
Learning from Farmers Fields to Improve Yield and Profit: a case study for so...
 
Increasing wheat production with a lower environmental footprint – Sustainabl...
Increasing wheat production with a lower environmental footprint – Sustainabl...Increasing wheat production with a lower environmental footprint – Sustainabl...
Increasing wheat production with a lower environmental footprint – Sustainabl...
 
Good agronomy is needed for increasing corn yields and self-sufficiency in Su...
Good agronomy is needed for increasing corn yields and self-sufficiency in Su...Good agronomy is needed for increasing corn yields and self-sufficiency in Su...
Good agronomy is needed for increasing corn yields and self-sufficiency in Su...
 
Intensification of Brazilian Agriculture: reconciling protection of the Amazo...
Intensification of Brazilian Agriculture: reconciling protection of the Amazo...Intensification of Brazilian Agriculture: reconciling protection of the Amazo...
Intensification of Brazilian Agriculture: reconciling protection of the Amazo...
 
Intensification of Brazilian Agriculture: reconciling protection of the Amazo...
Intensification of Brazilian Agriculture: reconciling protection of the Amazo...Intensification of Brazilian Agriculture: reconciling protection of the Amazo...
Intensification of Brazilian Agriculture: reconciling protection of the Amazo...
 
Sustainable crop intensification: from concept to real world examples – Susta...
Sustainable crop intensification: from concept to real world examples – Susta...Sustainable crop intensification: from concept to real world examples – Susta...
Sustainable crop intensification: from concept to real world examples – Susta...
 
Intensification of Brazilian Agriculture: reconciling protection of the Amazo...
Intensification of Brazilian Agriculture: reconciling protection of the Amazo...Intensification of Brazilian Agriculture: reconciling protection of the Amazo...
Intensification of Brazilian Agriculture: reconciling protection of the Amazo...
 
The Colorado River: Behind The Headlines: Views From The Field – Plenary III ...
The Colorado River: Behind The Headlines: Views From The Field – Plenary III ...The Colorado River: Behind The Headlines: Views From The Field – Plenary III ...
The Colorado River: Behind The Headlines: Views From The Field – Plenary III ...
 
Impacts of deficit irrigation practices for conserving water in horticultural...
Impacts of deficit irrigation practices for conserving water in horticultural...Impacts of deficit irrigation practices for conserving water in horticultural...
Impacts of deficit irrigation practices for conserving water in horticultural...
 

Recently uploaded

Hubble Asteroid Hunter III. Physical properties of newly found asteroids
Hubble Asteroid Hunter III. Physical properties of newly found asteroidsHubble Asteroid Hunter III. Physical properties of newly found asteroids
Hubble Asteroid Hunter III. Physical properties of newly found asteroidsSérgio Sacani
 
Traditional Agroforestry System in India- Shifting Cultivation, Taungya, Home...
Traditional Agroforestry System in India- Shifting Cultivation, Taungya, Home...Traditional Agroforestry System in India- Shifting Cultivation, Taungya, Home...
Traditional Agroforestry System in India- Shifting Cultivation, Taungya, Home...jana861314
 
Behavioral Disorder: Schizophrenia & it's Case Study.pdf
Behavioral Disorder: Schizophrenia & it's Case Study.pdfBehavioral Disorder: Schizophrenia & it's Case Study.pdf
Behavioral Disorder: Schizophrenia & it's Case Study.pdfSELF-EXPLANATORY
 
Natural Polymer Based Nanomaterials
Natural Polymer Based NanomaterialsNatural Polymer Based Nanomaterials
Natural Polymer Based NanomaterialsAArockiyaNisha
 
Nightside clouds and disequilibrium chemistry on the hot Jupiter WASP-43b
Nightside clouds and disequilibrium chemistry on the hot Jupiter WASP-43bNightside clouds and disequilibrium chemistry on the hot Jupiter WASP-43b
Nightside clouds and disequilibrium chemistry on the hot Jupiter WASP-43bSérgio Sacani
 
Discovery of an Accretion Streamer and a Slow Wide-angle Outflow around FUOri...
Discovery of an Accretion Streamer and a Slow Wide-angle Outflow around FUOri...Discovery of an Accretion Streamer and a Slow Wide-angle Outflow around FUOri...
Discovery of an Accretion Streamer and a Slow Wide-angle Outflow around FUOri...Sérgio Sacani
 
GFP in rDNA Technology (Biotechnology).pptx
GFP in rDNA Technology (Biotechnology).pptxGFP in rDNA Technology (Biotechnology).pptx
GFP in rDNA Technology (Biotechnology).pptxAleenaTreesaSaji
 
Call Girls in Munirka Delhi 💯Call Us 🔝8264348440🔝
Call Girls in Munirka Delhi 💯Call Us 🔝8264348440🔝Call Girls in Munirka Delhi 💯Call Us 🔝8264348440🔝
Call Girls in Munirka Delhi 💯Call Us 🔝8264348440🔝soniya singh
 
Call Girls in Munirka Delhi 💯Call Us 🔝9953322196🔝 💯Escort.
Call Girls in Munirka Delhi 💯Call Us 🔝9953322196🔝 💯Escort.Call Girls in Munirka Delhi 💯Call Us 🔝9953322196🔝 💯Escort.
Call Girls in Munirka Delhi 💯Call Us 🔝9953322196🔝 💯Escort.aasikanpl
 
Cultivation of KODO MILLET . made by Ghanshyam pptx
Cultivation of KODO MILLET . made by Ghanshyam pptxCultivation of KODO MILLET . made by Ghanshyam pptx
Cultivation of KODO MILLET . made by Ghanshyam pptxpradhanghanshyam7136
 
VIRUSES structure and classification ppt by Dr.Prince C P
VIRUSES structure and classification ppt by Dr.Prince C PVIRUSES structure and classification ppt by Dr.Prince C P
VIRUSES structure and classification ppt by Dr.Prince C PPRINCE C P
 
Artificial Intelligence In Microbiology by Dr. Prince C P
Artificial Intelligence In Microbiology by Dr. Prince C PArtificial Intelligence In Microbiology by Dr. Prince C P
Artificial Intelligence In Microbiology by Dr. Prince C PPRINCE C P
 
PossibleEoarcheanRecordsoftheGeomagneticFieldPreservedintheIsuaSupracrustalBe...
PossibleEoarcheanRecordsoftheGeomagneticFieldPreservedintheIsuaSupracrustalBe...PossibleEoarcheanRecordsoftheGeomagneticFieldPreservedintheIsuaSupracrustalBe...
PossibleEoarcheanRecordsoftheGeomagneticFieldPreservedintheIsuaSupracrustalBe...Sérgio Sacani
 
Labelling Requirements and Label Claims for Dietary Supplements and Recommend...
Labelling Requirements and Label Claims for Dietary Supplements and Recommend...Labelling Requirements and Label Claims for Dietary Supplements and Recommend...
Labelling Requirements and Label Claims for Dietary Supplements and Recommend...Lokesh Kothari
 
Nanoparticles synthesis and characterization​ ​
Nanoparticles synthesis and characterization​  ​Nanoparticles synthesis and characterization​  ​
Nanoparticles synthesis and characterization​ ​kaibalyasahoo82800
 
Spermiogenesis or Spermateleosis or metamorphosis of spermatid
Spermiogenesis or Spermateleosis or metamorphosis of spermatidSpermiogenesis or Spermateleosis or metamorphosis of spermatid
Spermiogenesis or Spermateleosis or metamorphosis of spermatidSarthak Sekhar Mondal
 
Recombinant DNA technology (Immunological screening)
Recombinant DNA technology (Immunological screening)Recombinant DNA technology (Immunological screening)
Recombinant DNA technology (Immunological screening)PraveenaKalaiselvan1
 
Biological Classification BioHack (3).pdf
Biological Classification BioHack (3).pdfBiological Classification BioHack (3).pdf
Biological Classification BioHack (3).pdfmuntazimhurra
 
Physiochemical properties of nanomaterials and its nanotoxicity.pptx
Physiochemical properties of nanomaterials and its nanotoxicity.pptxPhysiochemical properties of nanomaterials and its nanotoxicity.pptx
Physiochemical properties of nanomaterials and its nanotoxicity.pptxAArockiyaNisha
 

Recently uploaded (20)

Hubble Asteroid Hunter III. Physical properties of newly found asteroids
Hubble Asteroid Hunter III. Physical properties of newly found asteroidsHubble Asteroid Hunter III. Physical properties of newly found asteroids
Hubble Asteroid Hunter III. Physical properties of newly found asteroids
 
Traditional Agroforestry System in India- Shifting Cultivation, Taungya, Home...
Traditional Agroforestry System in India- Shifting Cultivation, Taungya, Home...Traditional Agroforestry System in India- Shifting Cultivation, Taungya, Home...
Traditional Agroforestry System in India- Shifting Cultivation, Taungya, Home...
 
Behavioral Disorder: Schizophrenia & it's Case Study.pdf
Behavioral Disorder: Schizophrenia & it's Case Study.pdfBehavioral Disorder: Schizophrenia & it's Case Study.pdf
Behavioral Disorder: Schizophrenia & it's Case Study.pdf
 
Natural Polymer Based Nanomaterials
Natural Polymer Based NanomaterialsNatural Polymer Based Nanomaterials
Natural Polymer Based Nanomaterials
 
Nightside clouds and disequilibrium chemistry on the hot Jupiter WASP-43b
Nightside clouds and disequilibrium chemistry on the hot Jupiter WASP-43bNightside clouds and disequilibrium chemistry on the hot Jupiter WASP-43b
Nightside clouds and disequilibrium chemistry on the hot Jupiter WASP-43b
 
Discovery of an Accretion Streamer and a Slow Wide-angle Outflow around FUOri...
Discovery of an Accretion Streamer and a Slow Wide-angle Outflow around FUOri...Discovery of an Accretion Streamer and a Slow Wide-angle Outflow around FUOri...
Discovery of an Accretion Streamer and a Slow Wide-angle Outflow around FUOri...
 
GFP in rDNA Technology (Biotechnology).pptx
GFP in rDNA Technology (Biotechnology).pptxGFP in rDNA Technology (Biotechnology).pptx
GFP in rDNA Technology (Biotechnology).pptx
 
Call Girls in Munirka Delhi 💯Call Us 🔝8264348440🔝
Call Girls in Munirka Delhi 💯Call Us 🔝8264348440🔝Call Girls in Munirka Delhi 💯Call Us 🔝8264348440🔝
Call Girls in Munirka Delhi 💯Call Us 🔝8264348440🔝
 
Call Girls in Munirka Delhi 💯Call Us 🔝9953322196🔝 💯Escort.
Call Girls in Munirka Delhi 💯Call Us 🔝9953322196🔝 💯Escort.Call Girls in Munirka Delhi 💯Call Us 🔝9953322196🔝 💯Escort.
Call Girls in Munirka Delhi 💯Call Us 🔝9953322196🔝 💯Escort.
 
Cultivation of KODO MILLET . made by Ghanshyam pptx
Cultivation of KODO MILLET . made by Ghanshyam pptxCultivation of KODO MILLET . made by Ghanshyam pptx
Cultivation of KODO MILLET . made by Ghanshyam pptx
 
VIRUSES structure and classification ppt by Dr.Prince C P
VIRUSES structure and classification ppt by Dr.Prince C PVIRUSES structure and classification ppt by Dr.Prince C P
VIRUSES structure and classification ppt by Dr.Prince C P
 
Artificial Intelligence In Microbiology by Dr. Prince C P
Artificial Intelligence In Microbiology by Dr. Prince C PArtificial Intelligence In Microbiology by Dr. Prince C P
Artificial Intelligence In Microbiology by Dr. Prince C P
 
PossibleEoarcheanRecordsoftheGeomagneticFieldPreservedintheIsuaSupracrustalBe...
PossibleEoarcheanRecordsoftheGeomagneticFieldPreservedintheIsuaSupracrustalBe...PossibleEoarcheanRecordsoftheGeomagneticFieldPreservedintheIsuaSupracrustalBe...
PossibleEoarcheanRecordsoftheGeomagneticFieldPreservedintheIsuaSupracrustalBe...
 
Labelling Requirements and Label Claims for Dietary Supplements and Recommend...
Labelling Requirements and Label Claims for Dietary Supplements and Recommend...Labelling Requirements and Label Claims for Dietary Supplements and Recommend...
Labelling Requirements and Label Claims for Dietary Supplements and Recommend...
 
Nanoparticles synthesis and characterization​ ​
Nanoparticles synthesis and characterization​  ​Nanoparticles synthesis and characterization​  ​
Nanoparticles synthesis and characterization​ ​
 
Spermiogenesis or Spermateleosis or metamorphosis of spermatid
Spermiogenesis or Spermateleosis or metamorphosis of spermatidSpermiogenesis or Spermateleosis or metamorphosis of spermatid
Spermiogenesis or Spermateleosis or metamorphosis of spermatid
 
Recombinant DNA technology (Immunological screening)
Recombinant DNA technology (Immunological screening)Recombinant DNA technology (Immunological screening)
Recombinant DNA technology (Immunological screening)
 
The Philosophy of Science
The Philosophy of ScienceThe Philosophy of Science
The Philosophy of Science
 
Biological Classification BioHack (3).pdf
Biological Classification BioHack (3).pdfBiological Classification BioHack (3).pdf
Biological Classification BioHack (3).pdf
 
Physiochemical properties of nanomaterials and its nanotoxicity.pptx
Physiochemical properties of nanomaterials and its nanotoxicity.pptxPhysiochemical properties of nanomaterials and its nanotoxicity.pptx
Physiochemical properties of nanomaterials and its nanotoxicity.pptx
 

Mapping Global Croplands for Food Security

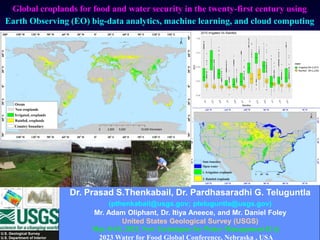
  • 1. U.S. Geological Survey U.S. Department of Interior Global croplands for food and water security in the twenty-first century using Earth Observing (EO) big-data analytics, machine learning, and cloud computing May 8-10, 2023, New Techniques for Water Management II @ 2023 Water for Food Global Conference, Nebraska , USA Dr. Prasad S.Thenkabail, Dr. Pardhasaradhi G. Teluguntla (pthenkabail@usgs.gov; pteluguntla@usgs.gov) Mr. Adam Oliphant, Dr. Itiya Aneece, and Mr. Daniel Foley United States Geological Survey (USGS)
  • 2. U.S. Geological Survey U.S. Department of Interior Background https://www.usgs.gov/apps/croplands/app/map (www.croplands.org) https://lpdaac.usgs.gov/news/release-of-gfsad-30-meter-cropland-extent-products/ https://lpdaac.usgs.gov/news/release-of-lgrip30-data-product/ www.usgs.gov/wgsc/gfsad30
  • 3. Global Croplands for Food and Water Security in the Twenty-first Century Importance of Global Croplands for Life and Livelihoods U.S. Geological Survey U.S. Department of Interior Requires Energy Availability of Land for Food Security Availability of Water for Food Security Contributes to Nutritional needs Needed for Feeding animals Adapting to Climate Change for Food Security Global Croplands Affects Economy, Population, Peace Leveraging Virtual Land & Water for Food Security
  • 4. U.S. Geological Survey U.S. Department of Interior Global Croplands for Food and Water Security in the Twenty-first Century Background: Global Population Dynamics Source: Data from the History Database of the Global Environment, HYDE V3.2
  • 5. U.S. Geological Survey U.S. Department of Interior 1540 Mha 240 Mha Sources: Cao et al., 2021, Goldewijk et al., 2010, Ramankutty and Foley, 1999, HYDE 2.0, Houghton et al., 1983, Thenkabail et al., 2015 140 Mha 36 Mha 84 Mha 52 Mha 145 Mha 200 Mha 293 Mha 840 Mha 260 Mha 429 Mha Global Croplands for Food and Water Security in the Twenty-first Century Background: Global Cropland Dynamics 1800 Mha in 2020
  • 6. U.S. Geological Survey U.S. Department of Interior Current State-of-Art https://www.usgs.gov/apps/croplands/app/map (www.croplands.org) https://lpdaac.usgs.gov/news/release-of-gfsad-30-meter-cropland-extent-products/ https://lpdaac.usgs.gov/news/release-of-lgrip30-data-product/ www.usgs.gov/wgsc/gfsad30
  • 7. U.S. Geological Survey U.S. Department of Interior ….typically, in 250m-10 km & as a result precision and accuracies of croplands location as well as cropland areas are lacking Global Croplands for Food and Water Security in the Twenty-first Century Existing Irrigated and Rainfed Cropland Products @ Coarse Resolution Sno Name * Institution ** Sensors *** Resolution, Nominal Time, Nominal Classes Reference (meters) (year) A. Global cropland products 1 GCEP30 USGS Landsat 7 & 8 30 2021 Croplands Thenkabail et al. (2021) 2 UCL UCDL Multiple 250 2010 Croplands, irrigated, rainfed Waldner et al. (2016) 3 MODIS Cropland SDSU & UMD MODIS 250 2000 Croplands Pitman et al. (2010) 4 GRIPC BU MODIS 500 2005 Croplands, irrigated, rainfed Salmon et al. (2015) 5 GFSADCD1KM USGS AVHRR 1000 2010 Crop dominance, irrigated, rainfed Thenkabail et al. (2012) 6 GFSADCM1KM USGS AVHRR, MODIS, Landsat 1000 2010 Croplands, irrigated, rainfed Teluguntla et al. (2015) 7 GIAM IWMI AVHRR, SPOT VEG 1000-10,000 2000 Croplands, irrigated Thenkabail et al. (2009) 8 GMRCA IWMI AVHRR, SPOT VEG 1000-10,000 2000 Croplands, rainfed Biradar et al. (2009) 9 MIRCA2000 UB 10,000 2000 Croplands. irrigated Portman, Seibert & Doll (2009) 10 SAGE-Crop UW 100,000 2000 Croplands, crop dominance Monfreda, Ramankutty & Foley (2008) 11 SAGE-Agri UW 100,000 2000 Croplands, crop dominance Ramankutty et al.(2008) B. Global LULC products in which cropland classes exist 12 WorldCover10V2 ESA Sentnel-2 10 2021 LULC Zanaga et al. (2022) 13 WorldCover10V1 ESA Sentnel-2 10 2020 LULC Zanaga et al. (2021), Karra et al. (2021) 14 Globeland30 NGCC Landsat 7 30 2010 LULC Chen et al. (2015) 15 FROM-GLC CAS Landsat 7 30 2000 Croplands Yu et al. (2013) 16 FROMGC CESS Landsat 7 30 Circa 2010 LULC Gong et al. (2013) 17 CGLS-LC100 Copernicus PROBA-V 100 2015 LULC Buchhorn et al.(2020) 18 MODIS-JRC JRC/MARS MODIS, Landsat 250 2009 LULC Vancutsem et al. (2012) 19 Globcover ESA MERIS 300 2005, 2009 LULC Defourny et al. (2009) 20 MCD12Q1 NASA MODIS 500 2004 - now LULC Leroux et al. (2014) 21 GLC BU MODIS 500 LULC Friedal et al. (2010) 22 DISCover USGS AVHRR 1000 1992-93 LULC Loveland et al.(2000) 23 LULC 2000 USGS AVHRR 2000 2000 LULC Soulard et al. (2014) 24 GLC 2000 JRC SPOT 1/112° 2000 LULC Fritz et al. (2010) Note: * = GCEP30= Global cropland extent product@30m; UCL = Unified Cropland Layer; GFSADCM1KM= Global Food Security-Support Analysis Data Cropland Mask @ 1-km; GRIPC= Global Rainfed, Irrigated, and Paddy Croplands;GFSADCD1KM= Global Food Security-Support Analysis Data Crop Dominance @ 1-km; MIRCA2000= Global monthly irrigated and rainfed crop areas around the year 2000; GIAM- Global Irrigated Area Map; GMRCA= Global Map of Rainfed Cropland Areas; SAGE= Center for Sustainability and the Global Environment;LULC = land use and land cover: MCD12Q1= MODIS Land Cover Type product; FROM-GLC = Fine Resolution Observation and Monitoring of Global Land Cover;FROMGC = Finer Resolution Observation and Monitoring of Global Land Cover CGLS= Copernicus Global Land Cover Layers; MODIS-JRC = MODIS Joint Research center; GLC = Global Land Cover. ** = UCDL = Université Catholique de Louvain, Belgium; USGS = United States Geological Survey; BU = Boston University SDSU = South Dakota State University. UMD = University of Maryland; UB = University of Bonn; IWMI= International Water Management Institute; UW = University of Wisconsin. NGCC = National Geomatics Center of China; NASA = National Aeronautics and Space Administration; CAS = Chinese Academy of Sciences. MARS = Monitoring Agricultural Resources; ESA = The European Space Agency. *** = AVHRR = Advanced Very High Resolution radiometer; MODIS = Moderate Resolution Imaging Spectroradiometer; SPOT = Satellite Pour l’Observation de la Terre MERIS = Medium-Spectral Resolution, Imaging Spectrometer; Proba-V sensor is a European follow-on to the SPOT VGT mission
  • 8. U.S. Geological Survey U.S. Department of Interior GRIP1000-2class map. An aggregated 2-class SPOT-Vegetation, AVHRR and other ancillary data derived global rainfed and irrigated-area product @ 1000m (GRIP1000) developed using multiple- satellite sensor time-series data and ancillary data as reported in Teluguntla et al. (2016, 2015). Global Croplands for Food and Water Security in the Twenty-first Century GFSAD @ 1KM (GRIP1000): 2 Class Map
  • 9. Thenkabail et al., 2012. PE&RS, Vol. 78, No.8 using data from Glieck, 2011 How Countries consume water for Agriculture to grow food Predicting and Preventing Crisis in Cropland Water Use in a Changing Climate through Agricultural Crop Water Use
  • 10. U.S. Geological Survey U.S. Department of Interior Foley, D.J., Thenkabail, P.S., Aneece, I., and Teluguntla, P. 2019. A meta-analysis of global crop water productivity of three leading world crops (wheat, corn, and rice) in the irrigated areas over three decades, International Journal of Digital Earth, DOI: 10.1080/17538947.2019.1651912 Link to this article: https://doi.org/10.1080/17538947.2019.1651912 IP-105160 Predicting and Preventing Crisis in Cropland Water Use in a Changing Climate through Global Food productivity Increases through Crop Water Productivity: Wheat Crop (kgm3)
  • 11. U.S. Geological Survey U.S. Department of Interior Goal and Products https://www.usgs.gov/apps/croplands/app/map (www.croplands.org) https://lpdaac.usgs.gov/news/release-of-gfsad-30-meter-cropland-extent-products/ https://lpdaac.usgs.gov/news/release-of-lgrip30-data-product/ www.usgs.gov/wgsc/gfsad30
  • 12. U.S. Geological Survey U.S. Department of Interior Global Croplands for Food and Water Security in the Twenty-first Century Global Food Security Support Analysis Data (GFSAD) Project Mapping Global Irrigated and Rainfed Croplands The overarching goal of GFSAD project is to make effective use of USGS and NASA multiple satellite sensor Petabyte-volume Planet-scale data on the cloud using automated machine learning algorithms to derive a series of nominal 30-m cropland products to help us understand, assess, and manage global agriculture, water, and food security.
  • 13. U.S. Geological Survey U.S. Department of Interior 1. Global Cropland Extent Product 2. Global Irrigated versus Rainfed Croplands 4. Global Major Crop Types 3. Global Cropping Intensities Global Croplands for Food and Water Security in the Twenty-first Century Baseline Cropland Products for Food and Water Security Four Baseline Cropland Products
  • 14. U.S. Geological Survey U.S. Department of Interior Within and Across Field Variability 1. Croplands versus non-croplands 2. Irrigated versus Rainfed croplands 3. Cropping intensities 4. Crop types 5. Crop growth stages 6. Cropland fallows versus croplands 7. Crop productivity 8. Crop water use 9. Crop water productivity 10. Species composition (e.g., Oryza sativa, O. glaberrima); 11. Vegetation or crop type (e.g., soybeans vs. corn); 12. Biophysical properties (e.g., LAI, biomass, yield, density); 13. Biochemical properties (e.g, Carotenoids, Chlorophyll); 14. Disease and stress (e.g., insect infestation, drought), 15. Nutrients (e.g., Nitrogen), 16. Moisture (e.g., leaf moisture), 17. Light use efficiency, 18. Net primary productivity and so on. Global Croplands for Food and Water Security in the Twenty-first Century Global Cropland Products from Satellites Allow us to Model, Map, Monitor Every Farm in the World for Every Parameter
  • 15. U.S. Geological Survey U.S. Department of Interior Mapping the World’s Croplands from Earth Observing (EO) Satellites https://www.usgs.gov/apps/croplands/app/map (www.croplands.org) https://lpdaac.usgs.gov/news/release-of-gfsad-30-meter-cropland-extent-products/ https://lpdaac.usgs.gov/news/release-of-lgrip30-data-product/ www.usgs.gov/wgsc/gfsad30
  • 16. U.S. Geological Survey U.S. Department of Interior Landsat-derived Global Cropland Extent Product at 30m (LGCEP30) Understanding Cropland Extent Definitions: Net Cropland Extent Includes Croplands + cropland fallows + Plantations All croplands cultivated for food, feed, and fiber, including plantations (e.g., orchards, vineyards, coffee, tea, rubber) or croplands that are left fallow
  • 17. U.S. Geological Survey U.S. Department of Interior Landsat-derived Global Rainfed and Irrigated-Cropland Product at 30m (LGRIP30) Definitions: Irrigated Areas • Irrigation is defined as artificial application of any amount of water to overcome crop water stress. • Irrigated areas are those areas which are irrigated one or more times during crop growing season. This definition is key to mapping. Even if croplands get artificial watering one or more times during the growing season, it is defined as irrigated areas for purpose of this mapping. • Artificial irrigation can come from various sources such as canals delivering water from reservoirs (e.g., from major, medium, or minor dams or tanks), and ground water pumping. Water is, typically, delivered by gravity (e.g., river diversions or canals delivering water directly by flooding) or drip or sprinklers or any other means including hand carried and delivered.
  • 18. U.S. Geological Survey U.S. Department of Interior Landsat-derived Global Rainfed and Irrigated-Cropland Product at 30m (LGRIP30) Irrigated Areas Sample Illustrations Center Pivots (Texas, USA) Run of the river (Ganges, India) Major Reservoirs (Mysore, India) River deltas (Tamil Nadu, India) Canal systems (California, USA) Deltas, Reservoirs Riverine systems (Egypt) Flood plains (Pakistan & India) Minor reservoirs (Central India) Canal systems (Rajasthan, India)
  • 19. U.S. Geological Survey U.S. Department of Interior Yellow river basin, China Xin Jiang, China Yangon, Myanmar Bali, Indonesia N of Cape Town, South Africa Mekong River Delta, Vietnam Chao Phraya Basin near Bangkok, Thailand Java, Indonesia South of Casablanca, Morocco Landsat-derived Global Rainfed and Irrigated-Cropland Product at 30m (LGRIP30) Irrigated Areas Sample Illustrations
  • 20. U.S. Geological Survey U.S. Department of Interior Landsat-derived Global Rainfed and Irrigated-Cropland Product at 30m (LGRIP30) Definitions: Rainfed Areas Cropland areas that have no irrigation whatsoever and are fully dependent on precipitation (rainfall or moisture retained from snowfall). Thereby, rainfed areas are those croplands that are not watered by artificial means but purely dependent on nature.
  • 21. U.S. Geological Survey U.S. Department of Interior Mid West, Ohio, USA Winnipeg, Canada Pampas, Argentina Sahel, Niger NE Dublin, Ireland Wales, UK West of Perth, Australia Sudan Savanna, Nigeria Derzhavinskiy, Kazakhstan Landsat-derived Global Rainfed and Irrigated-Cropland Product at 30m (LGRIP30) Rainfed Areas Sample Illustrations
  • 22. U.S. Geological Survey U.S. Department of Interior North of Birmingham, UK North of Nantes, France N&NW Hamburg, Germany Rajasthan, India East of Nairobi, Kenya North of Dakar, Senegal East of Bulawayo, Zimbabwe South of Moscow, Russia NE China Landsat-derived Global Rainfed and Irrigated-Cropland Product at 30m (LGRIP30) Rainfed Areas Sample Illustrations
  • 23. U.S. Geological Survey U.S. Department of Interior Methods Global Food Security-support Analysis Data (GFSAD) Products https://www.usgs.gov/apps/croplands/app/map (www.croplands.org) https://lpdaac.usgs.gov/news/release-of-gfsad-30-meter-cropland-extent-products/ https://lpdaac.usgs.gov/news/release-of-lgrip30-data-product/ www.usgs.gov/wgsc/gfsad30
  • 24. U.S. Geological Survey U.S. Department of Interior 3. Machine LearningDeep Learning Algorithms Pixel-based supervised MLAs) along with Object-based hierarchical segmentation (HSEG) A. Random forest algorithms B. Support vector machines C. Automated cropland classification algorithms D. Spectral matching techniques E. Decision Tree algorithms F. Linear discriminant analysis G. Principal component analysis, change detection analysis H. kMeans, Isoclass clustering I. Classification and Regression Tree (CART) J. Tree-based regression algorithm K. Phenology based methods L. Fourier harmonic analysis M. Hierarchical segmentation 4. Cloud Computing (e.g., Google Earth Engine) 1. Multiple Satellite Image Acquisitions 2. Analysis Ready Data (ARD) Credit: NASAEarthdataCEOS Mega-file Data-cube: Harmonized;Standardized USGS Landsat Collection 2 release for the World: 49 years of data • https://www.usgs.gov/news/usgs-releases-most-advanced-landsat-archive-date Landsat-derived Global Cropland Mapping Methods A “paradigm-shift” in how we Produce Global Cropland Maps 5. Automation and Artificial Intelligence
  • 25. U.S. Geological Survey U.S. Department of Interior Landsat-derived Global Cropland Mapping Methods Global Mapping Methods: Croplands, Irrigated Vs. Rainfed Machine Learning Algorithms (MLAs)
  • 26. U.S. Geological Survey U.S. Department of Interior Landsat-derived Global Cropland Mapping Methods 74 Agroecological Zones (AEZs) of the World Derived off: https://gaez.fao.org/
  • 27. U.S. Geological Survey U.S. Department of Interior Landsat-derived Global Cropland Mapping Methods Analysis Ready Data (ARD) Data Cubes Also see: USGS Landsat Collection 2 release for the World: 49 years of data • https://www.usgs.gov/news/usgs-releases-most-advanced-landsat-archive-date • Landsat-8, 9, Sentinel-2, and NASA’s Harmonized Landsat Sentinel-2 (HLS) Landsat product (HLSL30) for 2013- present and HLS S2 product (HLSS30) for 2015-present (Masek et al., 2022)
  • 28. U.S. Geological Survey U.S. Department of Interior 72 AEZ’s Landsat 2013-2016 Gorelick, N., et al., 2017. Google Earth Engine: Planetary- scale geospatial analysis for everyone, Remote Sensing of Environment, http://dx.doi.org/10.1016/j.rse.2017.06.031 Landsat-derived Global Cropland Mapping Methods Analysis Ready Data, Machine Learning, Cloud computing
  • 29. U.S. Geological Survey U.S. Department of Interior Table. Characteristics of some of the twenty-first century satellites1. PlanetScope Doves RapidEye SkySat Landsat 8 Sentinel-2 Number of satellites 200+ 5 13 1 2 Spectral resolution 4-8 bands 5 bands 5 bands (R, G, B, NIR, pan) 11 bands (VNIR, SWIR, TIR, pan) 13 bands (VNIR, SWIR) Spatial resolution 3-4 m 6.5 m 0.5-1 m 30 m multispectral, 15 m pan 10, 20, or 60 m depending on band Temporal resolution Daily at nadir Daily off-nadir, 5.5 days at nadir 4-5 days 16 days 5 days Image dimension 24 by 7 km 77 km by up to 300 km 3.2 by 1.3 km 185 by 180 km 290 by 300 km Radiometric resolution 8 to 16 bit 8 to 16 bit 8 to 16 bit 12 to 16 bit 12 bit Note: 1 = This Table was compiled by Dr. Itiya Aneece, Mendenhall Post-doctoral researcher @ Timelapse credit: Will Marshall, Planet Labs Inc. 200+ satellites gather 0.5 to 3 meter data daily for the entire Planet. Realistically, weekly of bi-weekly composites @ 3-m to overcome cloud issues Timelapse credit:Planet Labs Inc. Planetscope 200+ satellites ; 350 M+ km2/day Rapideye 5 satellites ; 6.5 M km2/day Skysat 15 satellites ; 0.5 M km2/day Source: Planet Labs Inc. Note: 7 Petabytes currently; adding ~ 7+ terabytes daily Landsat-derived Global Cropland Mapping Methods Sourcing Reference data from Hyperspatial (sub-meter to 5-m) Data of the World
  • 30. U.S. Geological Survey U.S. Department of Interior Reference samples of irrigated areas from sub-meter to 5-m very high-resolution imagery (VHRI). These data are used in : 1. Training machine learning and other algorithms, 2. Identifying and labeling classes, and 3. Validation of cropland products. Landsat-derived Global Cropland Mapping Methods Sourcing Reference Data from Very High-Resolution Imagery: Irrigated Areas
  • 31. Sourcing Reference Data for Training and Validation: Croplands Illustrations for Australia (~2000 samples) and China (~4000 samples) U.S. Geological Survey U.S. Department of Interior Australia: Ground-data (top); VHRI (bottom) China: Ground-data (top); VHRI (bottom)
  • 32. U.S. Geological Survey U.S. Department of Interior Ground data samples of irrigated areas. These data were gathered from various sources and compiled into database. These data are used in : 1. Training machine learning and other algorithms, 2. Identifying and labeling classes, and 3. Validation of cropland products. Landsat-derived Global Cropland Mapping Methods Sourcing Reference Data from the Ground: Irrigated Areas
  • 33. U.S. Geological Survey U.S. Department of Interior Landsat-derived Global Cropland Mapping Methods Sourcing Reference Data from Very High-Resolution Imagery: Rainfed Areas Reference samples of rainfed areas from sub-meter to 5-m very high-resolution imagery (VHRI). These data are used in : 1. Training machine learning and other algorithms, 2. Identifying and labeling classes, and
  • 34. U.S. Geological Survey U.S. Department of Interior Ground data samples of rainfed areas. These data were gathered from various sources and compiled into database. These data are used in : 1. Training machine learning and other algorithms, 2. Identifying and labeling classes, and Landsat-derived Global Cropland Mapping Methods Sourcing Reference Data from the Ground: : Rainfed Areas
  • 35. U.S. Geological Survey U.S. Department of Interior Distribution of Reference training, testing, and validation data gathered from multiple sources either through ground data or through sub-meter to 5-m very high-resolution imagery data (Teluguntla et al., 2023, Thenkabail et al., 2021, Congalton et al., 2017). These data are used in : 1. Training machine learning and other algorithms, 2. Identifying and labeling classes, and Landsat-derived Global Cropland Mapping Methods Reference Data Synthesis: Croplands Vs Non-croplands for the World
  • 36. U.S. Geological Survey U.S. Department of Interior Landsat-derived Global Cropland Mapping Methods Reference Data Synthesis: Irrigated cropland samples for the World Distribution of Reference training, testing, and validation data gathered from multiple sources either through ground data or through sub-meter to 5-m very high-resolution imagery data (Teluguntla et al., 2023, Thenkabail et al., 2021, Congalton et al., 2017). These data are used in : 1. Training machine learning and other algorithms, 2. Identifying and labeling classes, and
  • 37. U.S. Geological Survey U.S. Department of Interior Landsat-derived Global Cropland Mapping Methods Reference Data Synthesis: Rainfed cropland samples for the World Distribution of Reference training, testing, and validation data gathered from multiple sources either through ground data or through sub-meter to 5-m very high-resolution imagery data (Teluguntla et al., 2023, Thenkabail et al., 2021, Congalton et al., 2017). These data are used in : 1. Training machine learning and other algorithms, 2. Identifying and labeling classes, and
  • 38. Landsat-derived Global Cropland Mapping Methods Sampling for Knowledge generation for Croplands vs. Non-croplands U.S. Geological Survey U.S. Department of Interior
  • 39. Landsat-derived Global Cropland Mapping Methods Knowledge generation for Machine Learning Algorithms to Map Croplands vs. Non-croplands U.S. Geological Survey U.S. Department of Interior
  • 40. Landsat-derived Global Cropland Mapping Methods Croplands vs. Non-croplands Map for an area in Africa using Multiple Machine Learning Algorithms (a) the pixel-based classification from random forest classifier; (b) the object-based RHSeg image segmentation result; (c) the merged results with RHSeg segmentation result with pixel-based Random Forest classification; and (d) a true color Google Earth Imagery for reference. U.S. Geological Survey U.S. Department of Interior
  • 41. Landsat-derived Global Cropland Mapping Methods Knowledge generation for Machine Learning Algorithms to Map Irrigated vs. Rainfed
  • 42. U.S. Geological Survey U.S. Department of Interior Landsat-derived Global Cropland Mapping Methods Unsupervised Machine Learning Algorithm for Irrigated vs. Rainfed croplands Irrigated Classes of Africa: 40 to 21 Classes Grouping classes from the irrigated area mask. All similar classes were grouped together and labeled. Here we illustrate 40 classes reduced to 21 similar classes. 2. Irrigated area classes: Preliminary 40 class signatures 3. Grouping distinct Irrigated area classes together: 40 to 21 classes 1. Irrigated area classes: Preliminary 40 classes
  • 43. U.S. Geological Survey U.S. Department of Interior Landsat-derived Global Cropland Mapping Methods Irrigated Class Identifying and Labelling: Spectral matching Techniques (SMTs) 1. Ideal spectra from reference data 2. Class spectra of similar classes from Isoclass 3. Match Class spectra with ideal spectra 4. Group class spectra and match with ideal spectra Quantitative spectral matching techniques (SMTs): 1. Spectral correlation similarity (SCR) R2: Shape measure. 2. Spectral similarity value (SSV): Shape and Magnitude measure. 3. Modified spectral angle similarity (MSAS): Angle measure (Thenkabail et al., 2007, Teluguntla et al, 2017)
  • 44. U.S. Geological Survey U.S. Department of Interior Landsat-derived Global Cropland Mapping Methods Irrigated Class Identifying and Labelling: Spectral matching Techniques (SMTs) ) 1. Ideal spectra from reference data 2. Class spectra of similar classes from Isoclass 3. Match Class spectra with ideal spectra 4. Group class spectra and match with ideal spectra Classes are grouped, identified, labeled Quantitative spectral matching techniques (SMTs): 1. Spectral correlation similarity (SCR) R2: Shape measure. 2. Spectral similarity value (SSV): Shape and Magnitude measure. 3. Modified spectral angle similarity (MSAS): Angle measure (Thenkabail et al., 2007, Teluguntla et
  • 45. U.S. Geological Survey U.S. Department of Interior Space-time spectral curves (ST SCs): See how the irrigated, rainfed, and other classes move around in 2D space during a calendar year. Landsat-derived Global Cropland Mapping Methods Irrigated versus Rainfed: Space-Time Spiral Curves (ST SCs) Dots indicate Julian dates of a calendar year and how they move around in 2-D space
  • 46. U.S. Geological Survey U.S. Department of Interior Landsat-derived Global Cropland Mapping Methods Irrigated Area Classes for Africa (Level I): 24 Classes Irrigated, single crop is dominant in Africa …………… ……….. But, there is significant irrigated double crop
  • 47. U.S. Geological Survey U.S. Department of Interior Landsat-derived Global Cropland Mapping Methods Rainfed Area Classes for Africa (Level I): 23 Classes Rainfed, single crop is dominant in Africa
  • 48. U.S. Geological Survey U.S. Department of Interior Landsat-derived Global Cropland Mapping Methods Irrigated 5 classes and Rainfed 6 Classes (Level II) Africa rainfed cropland area: 263.5 Mha
  • 49. U.S. Geological Survey U.S. Department of Interior Landsat-derived Global Cropland Mapping Methods Irrigated and Rainfed combined 11 Classes (Level II) rainfed rainfed irrigated irrigated
  • 50. U.S. Geological Survey U.S. Department of Interior Results Global Food Security-support Analysis Data (GFSAD) Products https://www.usgs.gov/apps/croplands/app/map (www.croplands.org) https://lpdaac.usgs.gov/news/release-of-gfsad-30-meter-cropland-extent-products/ https://lpdaac.usgs.gov/news/release-of-lgrip30-data-product/ www.usgs.gov/wgsc/gfsad30
  • 51. Landsat-derived Global Cropland Mapping: Results Landsat-derived Global Cropland Extent at 30m (LGCEP30) for Africa
  • 52. U.S. Geological Survey U.S. Department of Interior Landsat-derived Global Cropland Mapping: Results Landsat-derived Global Rainfed and Irrigated-Cropland Product at 30m (LGRIP30) for Africa rainfed rainfed irrigated irrigated
  • 53. U.S. Geological Survey U.S. Department of Interior Landsat-derived Global Cropland Mapping: Results Landsat-derived Global Cropland Extent at 30m (LGCEP30) for CONUS
  • 54. U.S. Geological Survey U.S. Department of Interior Landsat-derived Global Cropland Mapping: Results Landsat-derived Global Rainfed and Irrigated-Cropland Product at 30m (LGRIP30) for CONUS
  • 55. U.S. Geological Survey U.S. Department of Interior Results: Global Global Food Security-support Analysis Data (GFSAD) Products https://www.usgs.gov/apps/croplands/app/map (www.croplands.org) https://lpdaac.usgs.gov/news/release-of-gfsad-30-meter-cropland-extent-products/ https://lpdaac.usgs.gov/news/release-of-lgrip30-data-product/ www.usgs.gov/wgsc/gfsad30
  • 56. U.S. Geological Survey U.S. Department of Interior Landsat-derived Global Cropland Mapping: Results Landsat-derived Global Cropland Extent at 30m (LGCEP30) Total cropland areas = 1.8 billion hectares
  • 57. U.S. Geological Survey U.S. Department of Interior Landsat-derived Global rainfed & irrigated product @ 30m (LGRIP30) for the nominal year 2015 Landsat-derived Global Cropland Mapping: Results Landsat-derived Global Rainfed and Irrigated-Cropland Product at 30m (LGRIP30) 39% 61% Total cropland areas = 1.8 billion hectares
  • 58. U.S. Geological Survey U.S. Department of Interior Landsat-derived Global Cropland Mapping: Results Landsat-derived Global Rainfed and Irrigated-Cropland Product at 30m (LGRIP30) : State and County-wise Irrigated and Rainfed Area 25% 75% Total cropland Area 168 Mha Irrigated croplands (~25%) Rainfed croplands (~75%)
  • 59. U.S. Geological Survey U.S. Department of Interior Landsat-derived Global rainfed & irrigated product @ 30m (LGRIP30) for the nominal year 2015. Zoom in views of Nebraska, USA. Landsat-derived Global Cropland Mapping: Results Landsat-derived Global Rainfed and Irrigated-Cropland Product at 30m (LGRIP30) : County-wise Irrigated and Rainfed Area: Nebraska
  • 60. U.S. Geological Survey U.S. Department of Interior Landsat-derived Global rainfed & irrigated product @ 30m (LGRIP30) for the nominal year 2015. Zoom in views of California, USA. Landsat-derived Global Cropland Mapping: Results Landsat-derived Global Rainfed and Irrigated-Cropland Product at 30m (LGRIP30) : County-wise Irrigated and Rainfed Area: California
  • 61. U.S. Geological Survey U.S. Department of Interior Landsat-derived Global Cropland Mapping: Results Landsat-derived Global Rainfed and Irrigated-Cropland Product at 30m (LGRIP30) : Causes for Increase in Irrigated Areas of the World 1.Definition of irrigated area: Supplemental irrigation has become a norm. So, these irrigated areas are swiftly increasing when we consider supplemental irrigation. 2. Technological advances in water delivery to agriculture: In much of the world technological advances has created greater and greater irrigation facility. For example, most farmers these days use some form of irrigation either by pumping water directly from rivers or from open wells or from deep acquirer wells. In India, for example, between 1950 and 2010, the number of drilled tube wells increased from 1 million to nearly 30 million (World Bank, 2020). The number of deep tube wells in the country saw surge from 1.46 million to 2.6 million in just between 2006- 07 and 2013-14 (Business Standard, 2017). 3. Equipped area for irrigation: our irrigated areas consider all irrigated areas equipped for irrigation as irrigated areas even when part of those are not irrigated at times (or left fallows). For example, significant pasturehay are included in irrigated areas in few countries. 4. Climate factor: In an increasingly changing climate, purely rainfall dependent agriculture is reducing swiftly. Even when rainfall amount is normal, it’s timeliness in delivery varies. Crops need water in timely manner and when rainfall fails to follow a pattern during the growing season, plants will need water from irrigation and hence supplemental irrigation is greatly increasing, primarily through pumping from open wells, tube-wells, and directly from rivers.
  • 62. U.S. Geological Survey U.S. Department of Interior Landsat-derived Global Cropland Mapping: Results Landsat-derived Global Rainfed and Irrigated-Cropland Product at 30m (LGRIP30) : Causes for Increase in Irrigated Areas of the World The global net irrigated areas (GNIA) reported in our study (715 Mha) is substantially higher compared to previous studies which report GNIA that varied between 307-450 Mha (Puy et al., 2020, Salmon et al., 2015, Siebert et al., 2013, 2001, FAO, 2012b, FAO, 2015, Thenkabail et al. 2012, 2011, 2009a). This is not surprising. Indeed, in a recent study by Puy et al., (2020) of Princeton University in a paper in the Nature Communications suggested that the amount of irrigated land could in fact increase to as high as 1.8 billion hectares by 2050. They suggested in the paper that “Policymakers should acknowledge that irrigated areas can grow much more than previously thought in order to avoid underestimating potential environmental costs”. Puy et al. (2020) clearly demonstrate that the current models underestimate irrigated areas. Rosa et al. (2020) showed that up to 35% of the current rainfed areas have potential for irrigation expansion in a climate change scenario of temperature warming between 1.5-3 degree Celsius. Our results show that this irrigation expansion is already happening at a rapid phase. In an increasingly changing climate, complete dependance on precipitation which has wide variability is becoming unsustainable and some supplemental irrigation in the least is necessary to ensure optimal productivity andor to sustain any productivity at all in rainfed croplands. Further, most of lower irrigated areas reported in the range around 307-450 Mha estimates were for the 2000-2005 period (Salmon et al., 2015, Thenkabail et al., 2011, 2009a). These estimates were 307- 311 Mha for 2000-2008 period (Siebert et al., 2015, FAO, 2012b, Siebert and Döll, 2001, 2010, Siebert at al., 2013), 314 Mha for 2005 by Salmon et al. (2015), and 399 Mha by Thenkabail et al. (2011, 2009a) for nominal 2000.
  • 63. U.S. Geological Survey U.S. Department of Interior Accuracies Global Food Security-support Analysis Data (GFSAD) Products https://www.usgs.gov/apps/croplands/app/map (www.croplands.org) https://lpdaac.usgs.gov/news/release-of-gfsad-30-meter-cropland-extent-products/ https://lpdaac.usgs.gov/news/release-of-lgrip30-data-product/ www.usgs.gov/wgsc/gfsad30
  • 64. Landsat-derived Global Cropland Mapping: Accuracies Landsat-derived Global Cropland Extent at 30m (LGCEP30) Zone-by-Zone Error Matrices U.S. Geological Survey U.S. Department of Interior Reference Data Crop No-Crop Total User Accuracy Map Data Crop 255 48 303 84.16% No-Crop 51 830 881 94.21% Total 306 878 1,184 Producer Accuracy 83.33% 94.53% 91.64% Reference Data Crop No-Crop Total User Accuracy Map Data Crop 140 18 158 88.61% No-Crop 24 67 91 73.63% Total 164 85 249 Producer Accuracy 85.37% 78.82% 83.13% Reference Data Crop No-Crop Total User Accuracy Map Data Crop 43 5 48 89.58% No-Crop 4 198 202 98.02% Total 47 203 250 Producer Accuracy 91.49% 97.54% 96.40%
  • 65. Landsat-derived Global Cropland Mapping: Accuracies Landsat-derived Global Cropland Extent at 30m (LGCEP30) Accuracy Error Matrices: Global For the entire world, the global cropland extent product had an overall accuracy of 91.7%. For the cropland class, the producer’s accuracy was 83.4% (errors of omission of 16.6%) and user’s accuracies of 78.3% (errors of commissions of 21.7%). U.S. Geological Survey U.S. Department of Interior
  • 66. U.S. Geological Survey U.S. Department of Interior Distribution of Reference validation data used accuracy assessments of Landsat- derived Global Rainfed and Irrigated-Cropland Product @ 30-m (LGRIP30). There were 10,477 samples of which 5667 were rainfed and 4810 were irrigated. Landsat-derived Global Cropland Mapping: Accuracies Landsat-derived Global Rainfed and Irrigated-Cropland Product at 30m (LGRIP30) Reference Validation Data: Irrigated versus Rainfed
  • 67. U.S. Geological Survey U.S. Department of Interior Accuracy error matrix of the world.: Global accuracy assessment error matrix showing the overall accuracies, user’s accuracies, and producer’s accuracies. Number of validation samples, N = 10477. Landsat-derived Global Cropland Mapping: Accuracies Landsat-derived Global Rainfed and Irrigated-Cropland Product at 30m (LGRIP30) Accuracy Error Matrices: Global ReferenceData Class Irrigated Rainfed Row total Commission error Irrigated 4171 774 4945 15.7% Rainfed 639 4893 5532 11.6% Column total 4810 5667 10477 Omission error 13.3% 13.7% Producer accuracy 86.7% 86.3% User accuracy 84.3% 88.4% Overall accuracy 86.5%
  • 68. U.S. Geological Survey U.S. Department of Interior Area Statistics Global Food Security-support Analysis Data (GFSAD) Products https://www.usgs.gov/apps/croplands/app/map (www.croplands.org) https://lpdaac.usgs.gov/news/release-of-gfsad-30-meter-cropland-extent-products/ https://lpdaac.usgs.gov/news/release-of-lgrip30-data-product/ www.usgs.gov/wgsc/gfsad30 /
  • 69. What you would like to get out of the summit ● ● Landsat-derived Global Cropland Mapping: Area Results Landsat-derived Global Cropland Extent at 30m (LGCEP30) Cropland Area by Country as % of Total Net Global Cropland Areas U.S. Geological Survey U.S. Department of Interior
  • 70. U.S. Geological Survey U.S. Department of Interior Landsat-derived Global Cropland Mapping: Area Results Landsat-derived Global Rainfed and Irrigated-Cropland Product at 30m (LGRIP30) Irrigated Areas as percentage of the Global Net Irrigated Areas
  • 71. U.S. Geological Survey U.S. Department of Interior Landsat-derived Global Cropland Mapping: Area Results Landsat-derived Global Rainfed and Irrigated-Cropland Product at 30m (LGRIP30) Rainfed Areas as percentage of the Global Net Rainfed Areas
  • 72. U.S. Geological Survey U.S. Department of Interior Landsat-derived Global Cropland Mapping: Area Results Irrigated Area Map of CONUS: County-wise Fresno Merced, Tulare, San Joaquin & Kenn Grant Mississippi
  • 73. U.S. Geological Survey U.S. Department of Interior Landsat-derived Global Cropland Mapping: Area Results Rainfed Area of CONUS: County-wise Rainfed Area Chouteau & Hill Cass, Stutsman & Ward Whitman county
  • 74. U.S. Geological Survey U.S. Department of Interior Landsat-derived Global Cropland Mapping: Area Results Total (Irrigated and Rainfed) cropland area Map of CONUS: County-wise
  • 75. U.S. Geological Survey U.S. Department of Interior Way Forward Global Food Security-support Analysis Data (GFSAD) Products https://www.usgs.gov/apps/croplands/app/map (www.croplands.org) https://lpdaac.usgs.gov/news/release-of-gfsad-30-meter-cropland-extent-products/ https://lpdaac.usgs.gov/news/release-of-lgrip30-data-product/ www.usgs.gov/wgsc/gfsad30 /
  • 76. U.S. Geological Survey U.S. Department of Interior Landsat-derived Global Cropland Mapping: Level I, Detailed Mapping Telangana State, India: Irrigated Areas, Level I 37 classes
  • 77. U.S. Geological Survey U.S. Department of Interior Landsat-derived Global Cropland Mapping: Level I, Class Signatures Telangana State, India: Irrigated, Level I, 37 Class Signatures
  • 78. U.S. Geological Survey U.S. Department of Interior Landsat-derived Global Cropland Mapping: Level I, Detailed Mapping Telangana State, India: Rainfed Areas, Level I, 22 classes
  • 79. U.S. Geological Survey U.S. Department of Interior Landsat-derived Global Cropland Mapping: Level II, Aggregated Classes Telangana State, India: Rainfed and Irrigated (LGRIP30-Telangana), Level II, 6 classes
  • 80. U.S. Geological Survey U.S. Department of Interior Landsat-derived Global Cropland Mapping: Level III, Aggregated Classes Telangana State, India: Rainfed and Irrigated (LGRIP30-Telangana), Level III, 2 classes
  • 81. U.S. Geological Survey U.S. Department of Interior Landsat-derived Global Cropland Mapping: Level III, Aggregated Classes Telangana State, India: Rainfed and Irrigated (LGRIP30-Telangana), Level III, 2 classes Accuracies: Irrigated area class Producer accuracy: 92.9% (Errors of Omissions: 7.1%) User accuracy: 98.5% (Errors of Commissions: 1.5%)
  • 82. U.S. Geological Survey U.S. Department of Interior Impact Global Food Security-support Analysis Data (GFSAD) Products https://www.usgs.gov/apps/croplands/app/map (www.croplands.org) https://lpdaac.usgs.gov/news/release-of-gfsad-30-meter-cropland-extent-products/ https://lpdaac.usgs.gov/news/release-of-lgrip30-data-product/ www.usgs.gov/wgsc/gfsad30
  • 83. U.S. Geological Survey U.S. Department of Interior Landsat-derived Global Cropland Mapping: Impact Monthly Data Users and Downloads: 126 Countries Have used GFSAD Data Oliphant, A., Thenkabail, P.S., and Teluguntla, P., 2022. Global Food Security-support Analysis Data at 30 meters (GFSAD30) Cropland Product: Impact Analysis November 2017 through December 2019. Open File Report, United States Geological Survey. IP- 119165. GFSAD data from NASA’s LP DAAC. 2018-2021, 126 countries, 2022 72 countries 2021 96 countries 2023 Every month about 20 countries use our data
  • 84. U.S. Geological Survey U.S. Department of Interior Global Croplands for Food and Water Security in the Twenty-first Century DATA AccessDissemination Peer-reviewed Manuscripts USGS Professional Paper: Thenkabail, P.S., Teluguntla, P.G., Xiong, J., Oliphant, A., Congalton, R.G., Ozdogan, M., Gumma, M.K., Tilton, J.C., Giri, C., Milesi, C., Phalke, A., Massey, R., Yadav, K., Sankey, T., Zhong, Y., Aneece, I., and Foley, D., 2021, Global cropland-extent product at 30-m resolution (GCEP30) derived from Landsat satellite time-series data for the year 2015 using multiple machine-learning algorithms on Google Earth Engine cloud: U.S. Geological Survey Professional Paper 1868, 63 p., https://doi.org/10.3133/pp1868. https://lpdaac.usgs.gov/news/release-of- gfsad-30-meter-cropland-extent-products/ IP-119164. For 12 other related publications, go to “Publications” section in: www.usgs.gov/wgsc/gfsad30 Note: From 2017-present: these papers have over 2000 citations
  • 85. U.S. Geological Survey U.S. Department of Interior Dissemination Global Food Security-support Analysis Data (GFSAD) Products https://www.usgs.gov/apps/croplands/app/map (www.croplands.org) https://lpdaac.usgs.gov/news/release-of-gfsad-30-meter-cropland-extent-products/ https://lpdaac.usgs.gov/news/release-of-lgrip30-data-product/ www.usgs.gov/wgsc/gfsad30
  • 86. What you would like to get out of the summit ● ● 1. GFSAD Web Sites: www.usgs.gov/wgsc/gfsad30 2. Data Download from LP DAAC: 30m Products: https://lpdaac.usgs.gov/news/release-of-gfsad-30-meter-cropland-extent-products/ https://lpdaac.usgs.gov/news/release-of-lgrip30-data-product/ https://lpdaac.usgs.gov/products/lgrip30v001/ 1Km products: https://lpdaac.usgs.gov/products/gfsad1kcdv001/ https://lpdaac.usgs.gov/products/gfsad1kcmv001/ 3. Browse and View www.croplands.org Landsat-derived Global Cropland Mapping