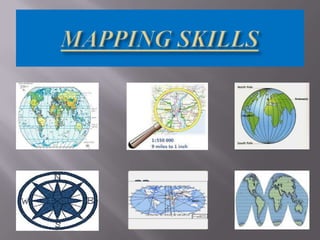
The Mapping Skills
•
5 likes•8,051 views

This presentation will help our young geographers who are on the verge of understanding geographical skills and how do different maps help them to understand different features of the Earth and the area where they live.

Recommended
More Related Content
What's hot
What's hot (20)
Viewers also liked
Viewers also liked (20)
Similar to The Mapping Skills
Similar to The Mapping Skills (20)
More from Wajeeha Ahmed
Recently uploaded
Recently uploaded (20)
The Mapping Skills
- 2. Maps are visual representations of the Earth’s surface as seen vertically from above. Maps show how things on the Earth’s surface are related to one another in terms of distance, direction and size. With the invention of printing in the 15th century, maps became widely available. The first world map came about in the 16th century following the voyages of Christopher Columbus and other explorers.
- 3. People have been using maps for a long time. The Ancient Egyptians used maps that were drawn based on descriptions which travelers gave. In ancient China, maps were used to plan battles. Maps were used for the very purposes that they are used today.
- 4. •A map provides information such as where a place is in relation to another. For example, the city you live in is north of a river. •The distance from the city to the river can be estimated from the scale given on the map. •With such information, you will be able to find your way around the city.
- 5. In planning the development of a city, the planners use a base map to show where to build a factory, road, school or houses. In emergency, a map comes in useful in planning a rescue operation.
- 7. These maps show the individual countries, each separated by a national boundary. The capital cities and major cities are usually shown.
- 9. Administrative/Road maps show the roads, highways, railroad tracks and points of interest of a place. These maps are used by people to find their way around a town, city or country.
- 11. Resource/Economic maps show the different types of natural resources or economic activities that are found in an area. Symbols are used to show the resource or the economic activity.
- 13. A typical physical map shows the physical features such as mountains, plains and rivers. Different colors are used to show land of different heights.
- 15. Thematic /Climate maps have specific themes. For example, climatic maps give information about the temperature, rainfall and atmospheric pressure of a place, a country, a region or the world. Different colors are used to show the different temperature range.
- 17. Topographical maps show the physical features of a place. Unlike in the physical maps, the physical features are shown in greater detail. Details such as the shape and height of each feature are shown with the help of contour lines. Human features such as buildings, roads and farms are show using symbols.
- 19. ELEMENTS OF MAPS There are six basic elements of maps
- 20. It tells us what the map shows POLITICAL MAP
- 21. Shows where north lies on the map
- 22. Tell us the names of features, buildings, roads and reservoirs.
- 23. A pattern of lines on a chart or map which helps determine absolute location. Also called vertical easting and horizontal northing
- 24. Map Scale- The proportional relationship between a linear measurement on a map and the distance it represents on the Earth's surface.
- 25. A key to what the symbols or pictures in a map mean.. It represent the physical and human features on the actual surface of the Earth.
- 27. • • A compass is used for showing Direction. A magnetic needle swings around until it is pointing north. It is most useful to the people travelling through areas without other features to guide them where to go. The points of compass are called cardinal points HOW TO FIND A DIRECTION? The sun shines from south upon places in the northern hemisphere. Everyday the sun rises in the East and sets in the West everywhere in the world. 1. Identify the points halfway between the cardinal points North East South East South West North West 2. Identify the remaining 8 cardinal points
- 28. They are used to represent the different physical and human features found on the Earth’s surface. By using symbols map makers are able to fit in a lot of information on a map. There are certain standard colours or shapes that are used in symbols. For example, blue is used to represent water or water features such as streams and lakes, and green is used for vegetation
- 29. 1. LINE SYMBOLS Represent line features such as roads, paths, rivers or railway tracks. The line symbols resemble the actual features they represent. A road is usually wider than a path. ROAD PATH A thicker blue line represent river A less thick blue line represent stream RIVER STREAM -------------
- 30. They represent features such as schools, masjid, hospitals or buildings. BUILDINGS MONUMENT 3. AREA SYMBOL They are used for features that cover an area such as lakes and farms. Different colors are used to keep the color of the symbols as possible to the real features CULTIVATION LAKE
- 31. The height of places on map is shown by contour lines, which are imaginary lines that join places of the same height To show the exact height of a spot, a trigonometrically station is used. TRIGONOMETRICAL STATION 100 50
- 32. The features on the surface of the Earth are usually large and the actual size cannot be shown on a map. The features and the area to be mapped is therefore drawn to scale. A scale can be shown in three ways: IN WORDS: The scale is started, for example, 1cm to 1km. That means 1cm on the map is 1km on the ground AS A RATIO: A ratio such as 1:1000,000 means 1cm on the mp represents 100,000 cm or 1km on the ground. AS A LINE: A line is divided into units, each representing a certain distance, 1 cm represents 50,000 cm on the ground. 0 1 km
- 33. MAPS USES OF MAPS -valuable sources of information -bases for planning and decision making TYPES OF MAPS -Political -Thematic -Economic -Physical -Road -Topographical FEATURES ON A MAP -Tiltle -Names of features -North Arrows -Grid Lines - Scale - Key or legend READING A MAP -Location • four-figured grid •Six-figure grid reference -Direction • Cardinal points -Distance •Scale • measure • straight line distance •Curved distance -Height • contours •Features •Mountains •Hill •Plateau •Ridge •Valley •Plain -Key/ Legend •Symbols • line •Point •Area •height
- 34. Q1. What are maps? Q2. What are the uses of maps? Q3. What do you know about political and climate map? Q4. What is an economic map? Q5. What is a road map? Q6. What does Physical map show? Q7. What is a Topographical map? Q8. What are the elements of map? Q9. Why do we use symbol on maps? Q10. Define •Line symbol •Point symbol •Area symbol •Height symbol
- 35. Q11. What does a scale show on the map? Q12. In how many ways a scale can be shown on the map? Q13. How can we show height on a map?