Demand supply & equilibrium price
•Download as PPT, PDF•
18 likes•13,686 views

given by my eco teacher that can help us a lot !!!! thank you shaju sir

Recommended
More Related Content
What's hot
What's hot (20)
Viewers also liked
Viewers also liked (15)
Similar to Demand supply & equilibrium price
Similar to Demand supply & equilibrium price (20)
Recently uploaded
Recently uploaded (20)
Demand supply & equilibrium price
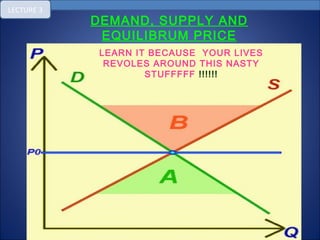
- 1. LECTURE 3 DEMAND, SUPPLY AND EQUILIBRUM PRICE LEARN IT BECAUSE YOUR LIVES REVOLES AROUND THIS NASTY STUFFFFF !!!!!!
- 2. ©Natalya Brown 2010 ECON 1007 Introduction to Economics II Demand, Supply and Market Equilibrium IGCSE : Economics (0455)
- 3. ©Natalya Brown 2008 LECTURE 3 Demand, Supply and Market Equilibrium Overview • Demand & Supply • Shifts in a Demand/Supply Curve and Movements Along a Demand/Supply Curve. • Market Equilibrium • The Four “laws” of Demand and Supply • Effect of a Sales Tax • Elasticities of Demand and Supply
- 4. ©Natalya Brown 2008 LECTURE 3 Demand, Supply and Market Equilibrium Quantity Demanded • Quantity demanded is the total amount of any good or service that consumers wish to purchase in some time period at a particular price. • The total amount consumers wish to purchase may differ from what is actually purchased. • Quantity demanded is an example of a flow variable.
- 5. ©Natalya Brown 2008 LECTURE 3 Demand, Supply and Market Equilibrium Demand • Demand is the quantity of a good or service that buyers wish to purchase at each given price. • Note the distinction between demand and quantity demanded. Demand describes the behaviour of buyers at every price, where as quantity demanded describes behaviour at a particular price.
- 6. ©Natalya Brown 2008 LECTURE 3 Demand, Supply and Market Equilibrium Quantity Demanded and Price • The Law of Demand: the basic hypothesis is that — other things being equal — the price of a product and the quantity demanded are negatively related. That is, the lower the price, the higher the quantity demanded and vice versa. • This relationship between price and quantity demanded is true for most goods in the economy.
- 7. LECTURE 3 Demand Curve and Demand Schedule Price ($) Quantity Demanded 800 200 1200 160 1600 120 1800 100 2000 80 2200 60 2400 40 2800 0 Monthly Demand of Sony VAIO Laptops in Noida, UP, India. Demand Schedule Price Quantity Demanded 2800 2400 2000 1600 1200 800 400 40 60 80 100 120 140 160 180 200 Demand Curve
- 8. LECTURE 3 Graphing Linear Demand Curves Notice that price is on the y-axis and quantity on the x-axis. Quantity Price QD = 100 - 2p 10 20 30 40 50 60 70 80 90 100 110 50 40 30 20 10 0 Sometimes it is easier to use the inverse demand curve – price as a function of quantity demanded. 2p = 100 – QD p = 50 – (1/2)QD p= 50, QD = 0 p= 0, QD =100 The same method can be used for linear supply curves.
- 9. ©Natalya Brown 2008 LECTURE 3 Demand, Supply and Market Equilibrium Changes in Demand • Demand curves are drawn assuming that all factors affecting demand for a commodity other than the price of the commodity are held constant. If these other factors change, then we get a shift of the demand curve, called “a change in demand”. • Other factors: – Consumer incomes and distribution of income – Tastes and Networks – The prices of related goods – Expectations about the future – Population and Demographic changes.
- 10. LECTURE 3 A rightward shift in the demand curve from D0 to D1 indicates an increase in demand. 0 Quantity Demanded Price D2 D0 D1 A leftward shift from D0 to D2 indicates a decrease in demand.
- 11. LECTURE 3 A change in demand is a change in quantity demanded at every price. That is, a change in demand is a shift of the entire demand curve. A change in quantity demanded refers to a movement from one point on a demand curve to another point, either on the same demand curve or on a new one. p3 p2 p0 q3 q0 q2 q1 D1 D0 Quantity Price Change in quantity demanded Change in demand
- 12. ©Natalya Brown 2008 LECTURE 3 Demand, Supply and Market Equilibrium Quantity Supplied • Quantity supplied is the total amount of any good or service that producers wish to sell in some time period at a particular price. • The total amount producers wish to sell may differ from what is actually sold. • Quantity supplied is also an example of a flow variable.
- 13. ©Natalya Brown 2008 LECTURE 3 Demand, Supply and Market Equilibrium Supply • Supply is the quantity of a good or service that producers wish to sell at each given price. • The distinction between supply and quantity supplied is the same as the distinction between demand and quantity demanded. • The Law of Supply: the basic hypothesis is that — other things being equal — the price of a product and the quantity supplied are positively related. That is, the higher the price, the higher the quantity supplied.
- 14. LECTURE 3 Supply Curve and Supply Schedule Price ($) Quantity Supplied 800 0 1200 0 1600 40 1800 60 2000 80 2200 100 2400 120 2800 160 Monthly Supply of VAIO Laptops in Noida, UP, India by SONY Supply Schedule Price Quantity Supplied 2800 2400 2000 1600 1200 800 400 40 60 80 100 120 140 160 180 200 Supply Curve
- 15. ©Natalya Brown 2008 LECTURE 3 Demand, Supply and Market Equilibrium Changes in Supply • Supply curves are drawn assuming that all factors affecting the supply of a commodity other than the price of the commodity are held constant. If these other factors change, then we get a shift of the supply curve, called “a change in supply”. • Other factors: – Technology – Input costs – Competing Products – Number of Suppliers – Expectations about the future
- 16. LECTURE 3 A change in supply is a change in quantity supplied at every price. That is, a change in supply is a shift of the entire supply curve. A change in quantity supplied refers to a movement from one point on a supply curve to another point, either on the same supply curve or on a new one.
- 17. ©Natalya Brown 2008 LECTURE 3 Demand, Supply and Market Equilibrium Market Equilibrium • market is a set of arrangements where by buyers and sellers exchange goods and services at various prices. • The equilibrium price clears the market, so it is sometimes called the market-clearing price because at this price what the producer wants to sell is exactly matched with what consumer wants to buy. It is the price at which the quantity demanded equals the quantity supplied. • Excess Supply: this exists when the quantity supplied exceeds the quantity demanded at the current price. • Excess Demand: this exists when the quantity demanded exceeds the quantity supplied at the current price.
- 18. LECTURE 3 Market Equilibrium Price ($) Qty. Demanded Qty. Supplied 800 200 0 1200 160 0 1600 120 40 1800 100 60 2000 80 80 2200 60 100 2400 40 120 2800 0 160 The Market for VAIO Laptops in Noida, UP, India. Price Quantity 2800 2400 2000 1600 1200 800 400 40 60 80 100 120 140 160 180 200 Demand Curve Supply Curve Excess Supply Excess Demand
- 19. LECTURE 3 Changes in Market Prices There are four “laws” of supply and demand. 1. An increase in demand causes an increase in both the equilibrium price and equilibrium quantity. S Price D1D0 • • q0 q1 p1 p0 Quantity 2. A decrease in demand causes a decrease in both equilibrium price and equilibrium quantity. E1 E0
- 20. LECTURE 3 3. An increase in supply causes a decrease in the equilibrium price and an increase in the equilibrium quantity. 4. A decrease in supply causes an increase in the equilibrium price and a decrease in the equilibrium quantity. S1 Price S0 D • q1q0 p0 p1 Quantity • E1 E0
- 21. LECTURE 3 Exercise 1 • Suppose that the demand function for some product is given by: And that the supply function for some product is given by: QD = 100 - 4p QS = p
- 22. LECTURE 3 Equilibrium: QD = QS Price Quantity 10 20 30 40 10 20 30 40 50 60 70 80 100 QS = p QD = 100 - 4p Graphically:
- 23. LECTURE 3 Numerically, QD = QS implies that 100 – 4p = p 100 = 5p p* = 20 Q* = p* = 20 or Q* = 100 – 4p* = 20
- 24. ©Natalya Brown 2008 LECTURE 3 Demand, Supply and Market Equilibrium Effect of a Sales Tax • After the imposition of a sales tax, the price paid by consumers is higher, whereas the price received by producers is lower. The new equilibrium quantity is less than the quantity before the tax was imposed. • Let pc denote the price paid by consumers, and ps denote the price received by suppliers. • The difference between the consumer and seller prices is equal to the tax (i.e. tax = pc – ps). • The effect of sales tax on equilibrium price and quantity is the same regardless of whether it is levied on producers or consumers.
- 25. LECTURE 3 Quantity S0 D0 Dtax ps p pc tax Quantity S0 D0 ps p pc Stax tax In this case, the tax is levied on consumers and the demand decreases. In this case, the tax is levied on producers and the supply decreases. tax = pc – ps q1 q0 q1 q0
- 26. LECTURE 3 Price Elasticity of Demand • Price elasticity of demand measures the degree of responsiveness of quantity demanded to a good by the consumer in response to a change in the price of that good. It is symbolized by the Greek letter eta: η.. η percentage change in quantity demanded percentage change in price =
- 27. LECTURE 3 • Since demand curves have negative slopes, price and quantity demanded move in opposite directions along the demand curve. • Because the changes in price and quantity have opposite signs, demand elasticity is negative. • However, economists usually ignore the negative sign and speak of the measure as a positive number — that is, they emphasize the absolute value.
- 28. LECTURE 3 Determinants of Price Elasticity of Demand • Availability of close substitutes: goods with close substitutes tend to have more elastic demand because it is easier for consumers to switch from that good to others. • Necessities vs. Luxuries: necessities tend to have inelastic demands whereas luxuries have elastic demands. • Definition of the Market: narrowly-defined markets tend to have more elastic demand than broadly-defined markets because it is easier to find close substitutes for narrowly-defined goods. • Time Horizon: goods tend to have more elastic demand over longer time horizons.
- 29. LECTURE 3 Exercise 2 • If the price of a commodity increases by 3% and quantity demanded decreases by 6%, then the price elasticity of demand is 2. • If the price elasticity of demand for a commodity is 0.5, a 10% decrease in price leads to a 5% increase in quantity demanded. η = % change in QD % change in P = 6% = 2 3% η = 0.5 = % change in QD % change in P = 5% = 0.5 10%
- 30. LECTURE 3 Elastic: If the percentage change in quantity demanded is greater than the percentage change in price, then demand is elastic and η > 1. Unit Elastic: If the percentage change in quantity demanded is equal to the percentage change in price, then demand is unit elastic and η = 1. Inelastic: If the percentage change in quantity demanded is less than the percentage change in price, then demand is inelastic and 0 < η < 1. η = ∞η = 0 η = 1
- 31. LECTURE 3 Price Elasticity of Supply • Price elasticity of supply measures the degree of responsiveness of the quantity supplied to a change in the product’s own price. It is denoted by ηs, and is defined as: ηS = percentage change in quantity supplied percentage change in price
- 32. LECTURE 3 Determinants of Price Elasticity of Supply • The price elasticity of supply will depend on the flexibility of sellers to change the amount of the good they produce. • Technical ease of substitution in production: if it is easy for firms to switch inputs from the production of one good to another, then supply will be more elastic. • Time horizon: supply is usually more elastic in the long run than in the short run • The nature of production costs: if production costs rise sharply as firms’ output increases, then supply will tend to be inelastic.
- 33. LECTURE 3 Income Elasticity of Demand • The income elasticity of demand measures the degree of responsiveness of quantity demanded to a change in income. • Normal goods: Higher the income higher will be the quantity demanded. • Inferior goods: Higher income lowers the quantity demanded. ηY = percentage change in quantity demanded percentage change in income ηY > 0 ηY < 0 Sign Matters
- 34. LECTURE 3 The more necessary an item is in the consumption pattern of consumers, the lower its income elasticity. Income elasticities for any one product also vary with the level of a consumer’s income. The distinction between luxuries and necessities also helps to explain differences in income elasticities between countries. Determinants of Income Elasticity of Demand
- 35. LECTURE 3 Cross-Price Elasticity of Demand • The cross-price elasticity of demand measures how the quantity demanded of one good changes as the price of another good changes. ηXY = percentage change in quantity demanded of good X percentage change in price of good Y Substitutes are goods that are typically used in place of one another (e.g. margarine and butter). Complements are goods that are typically used together (such as computers and software). If ηXY > 0, then X and Y are substitutes. (+ value) If ηXY < 0, then X and Y are complements.(- value) Sign Matters
- 36. LECTURE 3 Elasticity of formula in alternative forms A. Elasticity of demand Δ Q P where ηd = demand elasticity ηd = ------ . --- Δ Q = change in quantity demanded Δ P Q Δ P = change in price P = original price Q= original quantity demanded B. Elasticity of Supply Δ Q P where ηs = supply elasticity ηs = ------ . --- Δ Q = change in quantity demanded Δ P Q Δ P = change in price P = original price Q= original quantity demanded
- 37. LECTURE 3 INCOME ELASTICITY Δ Q Y where ηY = income elasticity ηY = ------ . --- Δ Q = change in Quantity Δ Y Q Δ Y= change in income Y = original income Q= original quantity CROSS PRICE ELASTICITY ΔQx Py where ηC = cross elasticity ηC = -------- . ---- Δ Qx = change in Quantity of X ΔPy Qx Δ Py= change in price of Y Py = original price of Y Qx= original quantity of X
- 38. LECTURE 3 Exercises: Price Quantity demanded/month Revenue $1.60 4000 $1.20 8000 $0.80 12000 1.Calculate total revenue at each price. 2.If a product has a price elasticity of 1.3, what would happen to total revenue if the price decreased? 3.Price Quantity Revenue Find the dollar value of total revenue at $ 6 0 each of the six prices. At what price will $ 5 1 total revenue be the greatest? How many $ 4 2 will sell at that price? $ 3 3 $ 2 4 $ 1 5
- 39. LECTURE 3 5. When price of a product rises from £60 to £90, demand contracts from 800 to 600. Calculate Ed, what type of Ed is this? 6. A consumer buys 80 units of a good at a price of $4 per unit. When the price falls he buys 100 units. If price elasticity of demand is -1, find out the new price. Elasticity of demand and expenditure on the product 1. Price of a product falls, but expenditure on the product by the consumer falls! What idea do you get about the elasticity of demand of that product? 2. Price of a product falls, but expenditure on the product rises! What sort of elasticity does the product have? 3. Price of the product rises, expenditure rises too! ηd=…………. 4. Price of the product rises, expenditure fall, ηd=………….
- 40. LECTURE 3