Downloaded 301 times

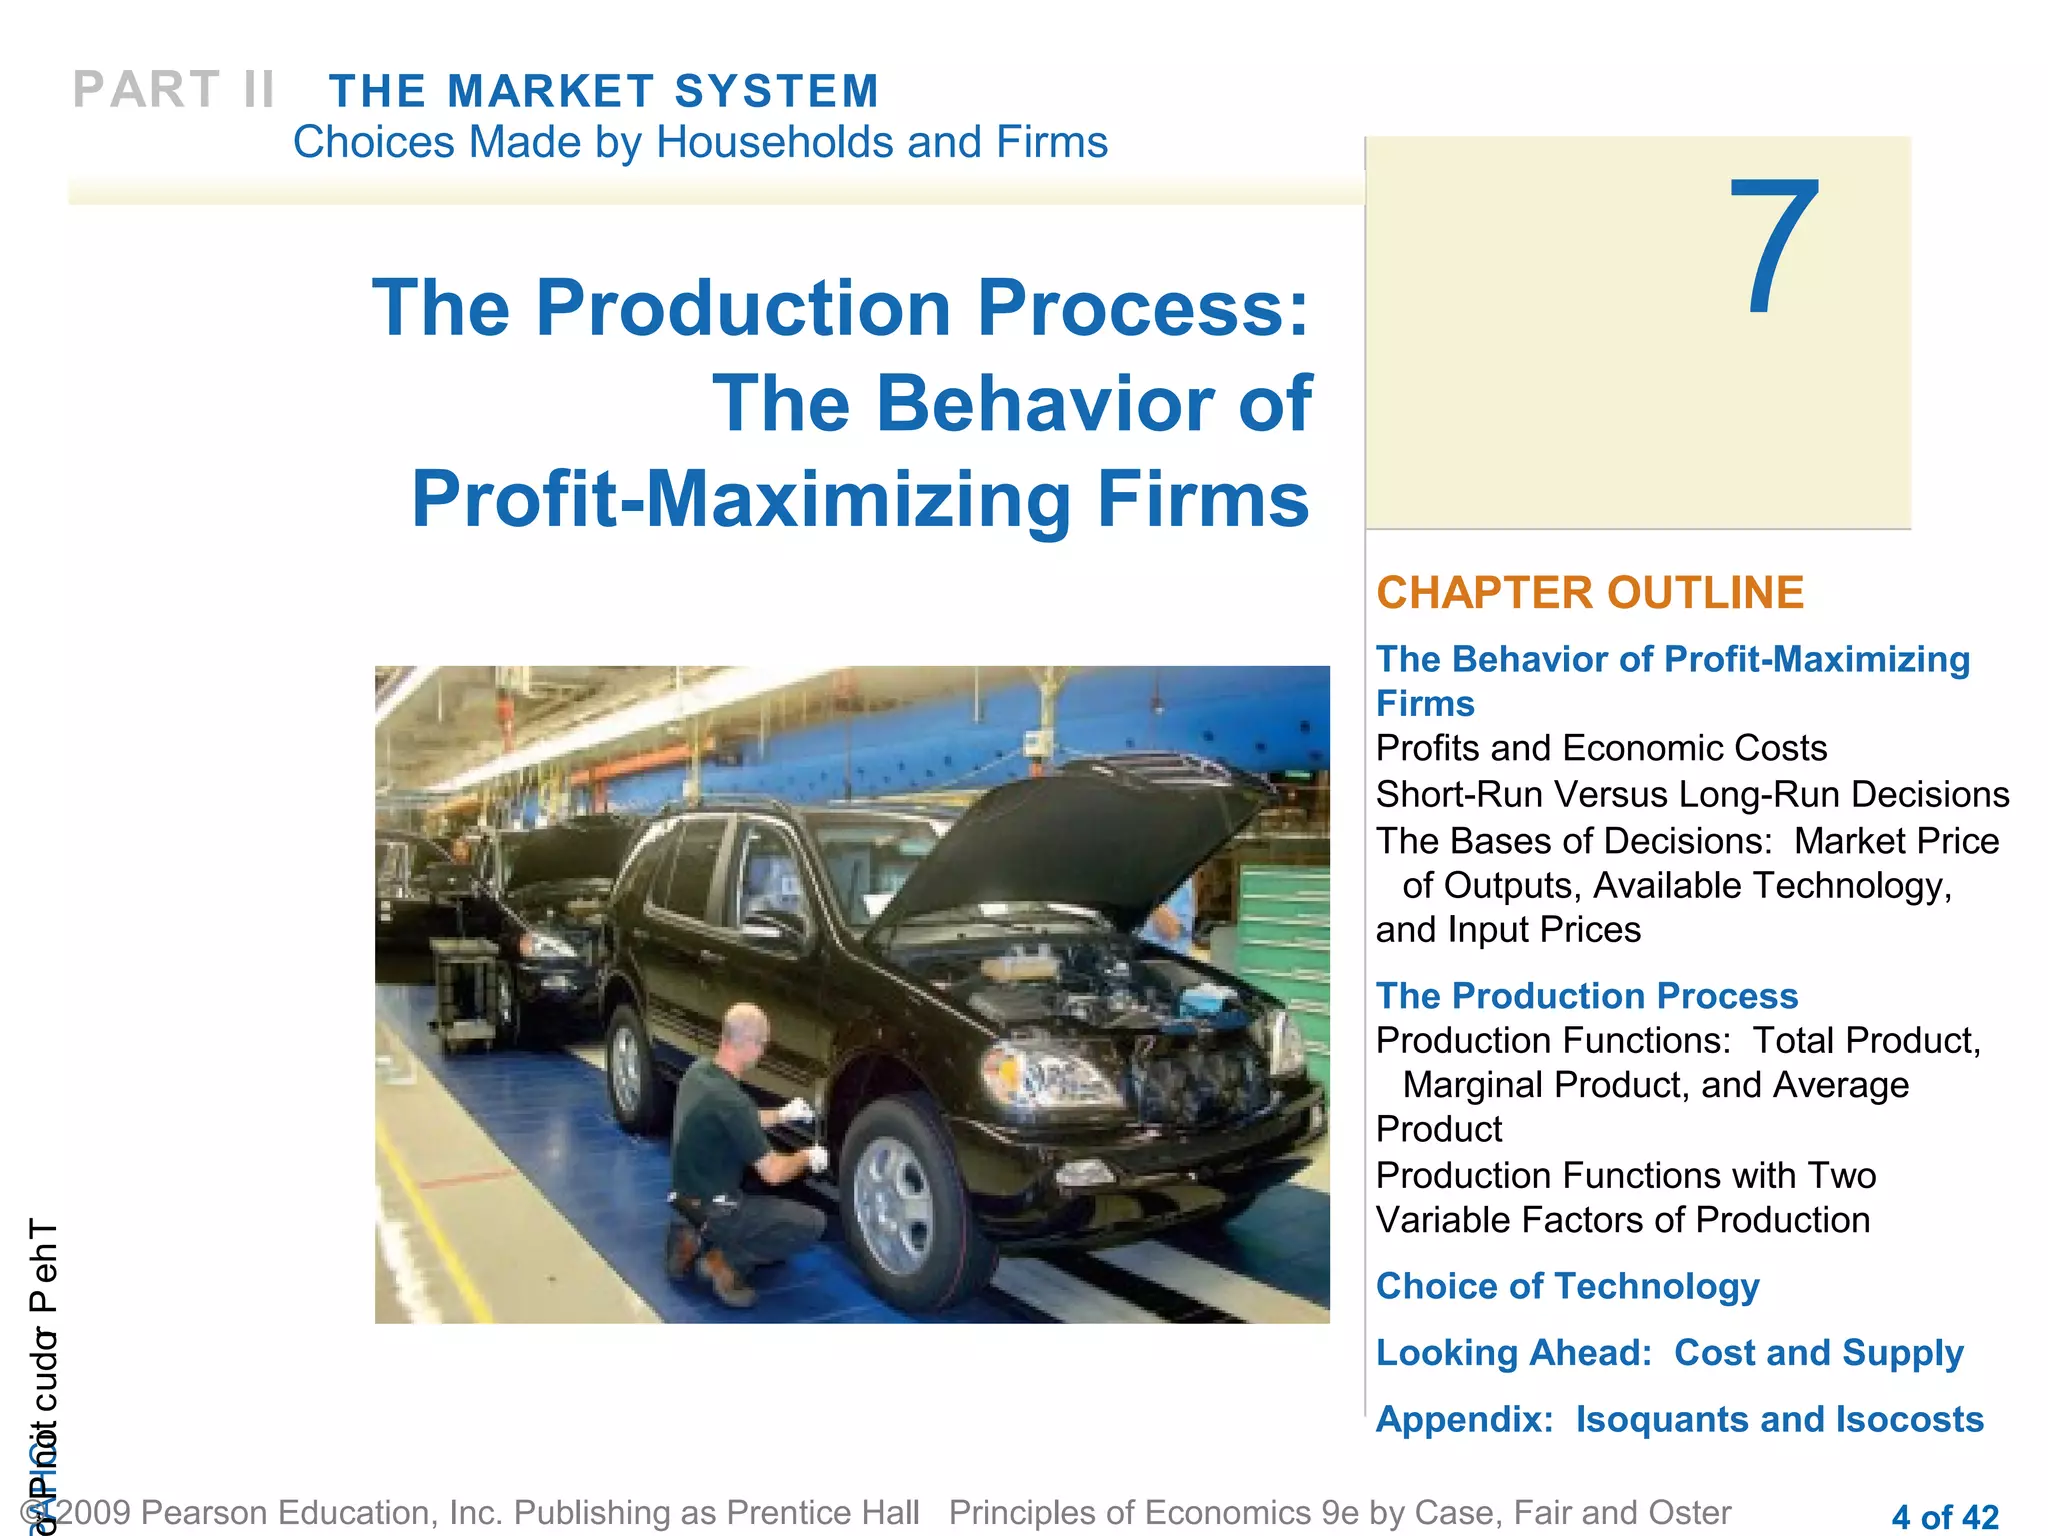
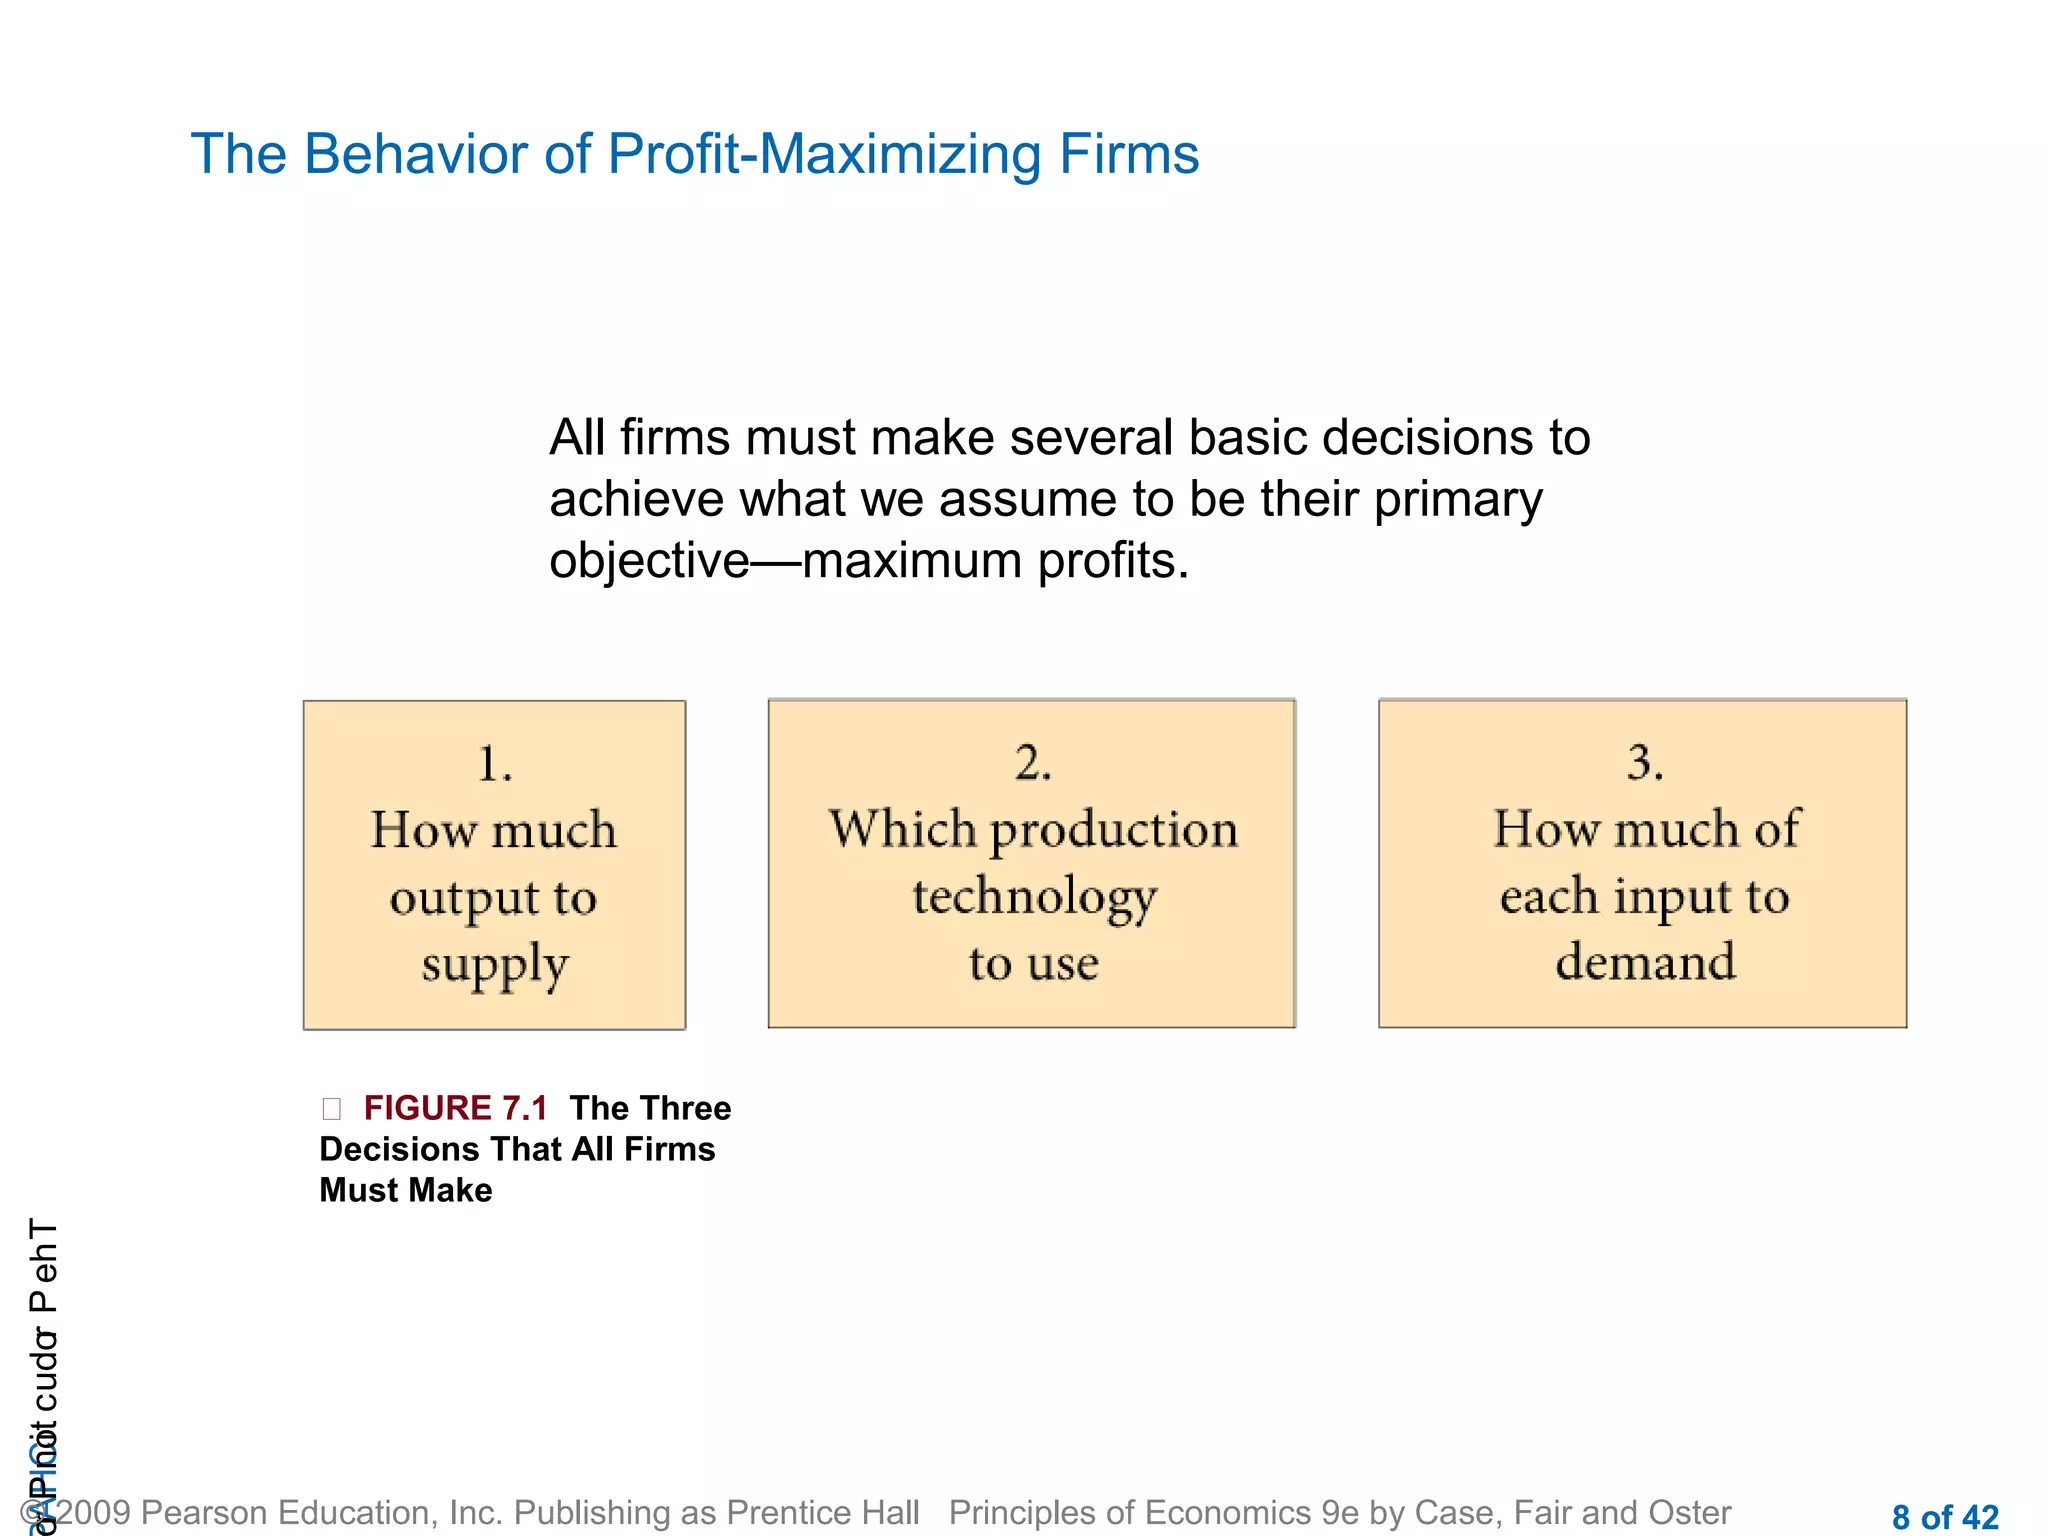
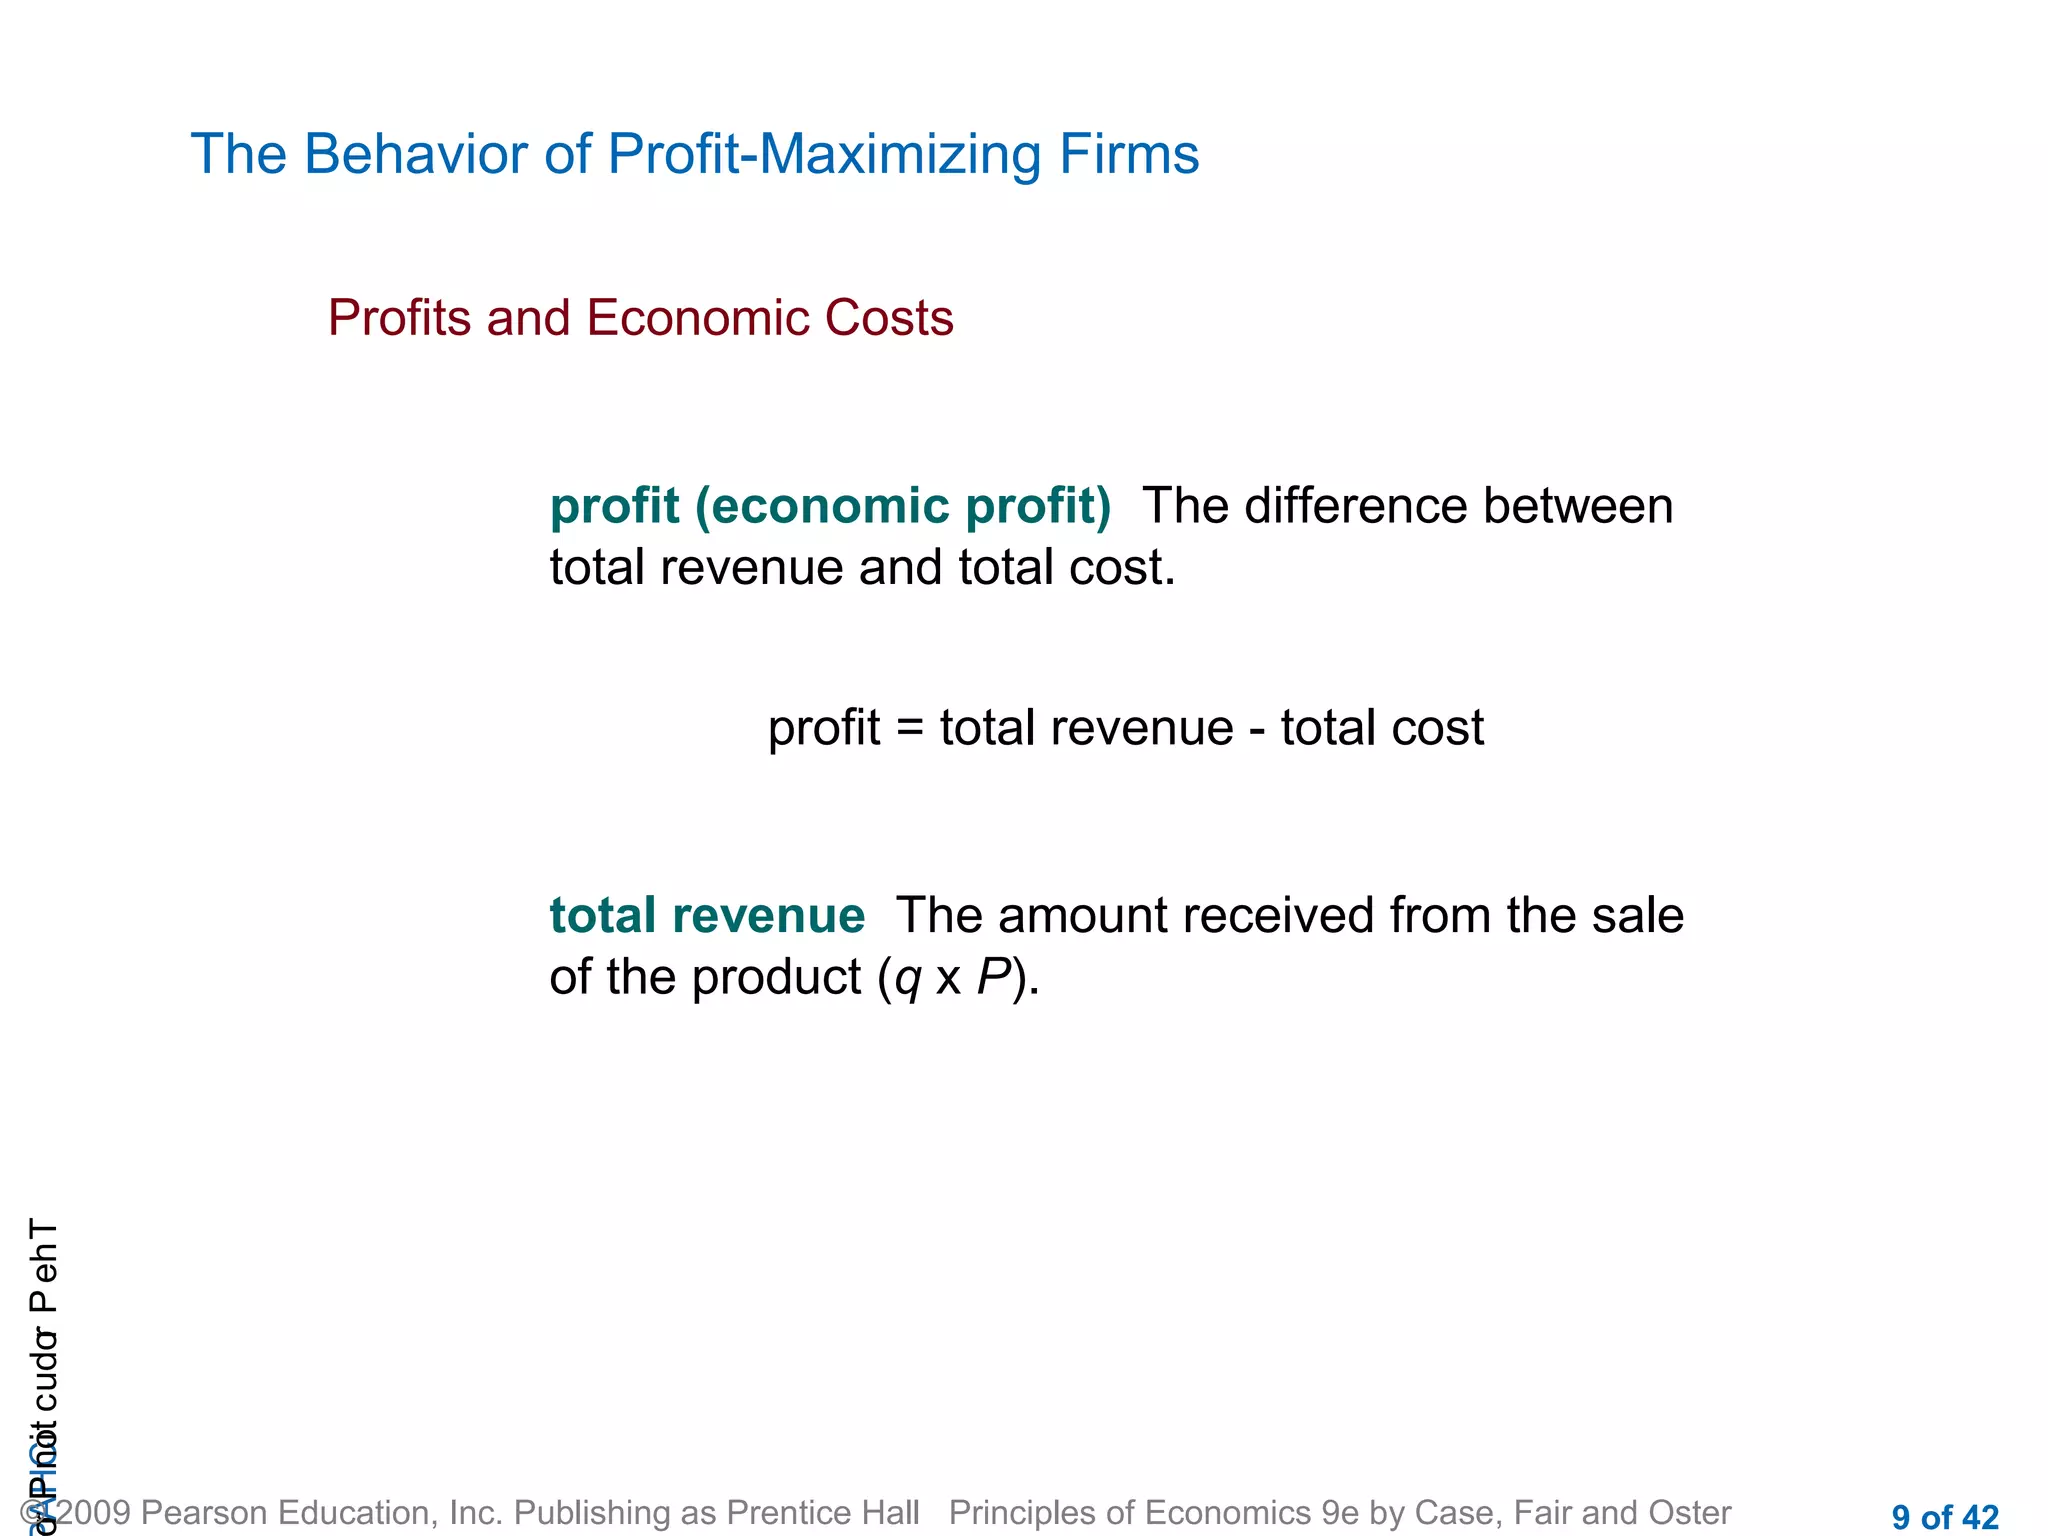
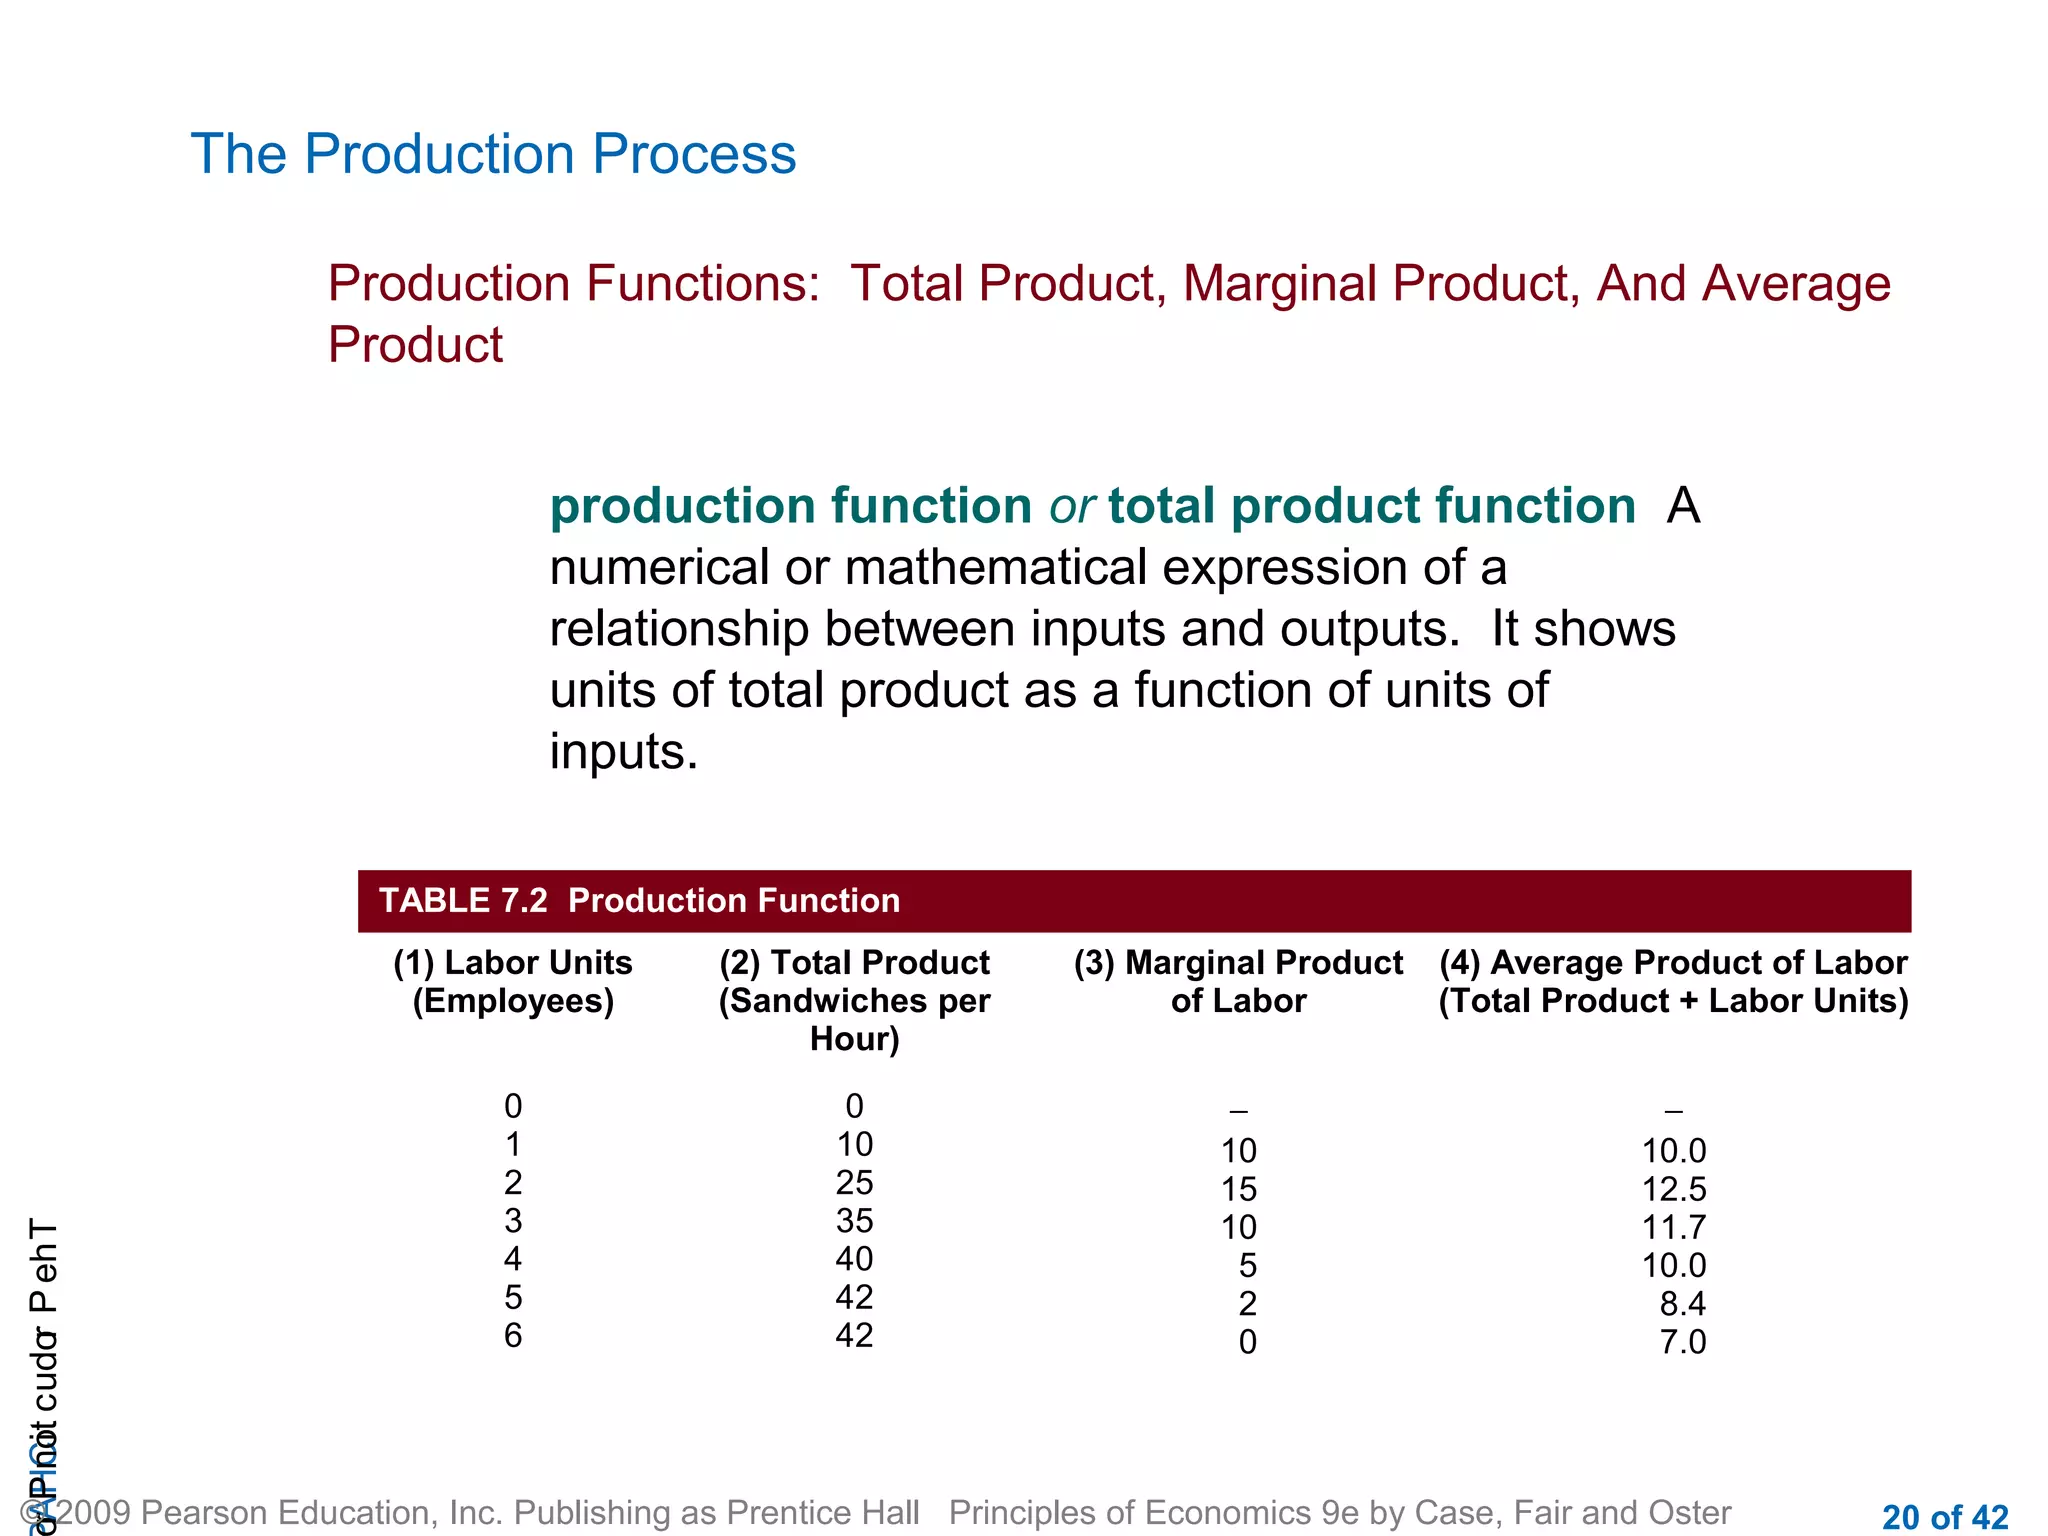
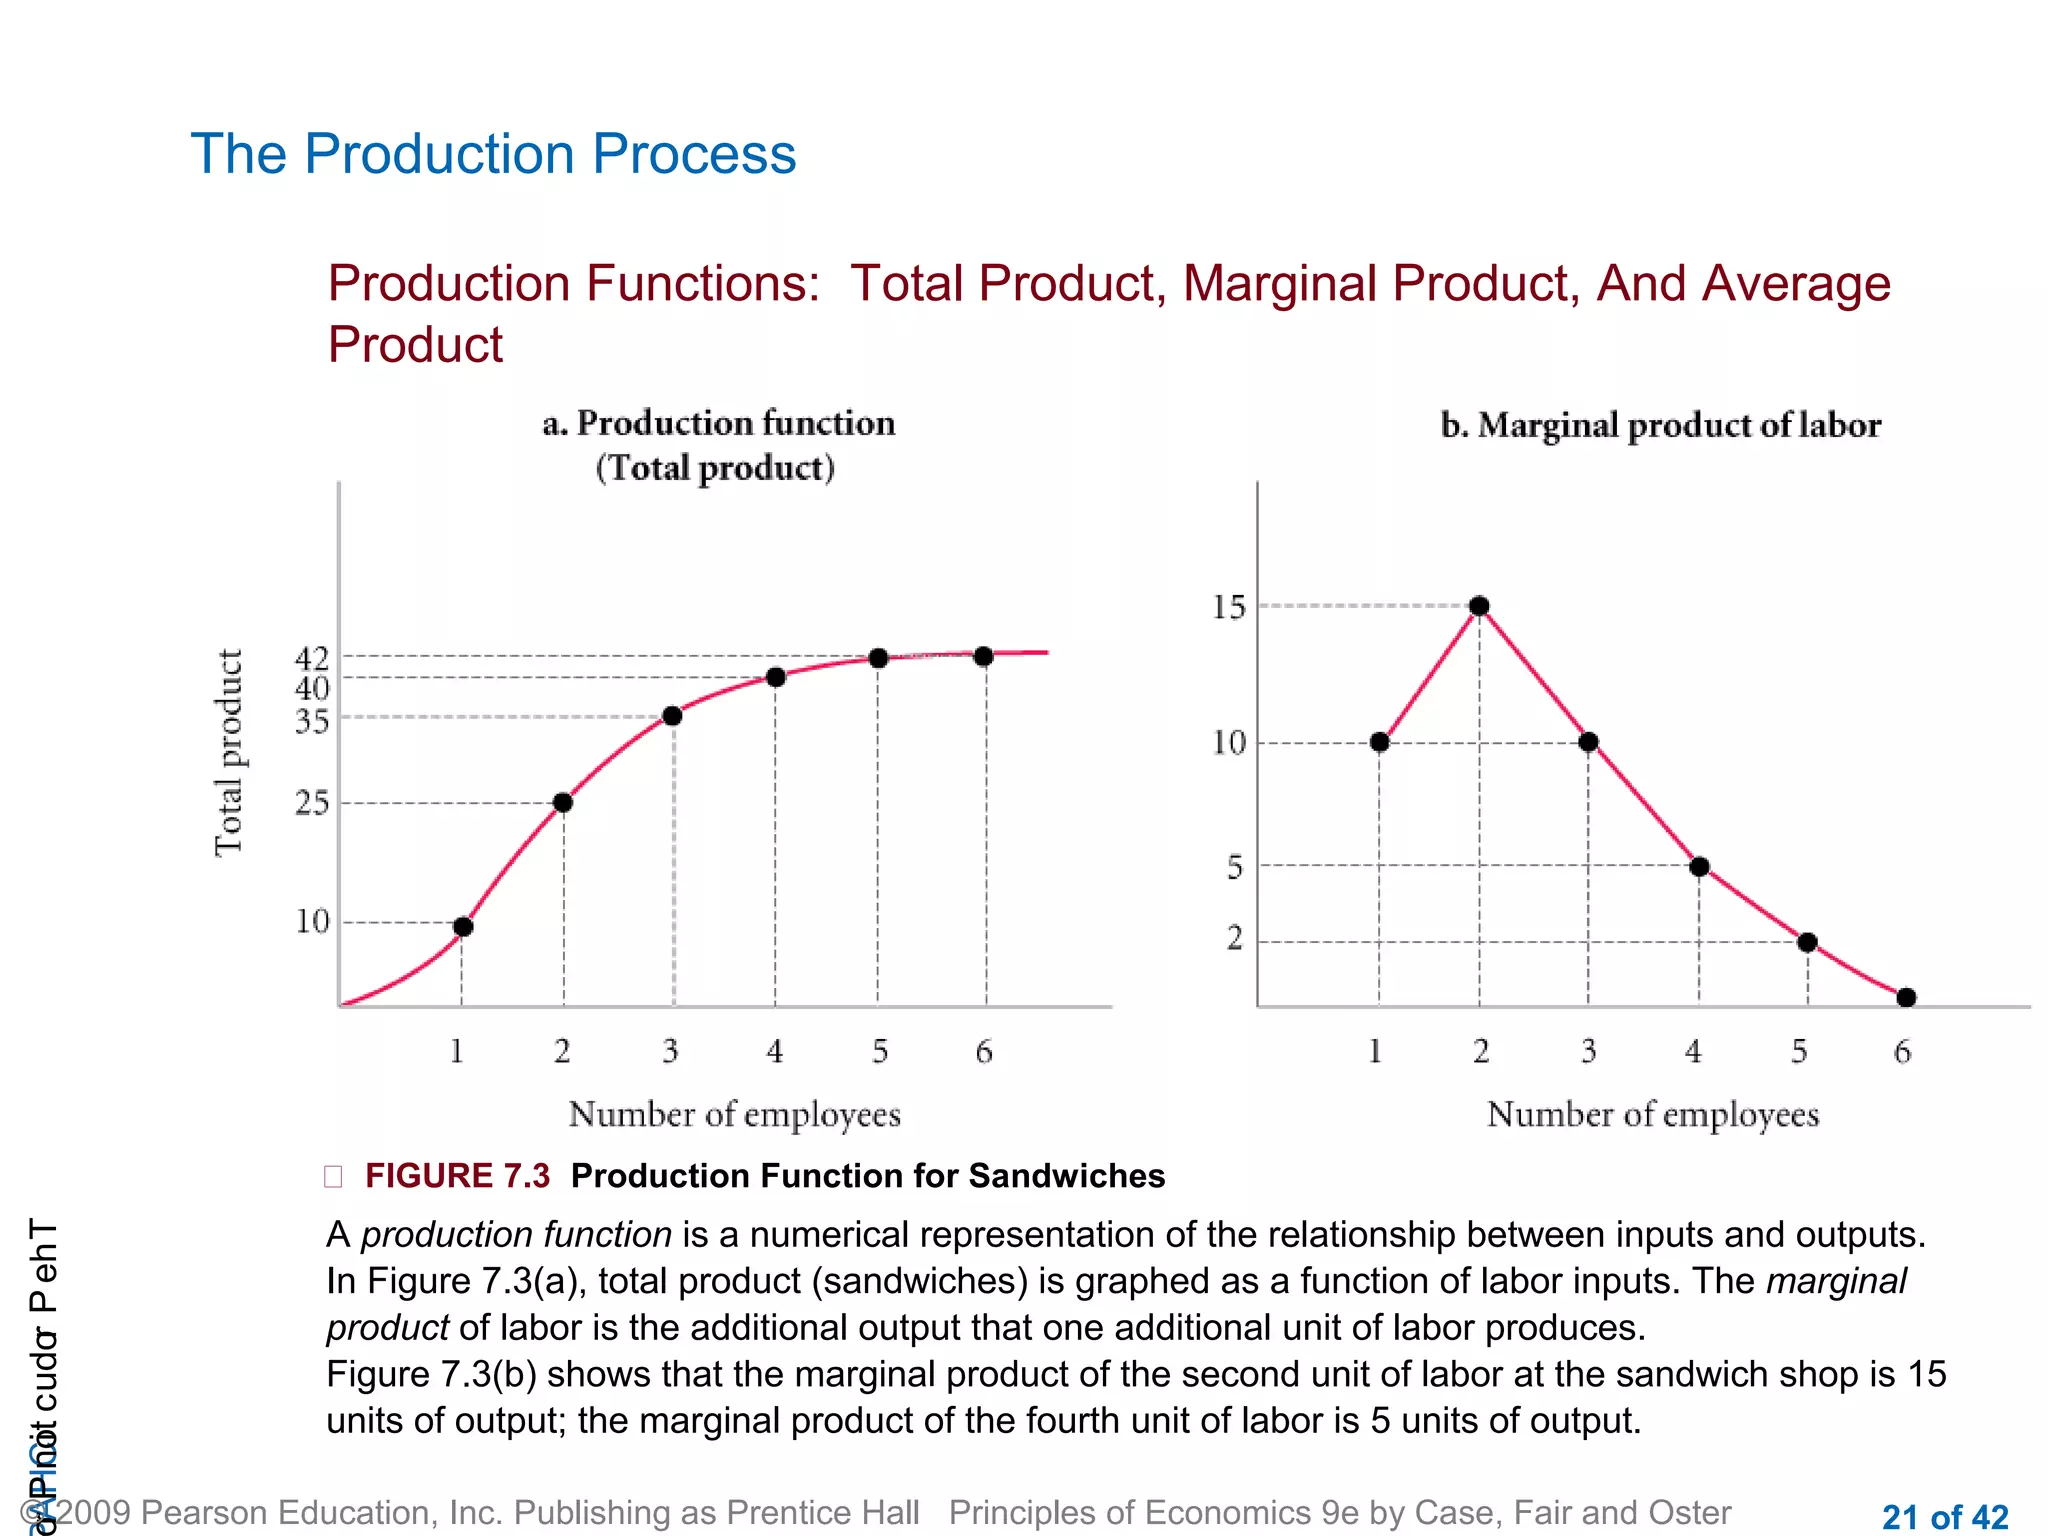
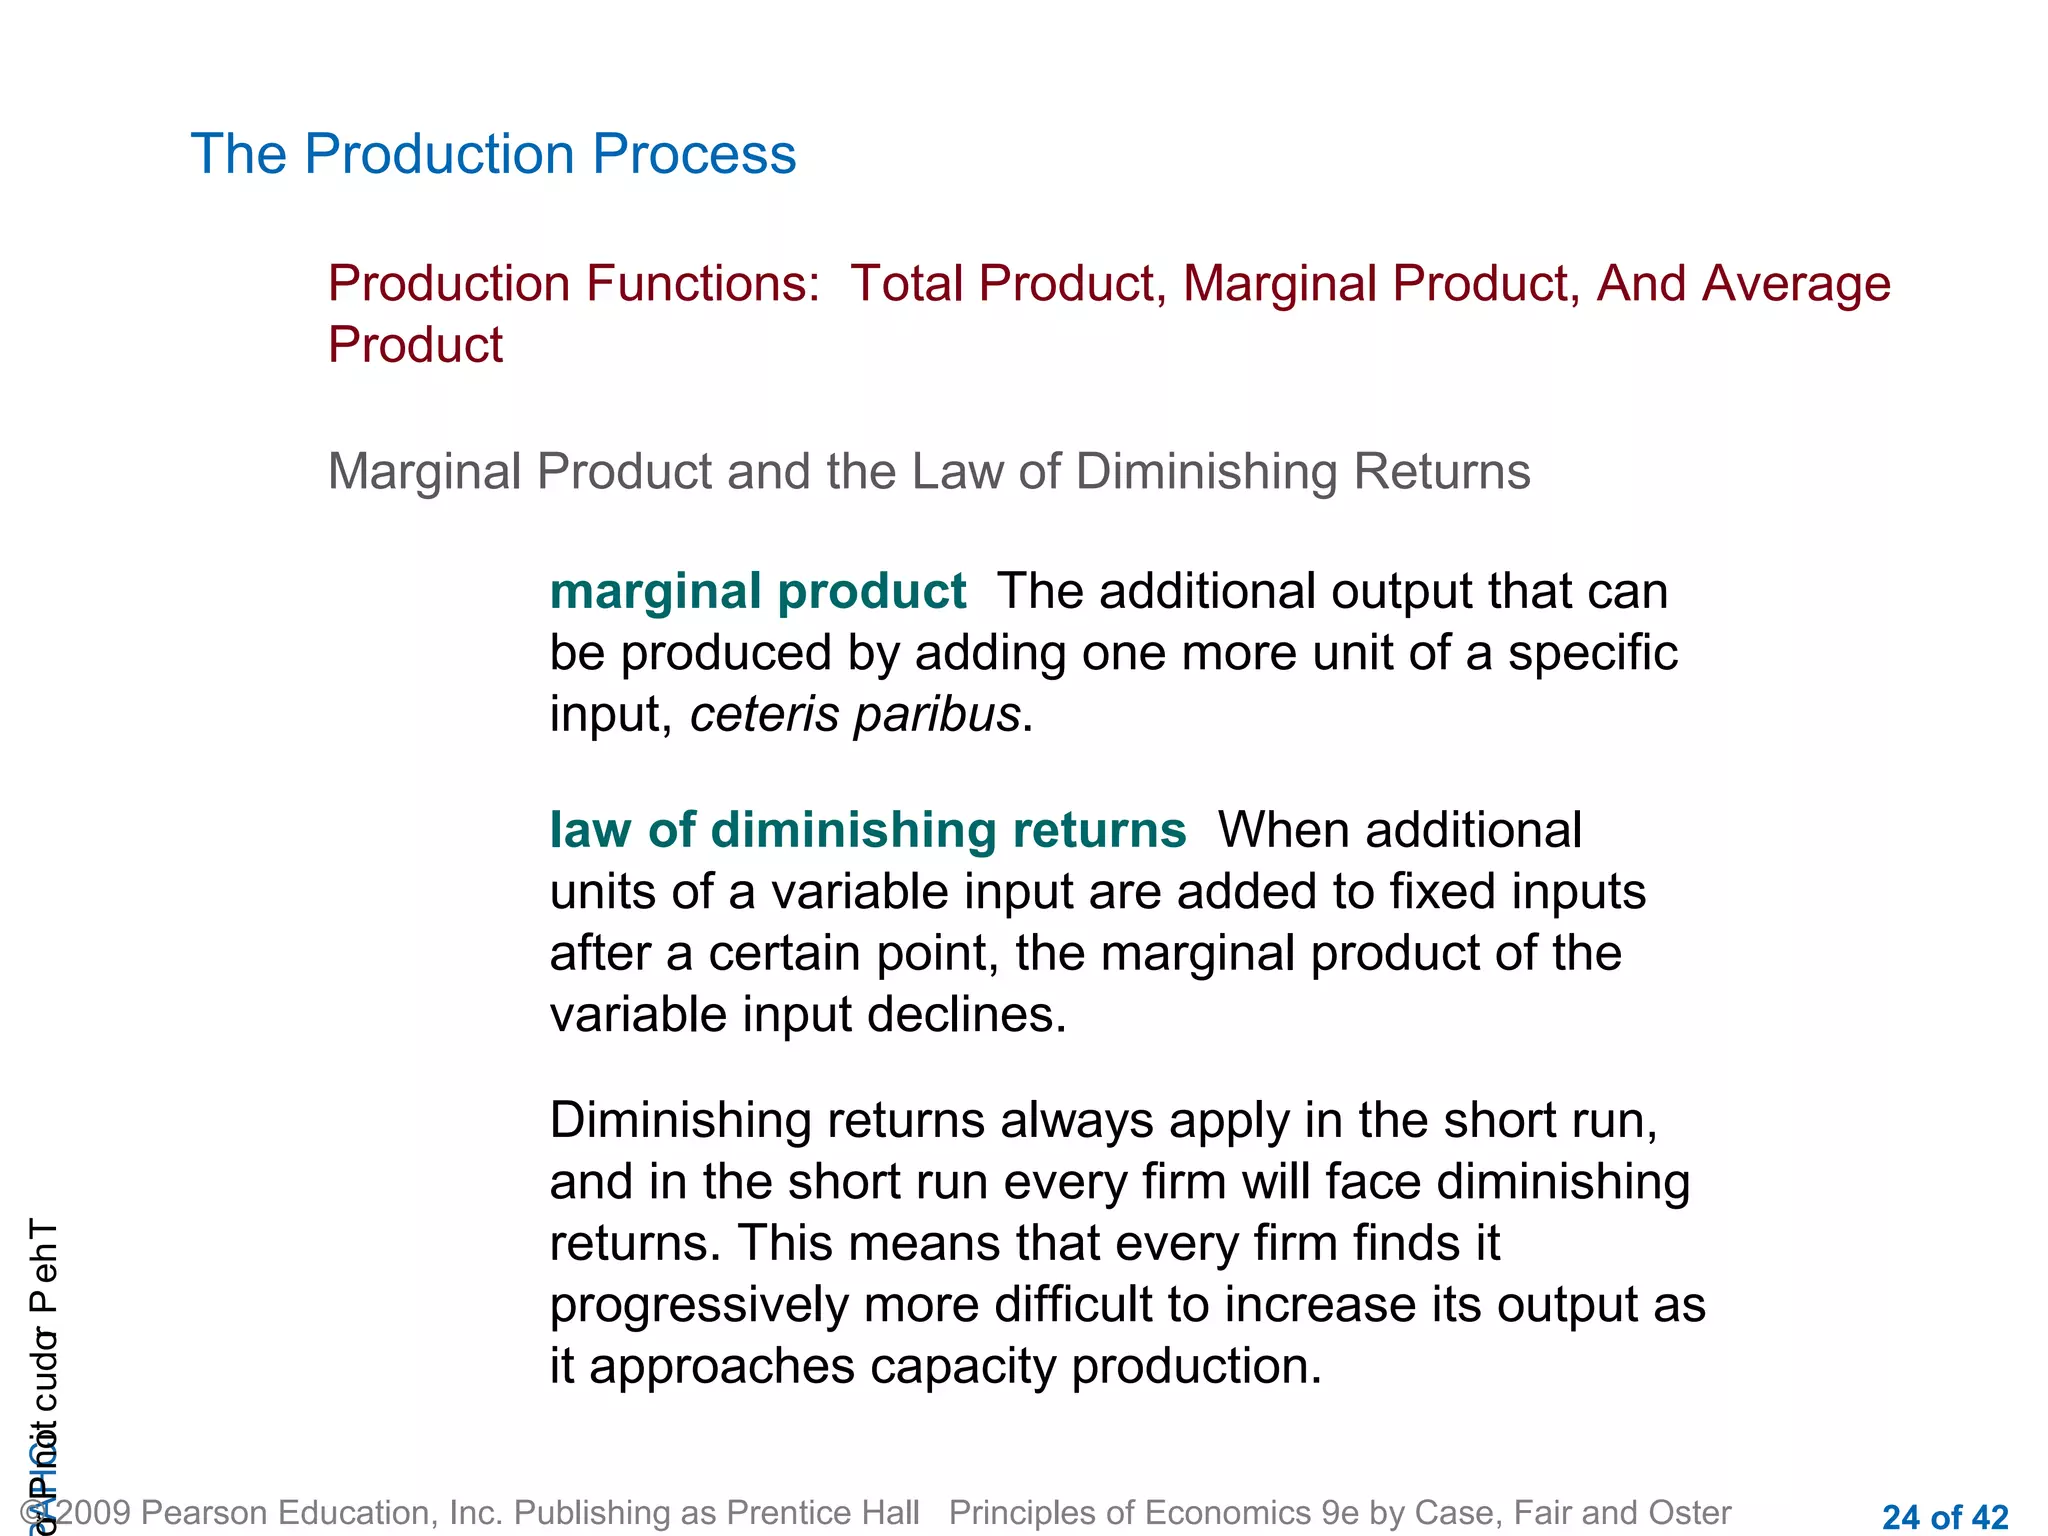
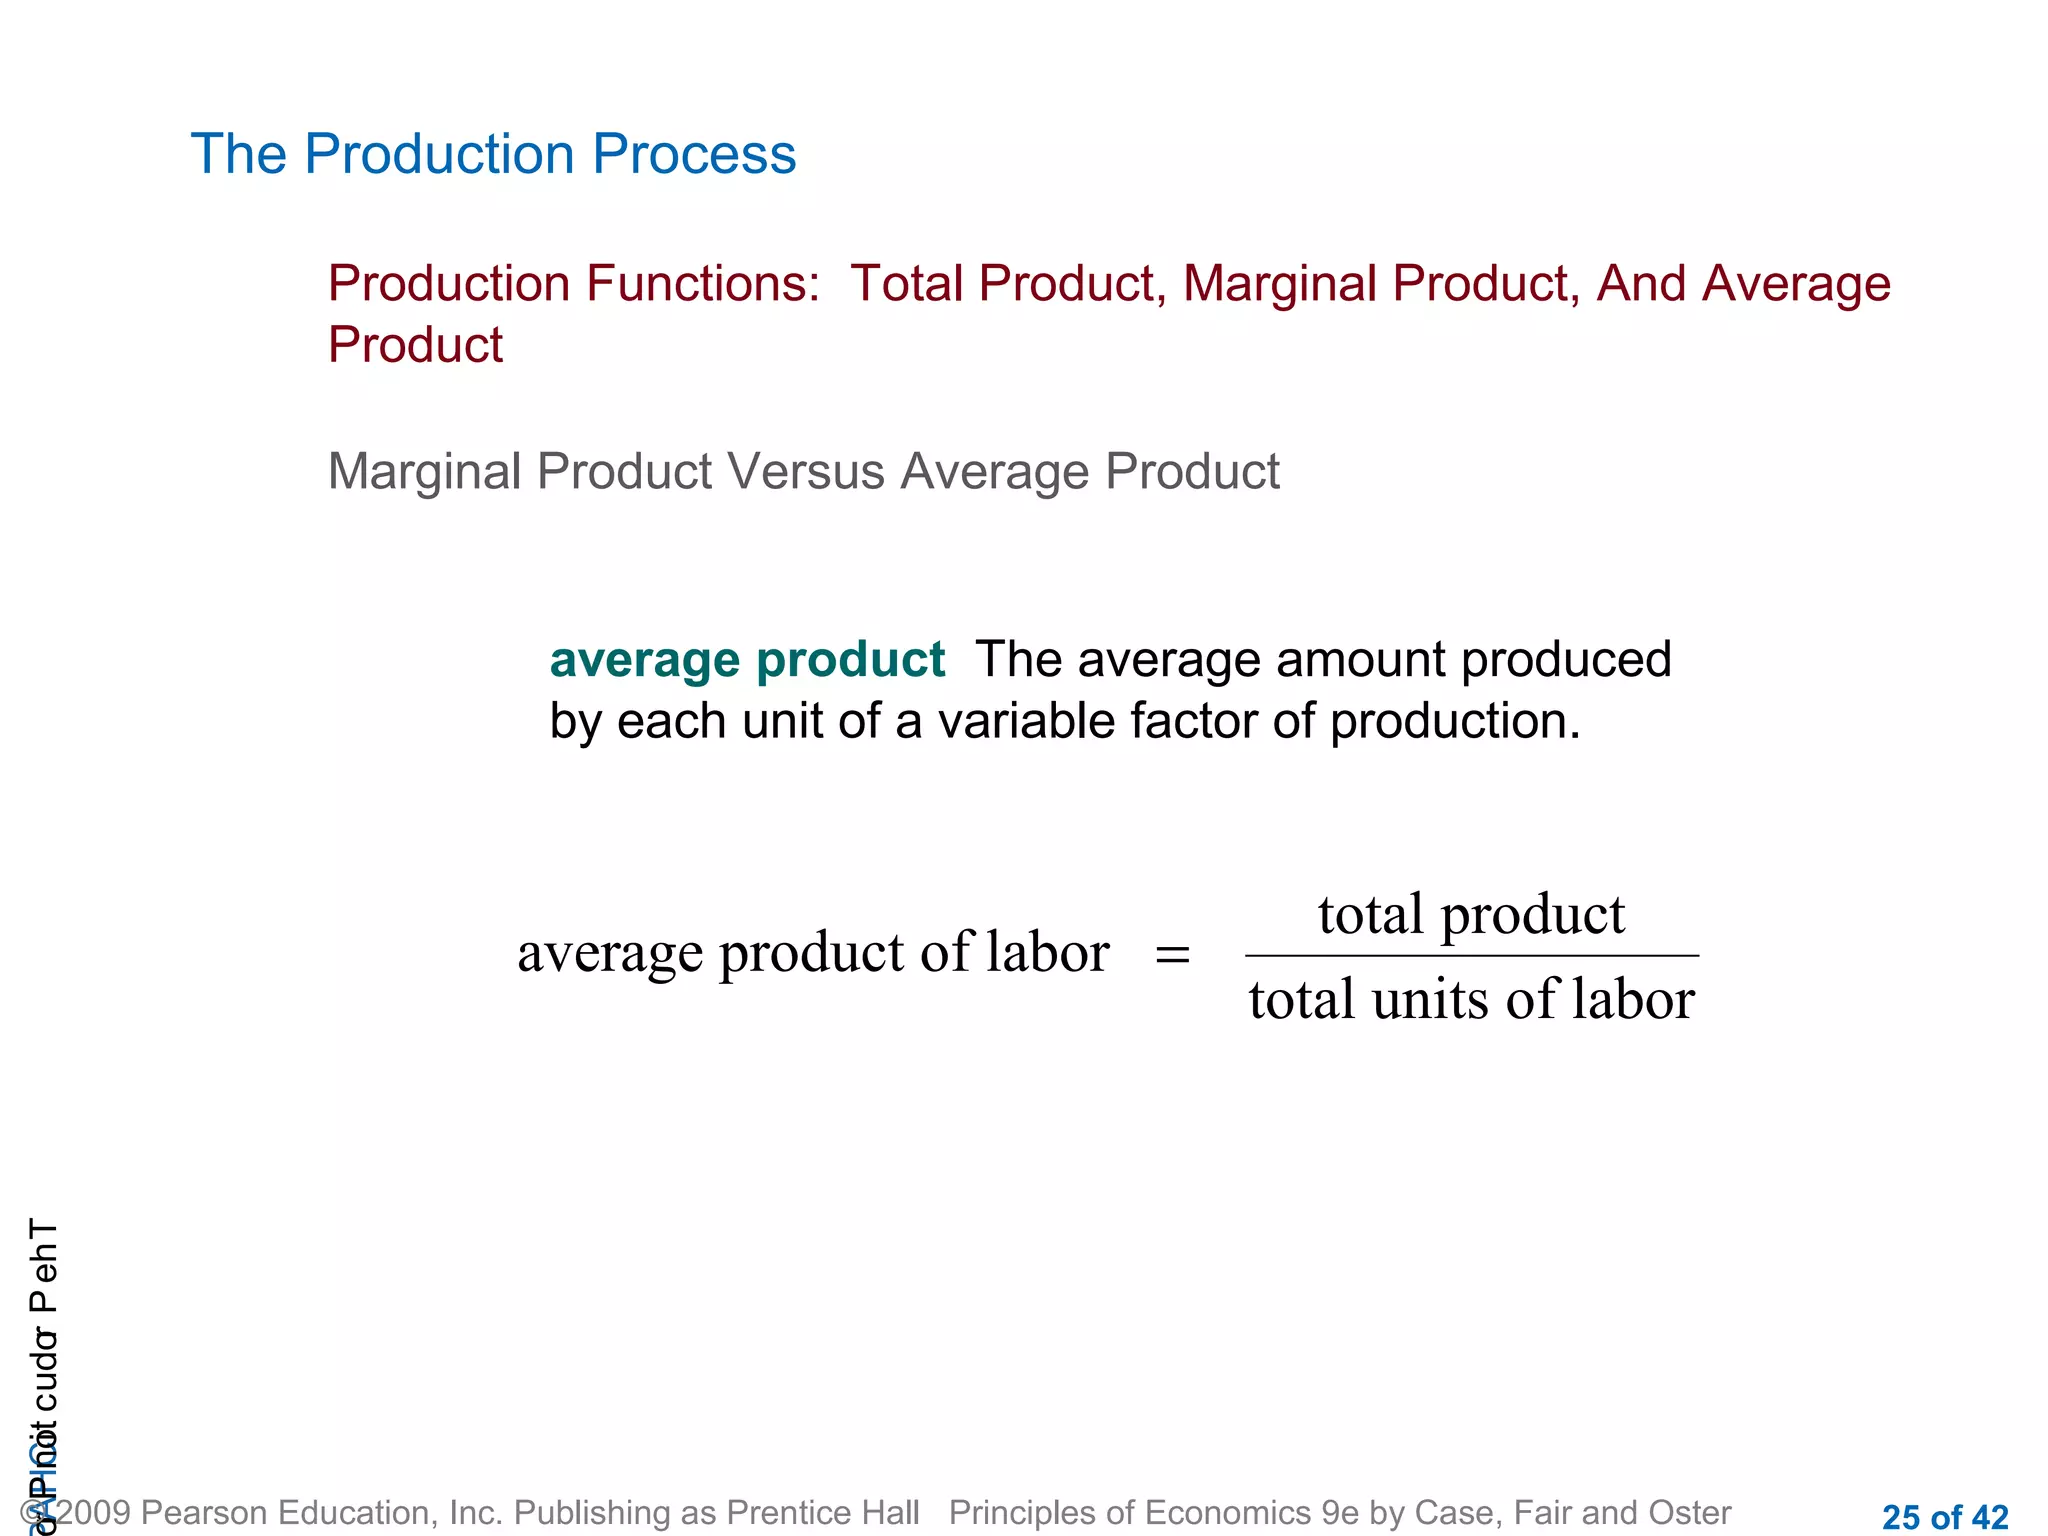
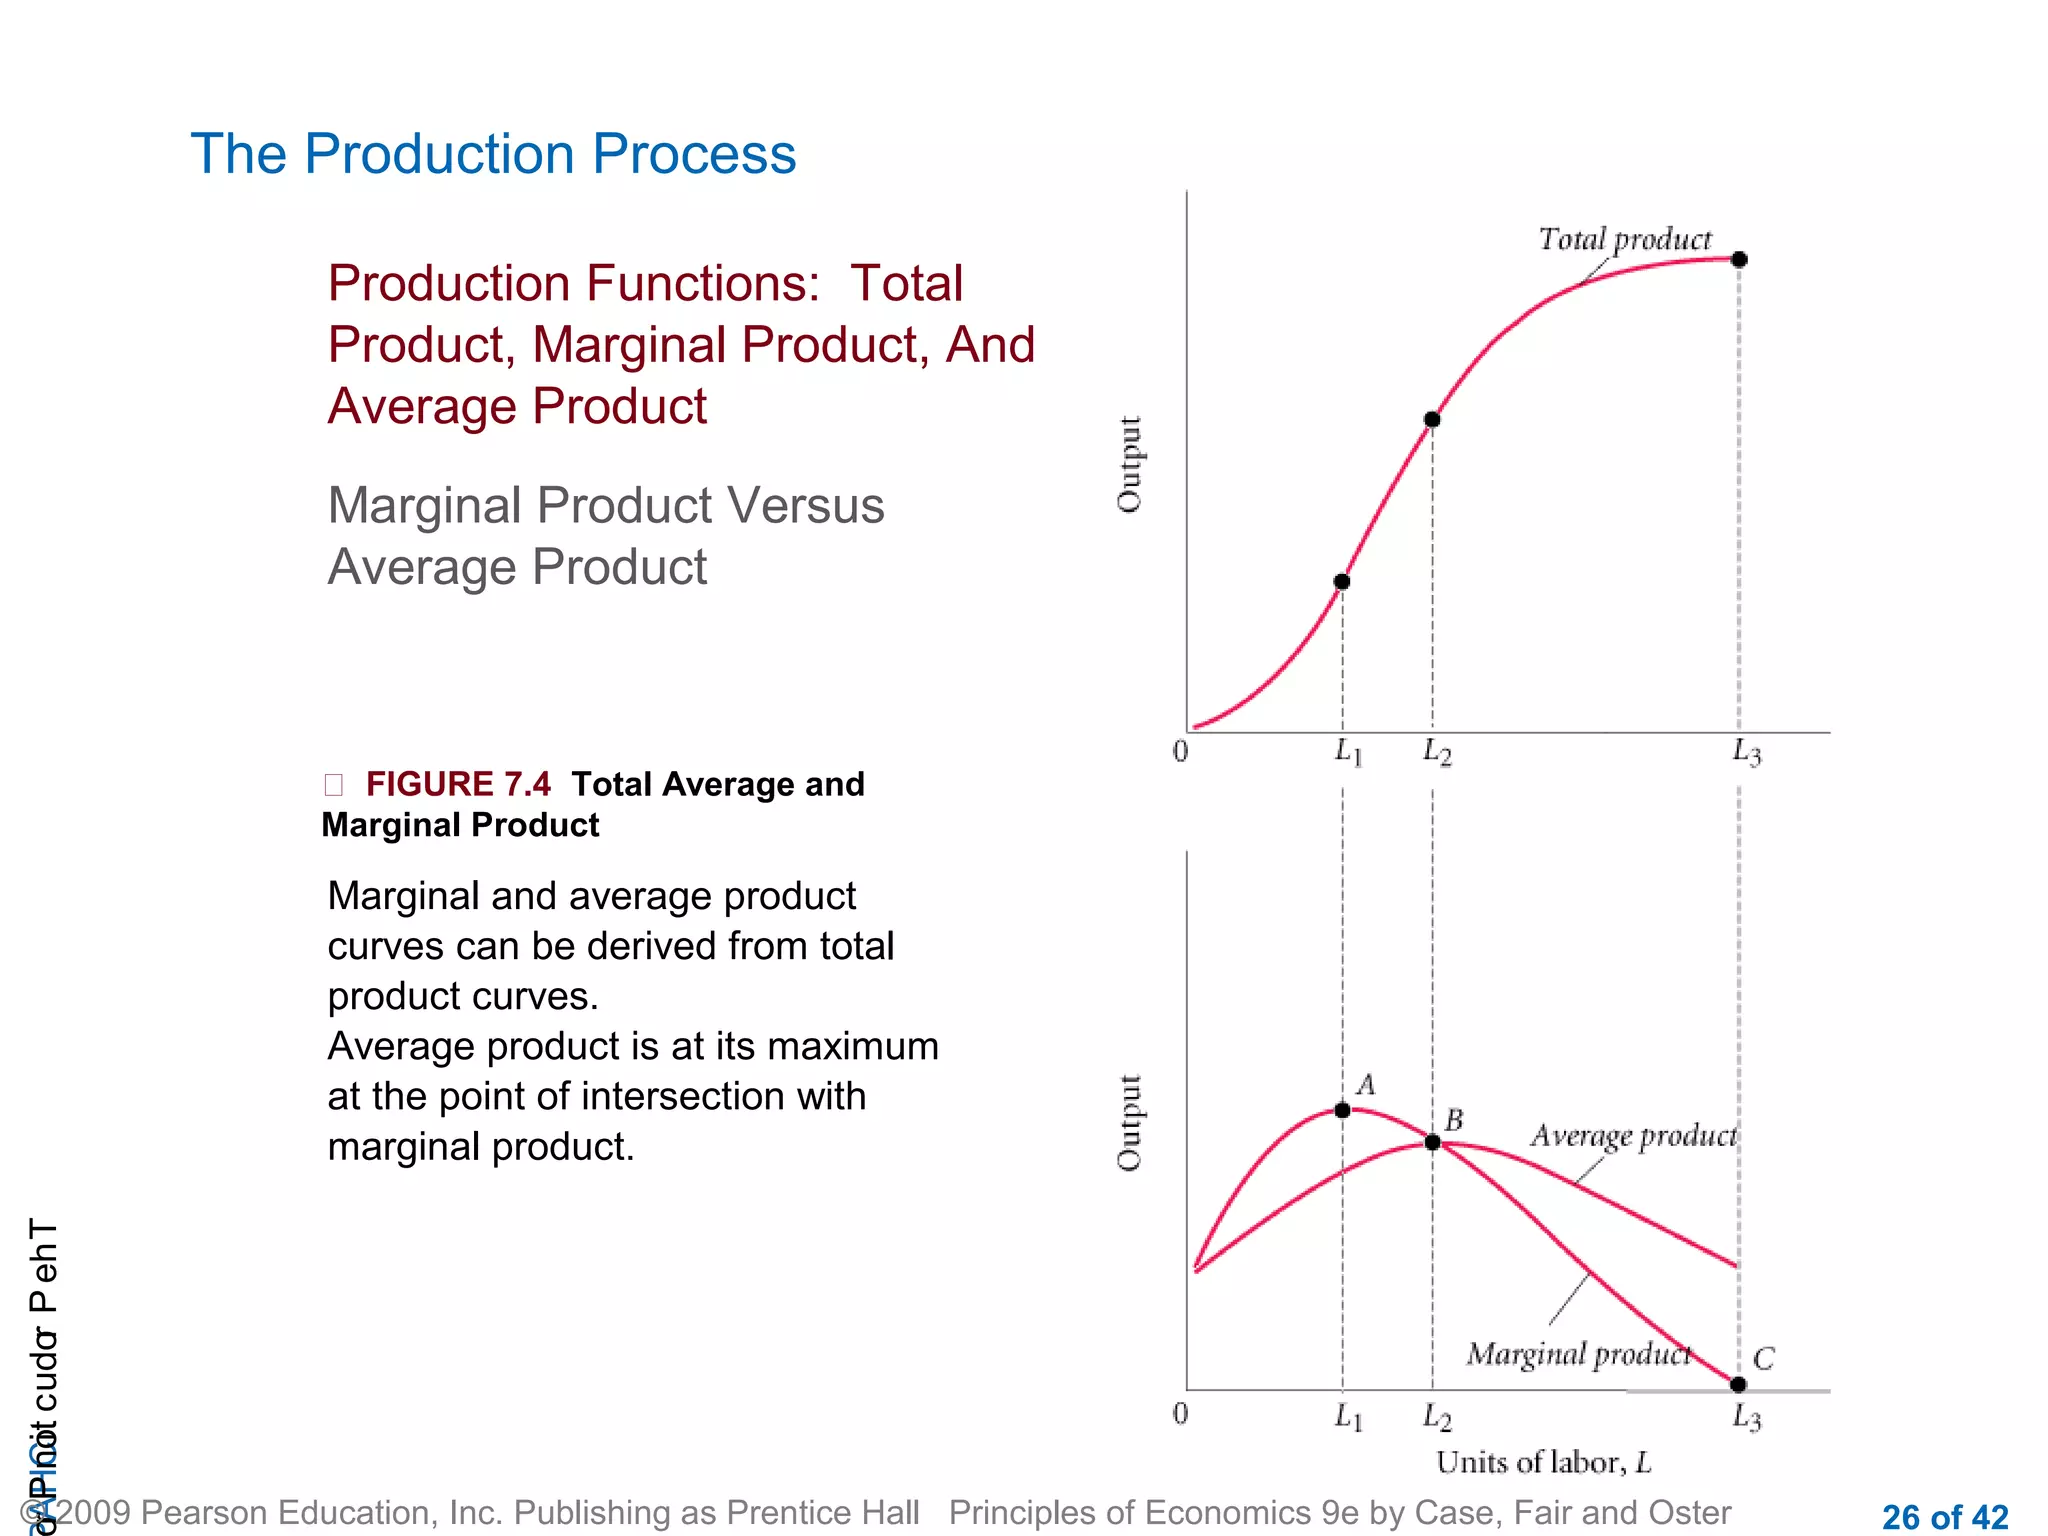

The document outlines chapters from a PowerPoint presentation on principles of economics, including sections on profit-maximizing firms, production processes, costs, and technologies. It provides definitions of key economic concepts and examples to illustrate production functions and the relationship between marginal product, average product, and total product. Graphs and tables are included to demonstrate costs and inputs for different production methods.


![[EM-Sofyan] Monopoly and Monopsony Market](https://cdn.slidesharecdn.com/ss_thumbnails/em-sofyanmonopolyandmonopsonymarket-140107174254-phpapp02-thumbnail.jpg?width=640&height=640&fit=bounds)


