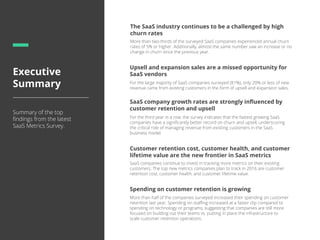
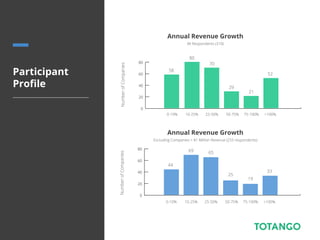
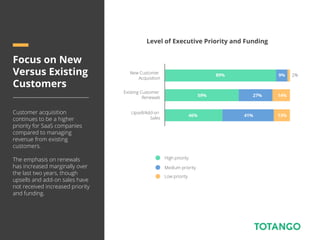
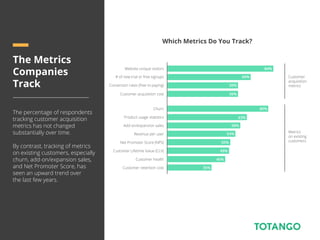
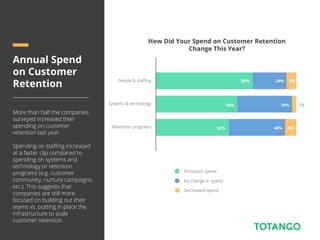
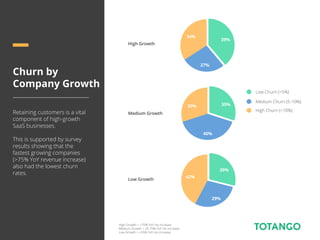
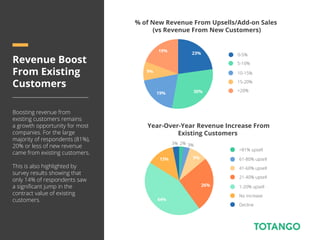
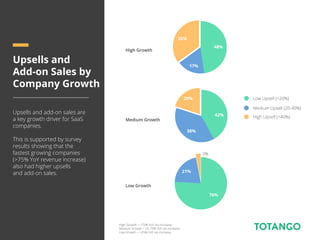
The survey found that SaaS companies are increasingly focused on metrics related to existing customers, such as customer retention cost, health, and lifetime value. While over two-thirds of companies experienced annual churn rates of 5% or higher, spending on customer retention is growing. Fast growing companies tend to have lower churn rates and higher revenue from upsells/add-ons with existing customers. However, for most companies upsells contribute to less than 20% of new revenue, indicating it remains an opportunity area.
2. About
The Research
The SaaS Metrics Report is
based on an annually
conducted survey started
in 2011.
This year’s report looked
at responses from over
300 SaaS professionals.
About
Totango
Totango is the leader in
customer success
management for SaaS
businesses.
Totango helps companies
improve customer health,
boost revenue, and
manage their customer
success operations.
3. Executive
Summary
Summary of the top
findings from the latest
SaaS Metrics Survey.
Customer retention cost, customer health, and customer
lifetime value are the new frontier in SaaS metrics
The SaaS industry continues to be a challenged by high
churn rates
Spending on customer retention is growing
SaaS companies continue to invest in tracking more metrics on their existing
customers. The top new metrics companies plan to track in 2016 are customer
retention cost, customer health, and customer lifetime value.
More than two-thirds of the surveyed SaaS companies experienced annual churn
rates of 5% or higher. Additionally, almost the same number saw an increase or no
change in churn since the previous year.
More than half of the companies surveyed increased their spending on customer
retention last year. Spending on staffing increased at a faster clip compared to
spending on technology or programs, suggesting that companies are still more
focused on building out their teams vs. putting in place the infrastructure to
scale customer retention operations.
Upsell and expansion sales are a missed opportunity for
SaaS vendors
For the large majority of SaaS companies surveyed (81%), only 20% or less of new
revenue came from existing customers in the form of upsell and expansion sales.
SaaS company growth rates are strongly influenced by
customer retention and upsell
For the third year in a row, the survey indicates that the fastest growing SaaS
companies have a significantly better record on churn and upsell, underscoring
the critical role of managing revenue from existing customers in the SaaS
business model.
5. Job Function
Job Title
Marketing
Customer Success/Account Mgmt
Sales
Customer Support
Products
Operations
Other
C-Level
VP
Director
Manager
Other
Participant
Profile
11%
46%
11%
4%
8%
10%
10%
20%
12%
28%
32%
10%
6. Participant
Profile
Customer Success Team Size
1-5 Person
6-20 Person
20+ Person
No Team
44%
30%
18%
8%
Revenue Distribution
0
20
40
60
80
100
120
<$1 M $1-10 M $10-50 M $50-100 M >$100 M
55
108
70
19
46
Annual Revenue
NumberofCompanies
12 respondents did not complete this question
9. The State of
SaaS Metrics
For the third year in a row,
50% or more respondents
indicated that they are satisfied
with the state of their business
metrics.
That said, after a sizable jump
in 2013, satisfaction has not
improved significantly, with
only a slight upward trend
for executives who are “very
pleased” with their company’s
metrics.
Satisfaction with SaaS Metrics
Not satisfied and learned to live with it
Not satisfied and investing to improve it
Good enough
Very pleased
27%
2011 2012 2013 2014 2015
34%
25%
15%
37%
32%
14%
17%
15%
31%
35%
19%
15%
35%
30%
20%
11%
33%
31%
25%
10. Level of Executive Priority and Funding
High priority
Medium priority
Low priority
Focus on New
Versus Existing
Customers
Customer acquisition
continues to be a higher
priority for SaaS companies
compared to managing
revenue from existing
customers.
The emphasis on renewals
has increased marginally over
the last two years, though
upsells and add-on sales have
not received increased priority
and funding.
New Customer
Acquisition
Existing Customer
Renewals
Upsell/Add-on
Sales
89% 9%
59%
46%
27%
41% 13%
14%
2%
11. 46%
49%
50%
54%
58%
Which Metrics Do You Track?
Website unique visitors
The Metrics
Companies
Track
The percentage of respondents
tracking customer acquisition
metrics has not changed
substantially over time.
By contrast, tracking of metrics
on existing customers, especially
churn, add-on/expansion sales,
and Net Promoter Score, has
seen an upward trend over
the last few years.
# of new trial or free signups
Conversion rates (free to paying)
Customer acquisition cost
Churn
Product usage statistics
Add-on/expansion sales
Revenue per user
Net Promoter Score (NPS)
Customer Lifetime Value (CLV)
Customer health
Customer retention cost
84%
66%
56%
56%
80%
63%
84%
35%
Customer
acquisition
metrics
Metrics
on existing
customers
54%
46%
12. 37%
45%
46%
55%
22%
37%
The Metrics
Companies Plan
To Track
Survey results show that
respondents are mostly
planning to add metrics
on existing customers to
their internal processes.
Annual trends suggest that
metrics such as customer
retention cost, customer
health, and customer lifetime
value are the next big metrics
respondents plan to track.
Which Metrics Do You Plan To Track?
Customer acquisition cost
Conversion rates (free to paying)
# of new trial or free signups
Website unique visitors
Customer retention cost
Customer health
Customer Lifetime Value (CLV)
Net Promoter Score (NPS)
Add-on/expansion sales
Product usage statistics
Revenue per user
Churn 17%
32%
30%
34%
10%
Customer
acquisition
metrics
Metrics
on existing
customers
13%
13. Customer
Acquisition and
Retention Costs
A significantly higher number
of companies measure and
track customer acquisition
costs compared to customer
retention costs.
However, 55% of respondents
plan on tracking customer
retention cost in the future,
making it the #1 new metric
most companies plan to
measure.
Retention Cost vs. Acquisition Cost
Customer
Acquisition
Cost
Customer
Retention
Cost
56%
37%
55%
Currently track
Plan to track
35%
14. Annual Spend
on Customer
Retention
More than half the companies
surveyed increased their
spending on customer
retention last year.
Spending on staffing increased
at a faster clip compared to
spending on systems and
technology or retention
programs (e.g. customer
community, nurture campaigns,
etc.). This suggests that
companies are still more
focused on building out their
teams vs. putting in place the
infrastructure to scale
customer retention.
How Did Your Spend on Customer Retention
Change This Year?
Increased spend
No change in spend
Decreased spend
24%69% 7%
39%58%
40%52% 8%
2%
People & staffing
Systems & technology
Retention programs
15. 22%58% 20%
31%46% 23%
39%33% 28%
39%26% 35%
23%21% 56%
39%30% 31%
33%35% 32%
25%47% 28%
30%47% 23%
Tracking
Customer
Health
For the respondents who
measure customer health,
the top drivers of health
are product usage and
engagement, CRM metrics,
and service utilization (e.g.
licenses used vs purchased).
The frequency with which
companies recalculate
customer health varies
widely, with the majority
doing so on a weekly or
monthly basis.
What Is Included In Your Definition Of
Customer Health?
Usage and engagement
CRM metrics (support tickets)
Service utilization
Customer satisfaction/NPS
Executive sponsor relationship
CSM risk assessment
Business impact/ROI
Use of support/training material
Other metrics
Included
Not included, but will
be in the future
Do Not Include
How Often Do You Recalculate Customer Health?
Daily (As it happens)
Weekly
Monthly
Quarterly
Annually
21%
29%
16%
29%
5%
16. New Business
From Free Trials
or Freemium
The number of companies
depending on free trials and
freemium to acquire new
business continues a steady
5-year decline.
Of the companies that have
these programs, less than
half derive more than 25%
of new business through
free trial and freemium.
What Percentage of New Business Comes From
Free Trials and Freemium?
17%
16%
38%
18%
11%
0-10%
10-25%
26-50%
>50%
No Freemium/Free Trial
17. How does your
company
measure churn?
Most SaaS companies
continue to measure churn
by the number of customers
lost, followed closely by
churn based on revenue.
Even as new technologies
make it easier to analyze
churn, less than one quarter
of respondents calculate
churn at a more granular
level based on product
downgrades or number
of users/licenses lost.
How Do You Measure Churn?
By # of Customers
By Revenue
By # Users/Licenses
By Product Downgrade
69%
62%
22%
16%
18. Churn
Rates
Only 32% of respondents
experienced an annual churn
rate of 5% or less, while almost
one-fifth had churn exceeding
15%.
Survey responses suggest
mixed results in controlling
churn. While slightly over
one-third report a decrease
in churn over last year, 30%
of respondents saw an
increase in churn and the
balance 34% saw no
significant change.
Annualized Revenue Churn Rate
0-5% churn
5-10% churn
10-15% churn
>15% churn
32%
32%
17%
19%
36%
34%
30%
Increased
No change
Decreased
Has your churn rate increased or decreased
in the last year?
19. Churn by
Company Growth
Retaining customers is a vital
component of high-growth
SaaS businesses.
This is supported by survey
results showing that the
fastest growing companies
(>75% YoY revenue increase)
also had the lowest churn
rates.
Low Churn (<5%)
Medium Churn (5-10%)
High Churn (>10%)
High Growth
Medium Growth
Low Growth
39%
27%
34%
30%
40%
30%
29%
29%
42%
High Growth = >75% YoY rev increase
Medium Growth = 25-75% YoY rev increase
Low Growth = <25% YoY rev increase
20. Revenue Boost
From Existing
Customers
Boosting revenue from
existing customers remains
a growth opportunity for most
companies. For the large
majority of respondents (81%),
20% or less of new revenue
came from existing customers.
This is also highlighted by
survey results showing that
only 14% of respondents saw
a significant jump in the
contract value of existing
customers.
Year-Over-Year Revenue Increase From
Existing Customers
>81% upsell
61-80% upsell
41-60% upsell
21-40% upsell
1-20% upsell
No increase
Decline
9%
26%
44%
13%
3% 2% 3%
5-10%
10-15%
15-20%
>20%
0-5%
% of New Revenue From Upsells/Add-on Sales
(vs Revenue From New Customers)
23%
30%19%
19%
9%
21. Upsells and
Add-on Sales by
Company Growth
Upsells and add-on sales are
a key growth driver for SaaS
companies.
This is supported by survey
results showing that the
fastest growing companies
(>75% YoY revenue increase)
also had higher upsells
and add-on sales.
Low Upsell (<20%)
Medium Upsell (20-40%)
High Upsell (>40%)
High Growth
Medium Growth
Low Growth
48%
17%
35%
42%
38%
20%
76%
3%
21%
High Growth = >75% YoY rev increase
Medium Growth = 25-75% YoY rev increase
Low Growth = <25% YoY rev increase
22. Join hundreds of businesses driving customer success
with Totango.
Learn more:
www.totango.com
1-800-634-1990
@Totango