Downloaded 655 times
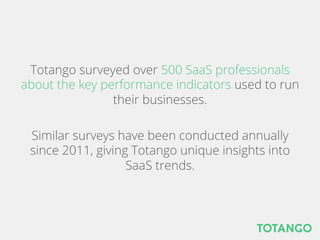
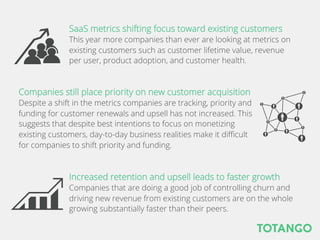
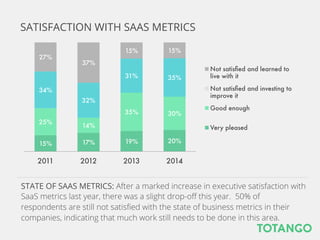
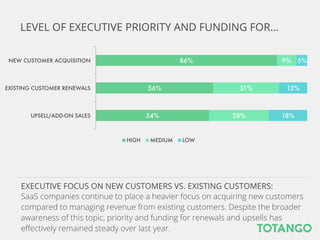
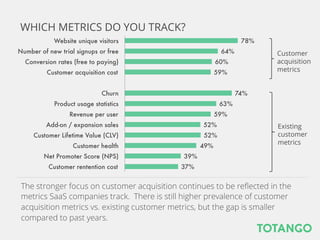
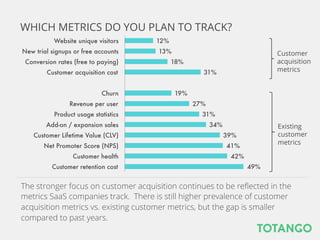
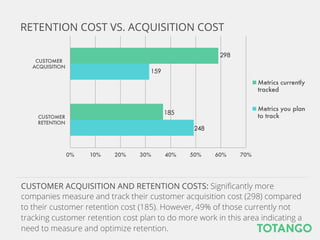
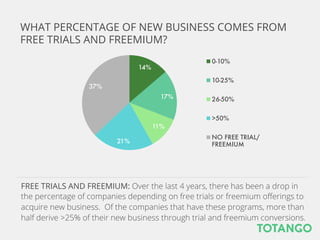
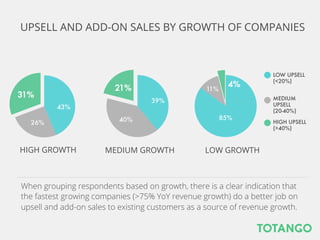

The 2014 SaaS Metrics Report by Totango surveyed over 500 SaaS professionals, revealing that companies prioritizing customer retention and upsell experience faster growth, despite ongoing focus on new customer acquisition. While metrics tracking has shifted toward existing customers, dissatisfaction remains high with current metrics systems, and most companies continue to track acquisition metrics over retention metrics. The report emphasizes the need for companies to optimize retention strategies and highlights the significant growth potential from upselling existing customers.


![[CXL Live 16] SaaS Optimization - Effective Metrics, Process and Hacks by Ste...](https://cdn.slidesharecdn.com/ss_thumbnails/znc6uhgwrspf7rcgxbrk-signature-42db88fde2139044dd6963018b134da7e709739587431e34ce8d4285185c8547-poli-160403200011-thumbnail.jpg?width=640&height=640&fit=bounds)


![5G Explained! A High Level Overview [Introduction]](https://cdn.slidesharecdn.com/ss_thumbnails/5gexplainedahighleveloverview-260119165306-cc137a3e-thumbnail.jpg?width=640&height=640&fit=bounds)


