
Recommended
More Related Content
What's hot
What's hot (20)
Similar to Taguchi
Similar to Taguchi (20)
Recently uploaded
Recently uploaded (20)
Taguchi
- 1. TAE :- 1 SWAPNIL S. SHEDMAKE ROLL N0. 10
- 3. • Taguchi method is a statistical method developed by Taguchi and Konishi .Initially it was developed for improving the quality of goods manufactured, later it was expanded to many other fields . • Fields such as Engineering, Biotechnology ,Marketing and Advertising. • Sometimes called robust design methods. • The most common goals are minimizing cost, maximizing throughout, and/or efficiency. • This is one of the major quantitative tools in industrial decision making
- 4. Taguchi’s Method Taguchi method contains system design, parameter design, and tolerance design procedures to achieve a robust process and result for the best product quality. Taguchi designs provide a powerful and efficient method for designing processes that operate consistently and optimally over a variety of conditions. • Experimental design methods were developed in the early years of 20th century but they were not easy to use. Taguchi's approach is easy to be adopted and applied for users with limited knowledge of statistics. Hence it has gained a wide popularity in the engineering and scientific community. Taguchi specified three situations: Larger the better (for example, agricultural yield). Smaller the better (for example, carbon dioxide emissions) On-target, minimum-variation (for example, a mating part in an assembly).
- 5. CONTRIBUTIONS OF TAGUCHI • A specific loss function • The philosophy of off-line quality control and • Taguchi rule for manufacturing.
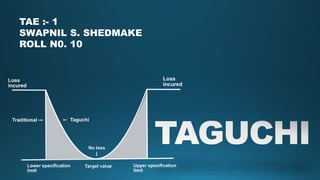
- 6. Deviation from target results in loss. • Lower than target • Greater than target • Both lose A specific loss function • Used to measure financial loss to society resulting from poor quality.
- 7. • L(y) = Loss • k = constant = cost to correct • y = reported value m = mean value (average) L(y) = k(y-m)2 tolerance 2
- 8. The philosophy of off-line quality control: • Taguchi proposed a standard 8-step procedure for applying his method for optimizing any process. 1. Identify the main function and its side effects. 2. Identify the testing condition and quality characteristics. 3. Identify the objective function to be optimized. 4. Identify the control factors and their levels 5. Select a suitable Orthogonal Array and construct the Matrix 6. Conduct the Matrix experiment. 7. Examine the data; predict the optimum control factor levels and its performance. 8. Conduct the verification experiment.
- 9. Taguchi rule for manufacturing. The process has three stages: • System design • Parameter (measure) design • Tolerance design
- 10. System design: • Involving creativity and innovation. Parameter (measure) design: • Detail design phase. • The parameters to be chosen so as to minimize the effects. • This is sometimes called robustification. Tolerance design: • Resources to be focused on reducing and controlling variation in the critical few dimensions.
- 11. IMPLEMENTATION OF TAGUCHI APPROACH FOR PTIMIZATION OF ABRASIVE WATER JET MACHINING PROCESS PARAMETERS In this study, the observed values of MRR, and SR were set to maximum, and minimum respectively. Next experimental trial was performed with three simple replications at each set value. Next, the optimisation of the observed values was determined by comparing the standard analysis and analysis of variance (ANOVA) which was based on the Taguchi method.
- 14. TABLE. 6 : Predicted Optimum Condition for MRR TABLE.7: Predicted Optimum Condition for SR The recommended parametric combination for optimum material removal rate is P3S3A2T1. The optimum recommended parametric combination for optimum surface Roughness is P3S1A1T2.
- 15. RESULTS AND DISCUSSION The following discussion focuses on the different of process parameters to the observed values (MRR and SR) based on the Taguchi methodology. • Material Removal Rate Main effects of MRR of each factor for various level conditions are shown in figure1. According to figure 1 the MRR increases with four major parameter P, S, T, A. MRR is maximum in the case of pressure at level 3 (293), in the case of SOD at level 3 (4.5), in the case of Abrasive flow rate MRR will be maximum at level 2 (6.5), and in the case of Traverse rate at the level 1 (1.5).So the optimal parameter setting for the MRR found P3S3A2T1. • Surface Roughness Figure 2 evaluates the main effects of each factor for various level conditions. According to the figure 2 the surface Roughness decreases with four major parameter P, S, A, T. SR will be minimum in the case of pressure at level 3(293), in the case of SOD at level 1 (2.5), and in the case of Abrasive flow rate at level 1(4.5) and in the case of Traverse rate condition surface Roughness will be minimum at level 2 (2.5). So the optimal parameter setting for minimum surface roughness is P3S1A1T2.
- 16. THANK YOU