Downloaded 89 times


![Demo
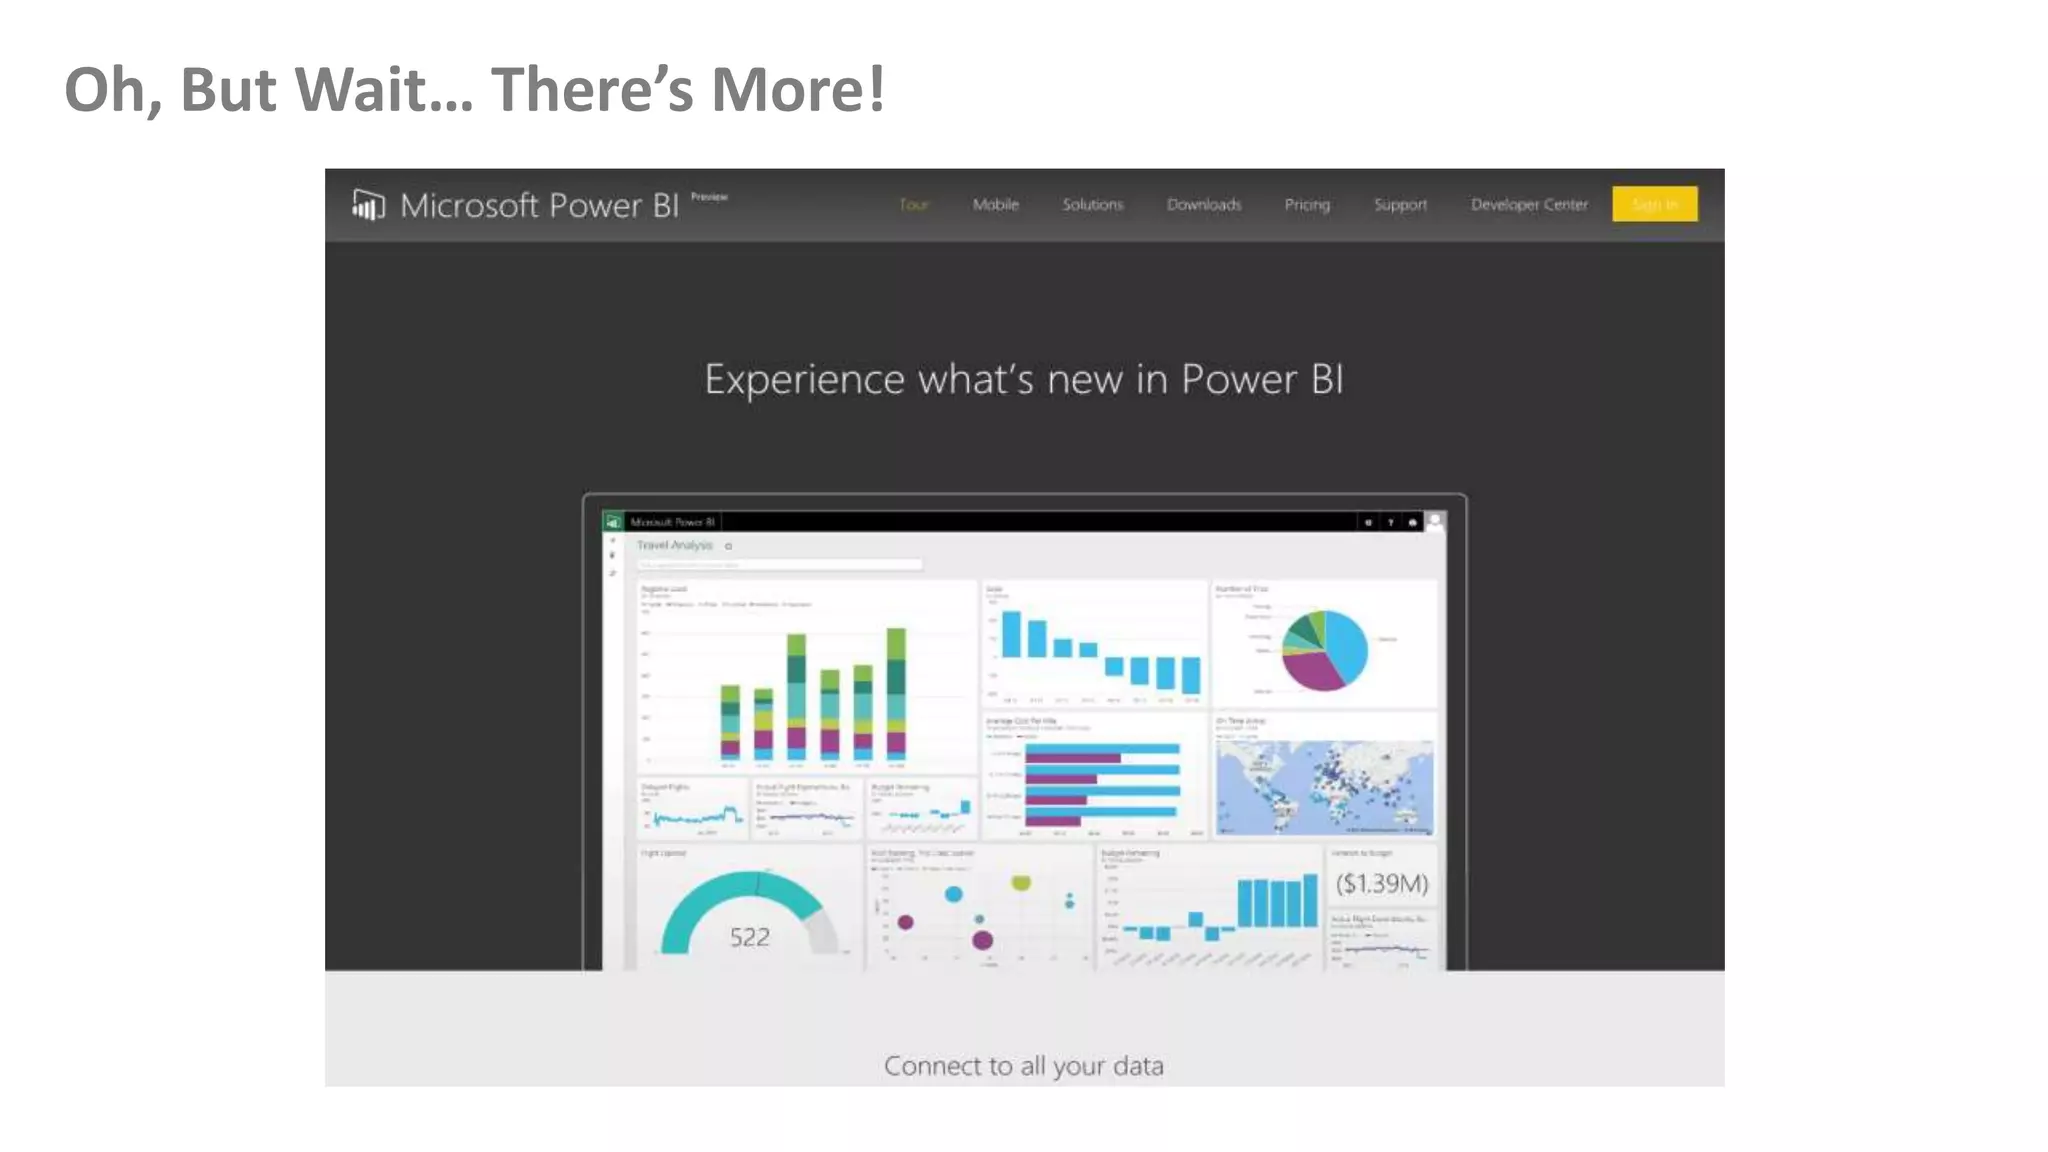
[Microsoft Power BI Public Preview Portal, Microsoft Power BI Designer,
Microsoft Power BI for iOS…]](https://image.slidesharecdn.com/powerbi-bringyourdatatogether-150412082142-conversion-gate01/75/Power-BI-Bring-your-data-together-24-2048.jpg)
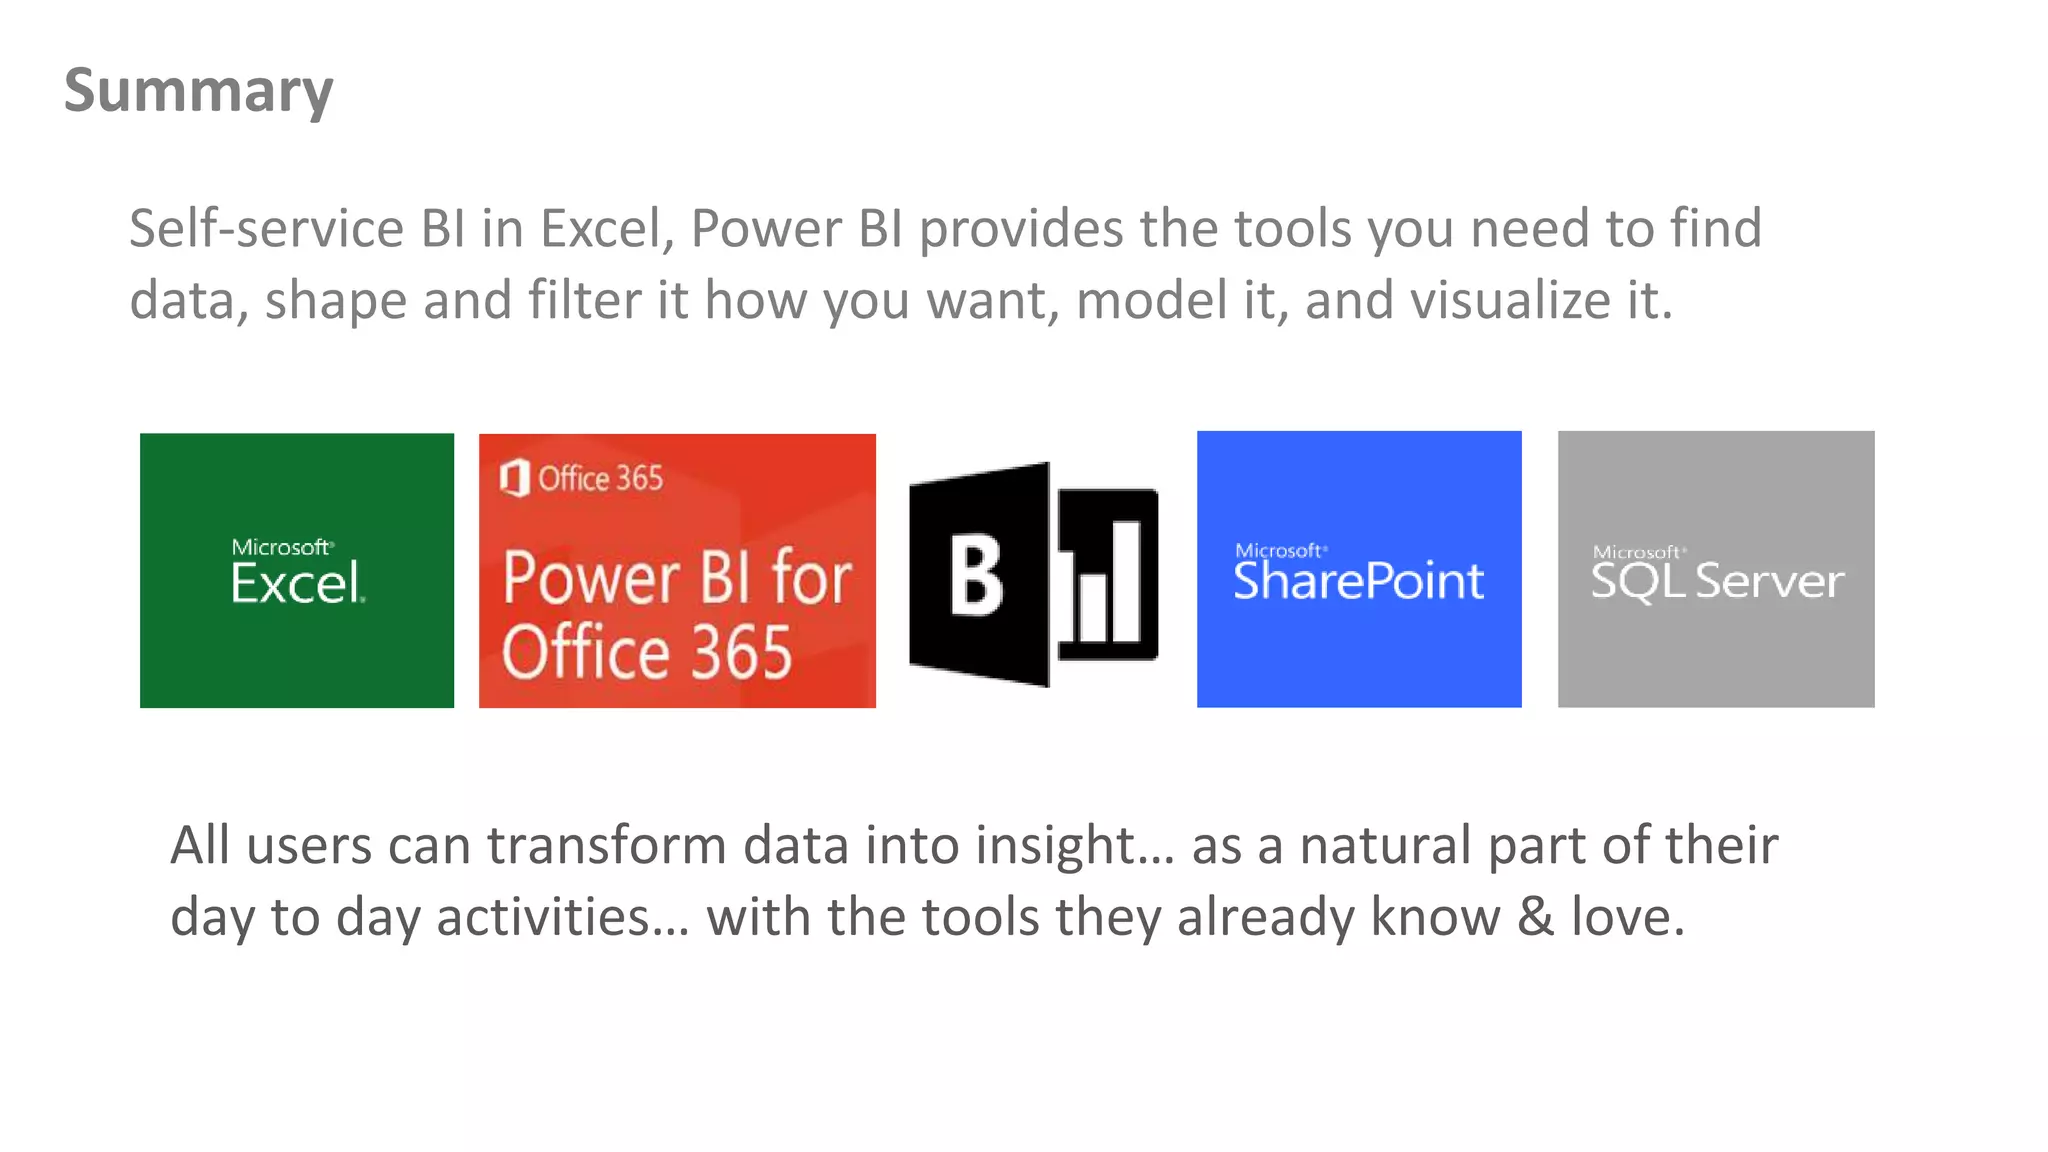


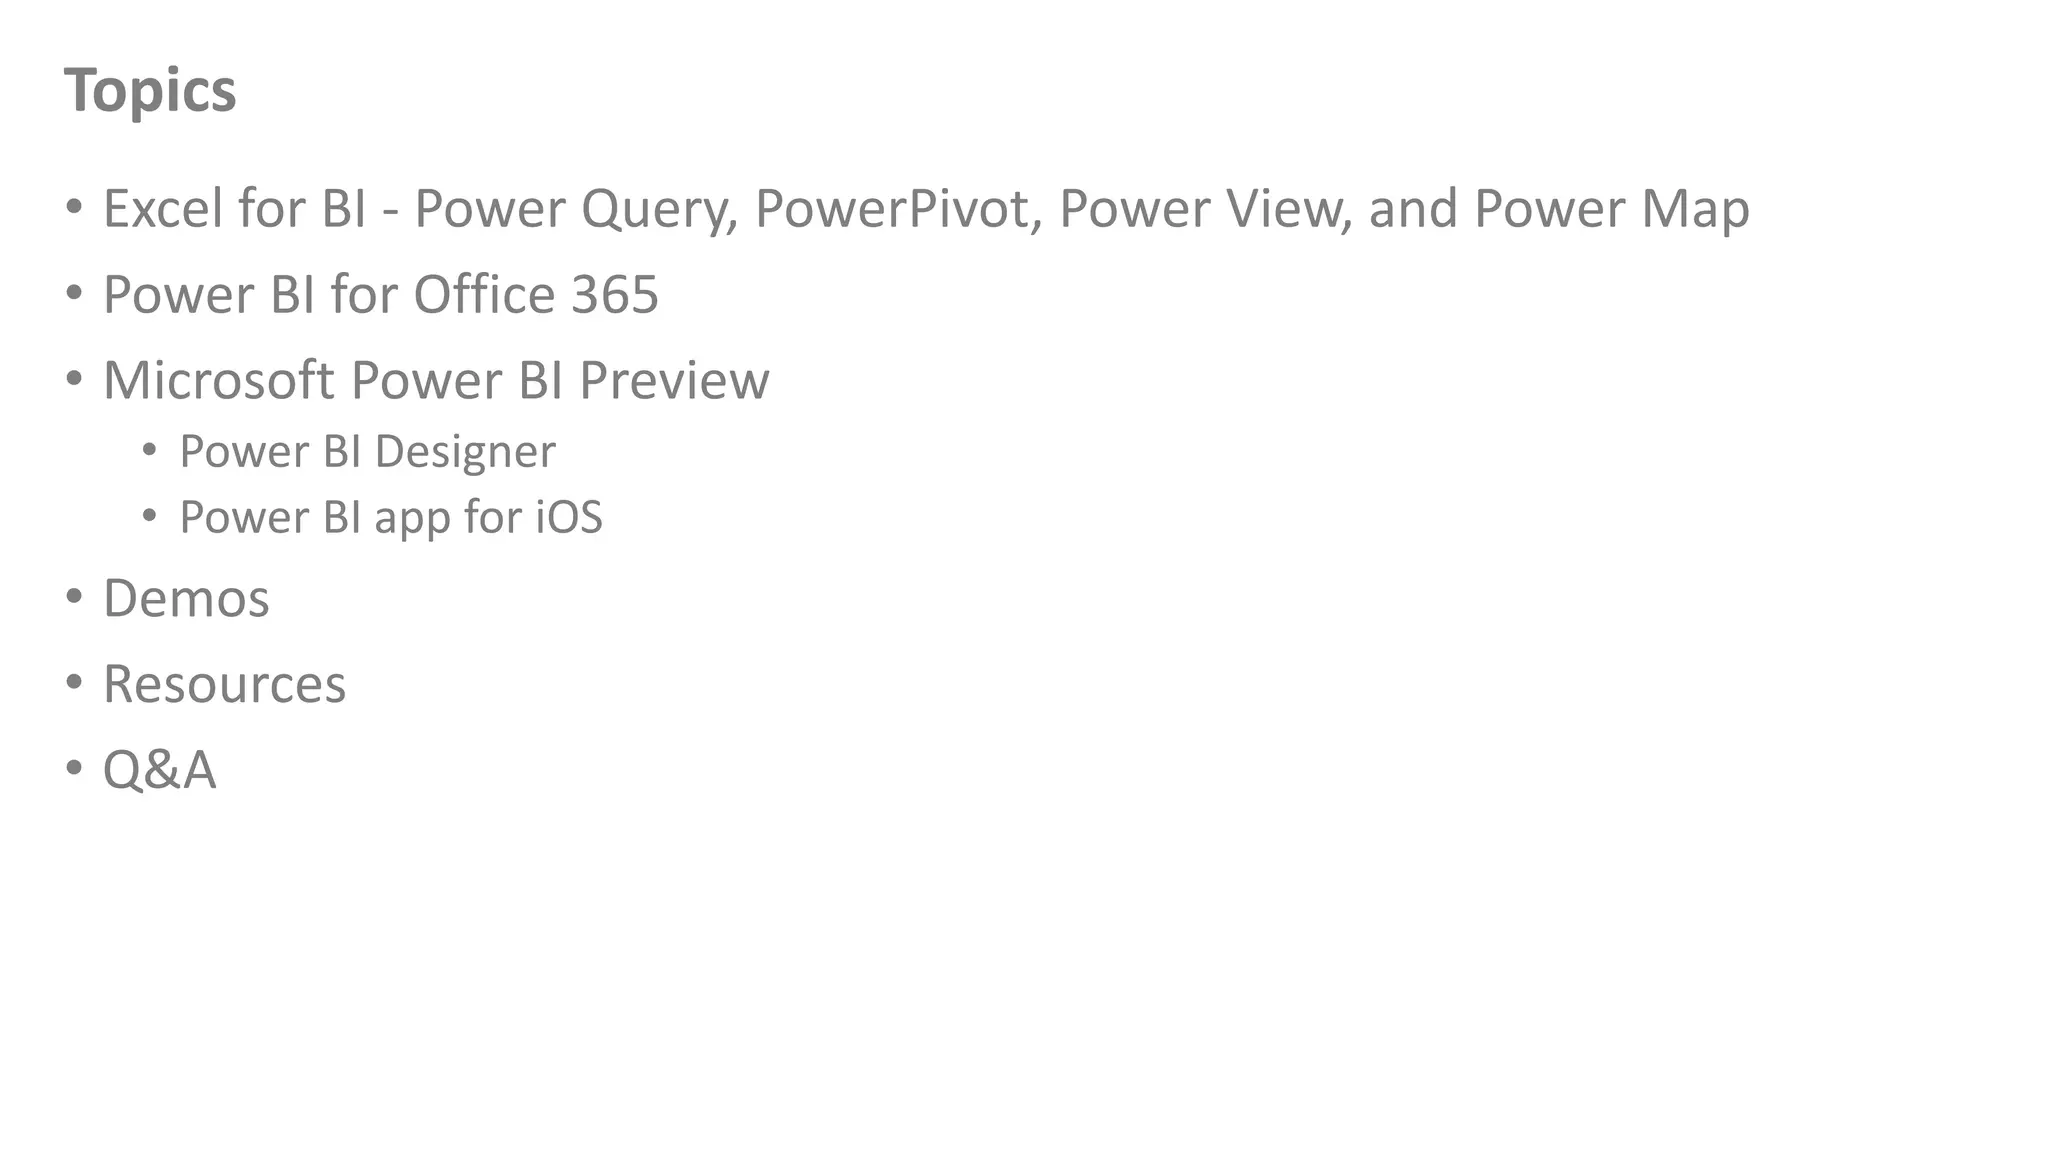
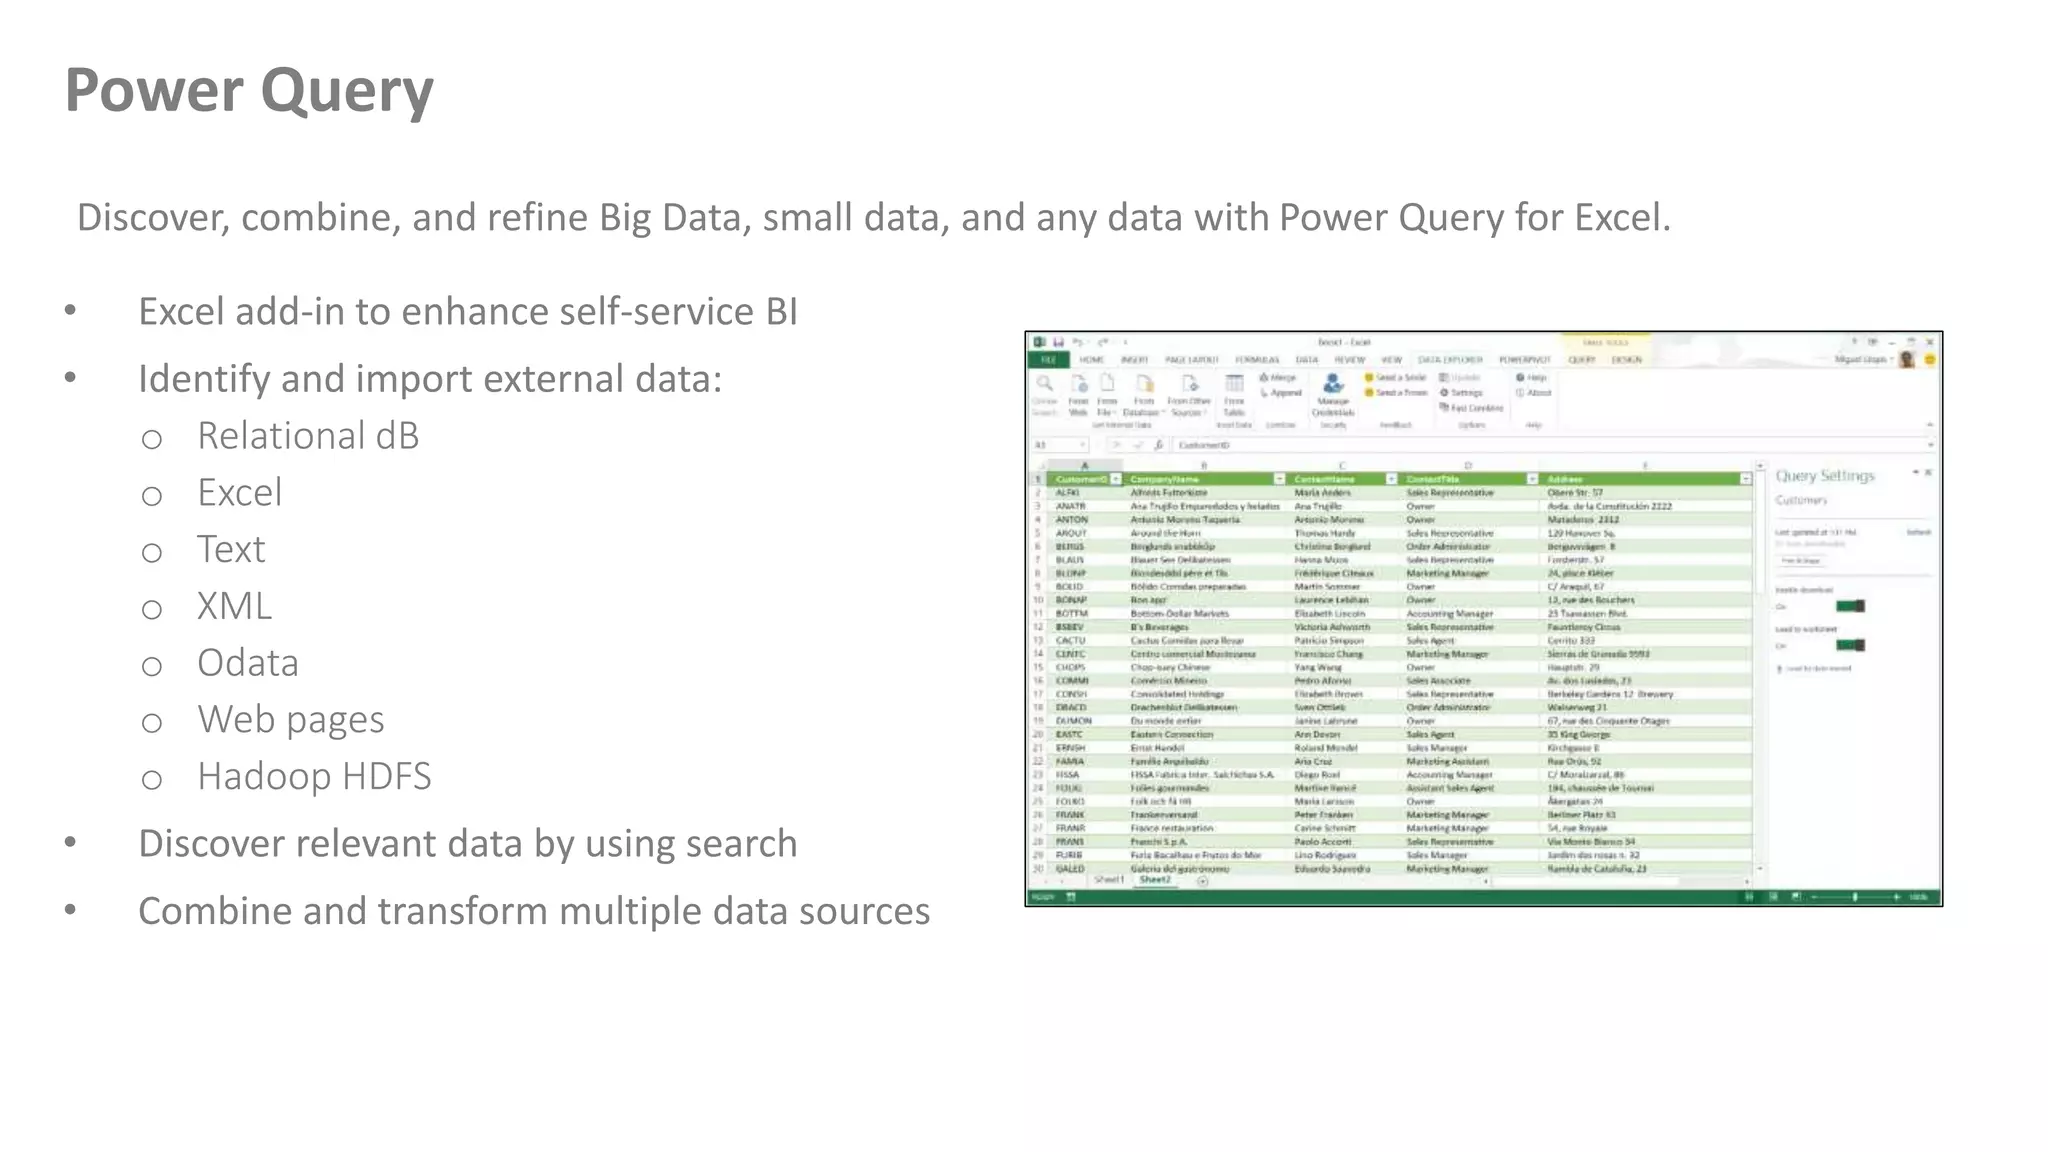
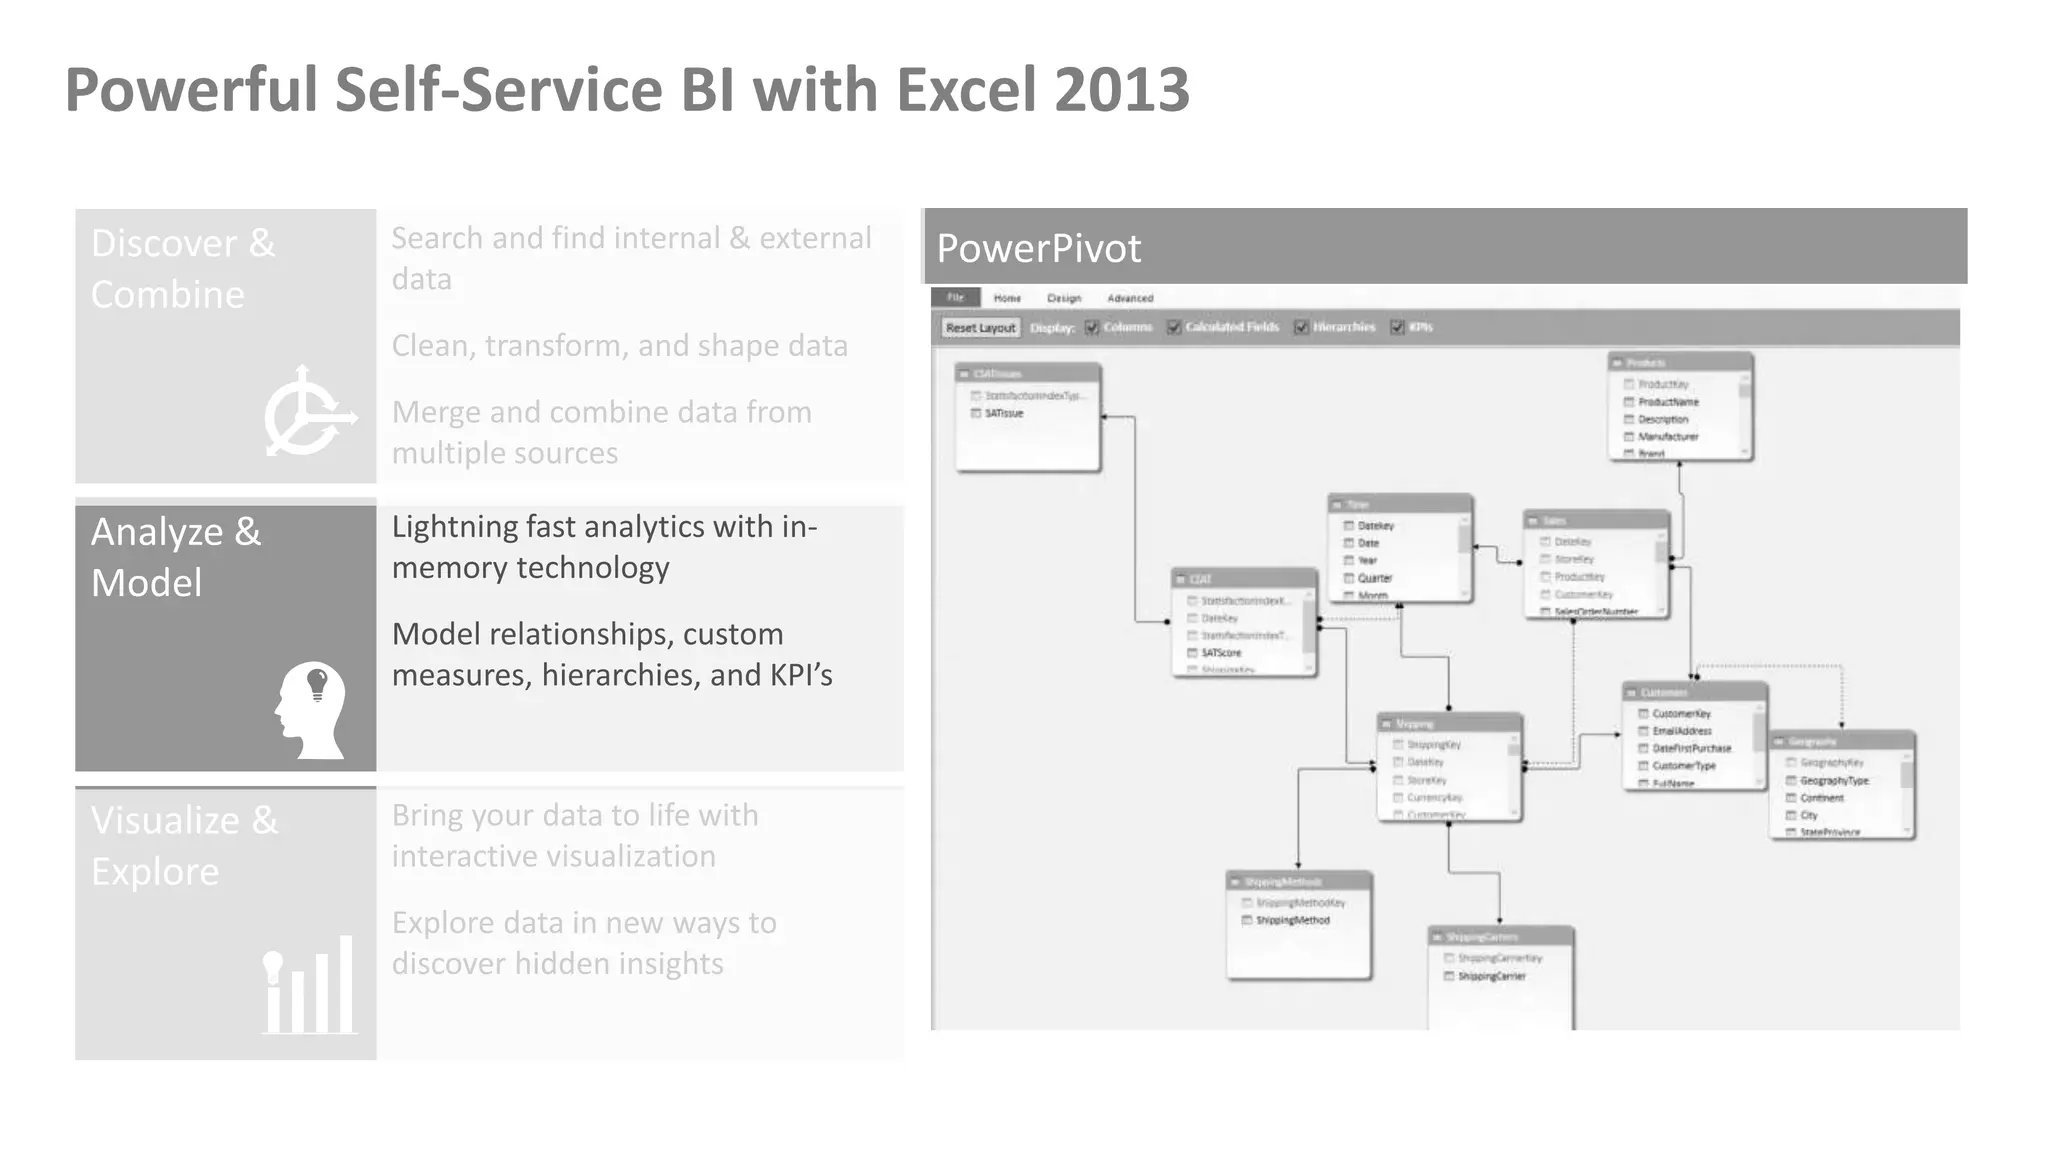
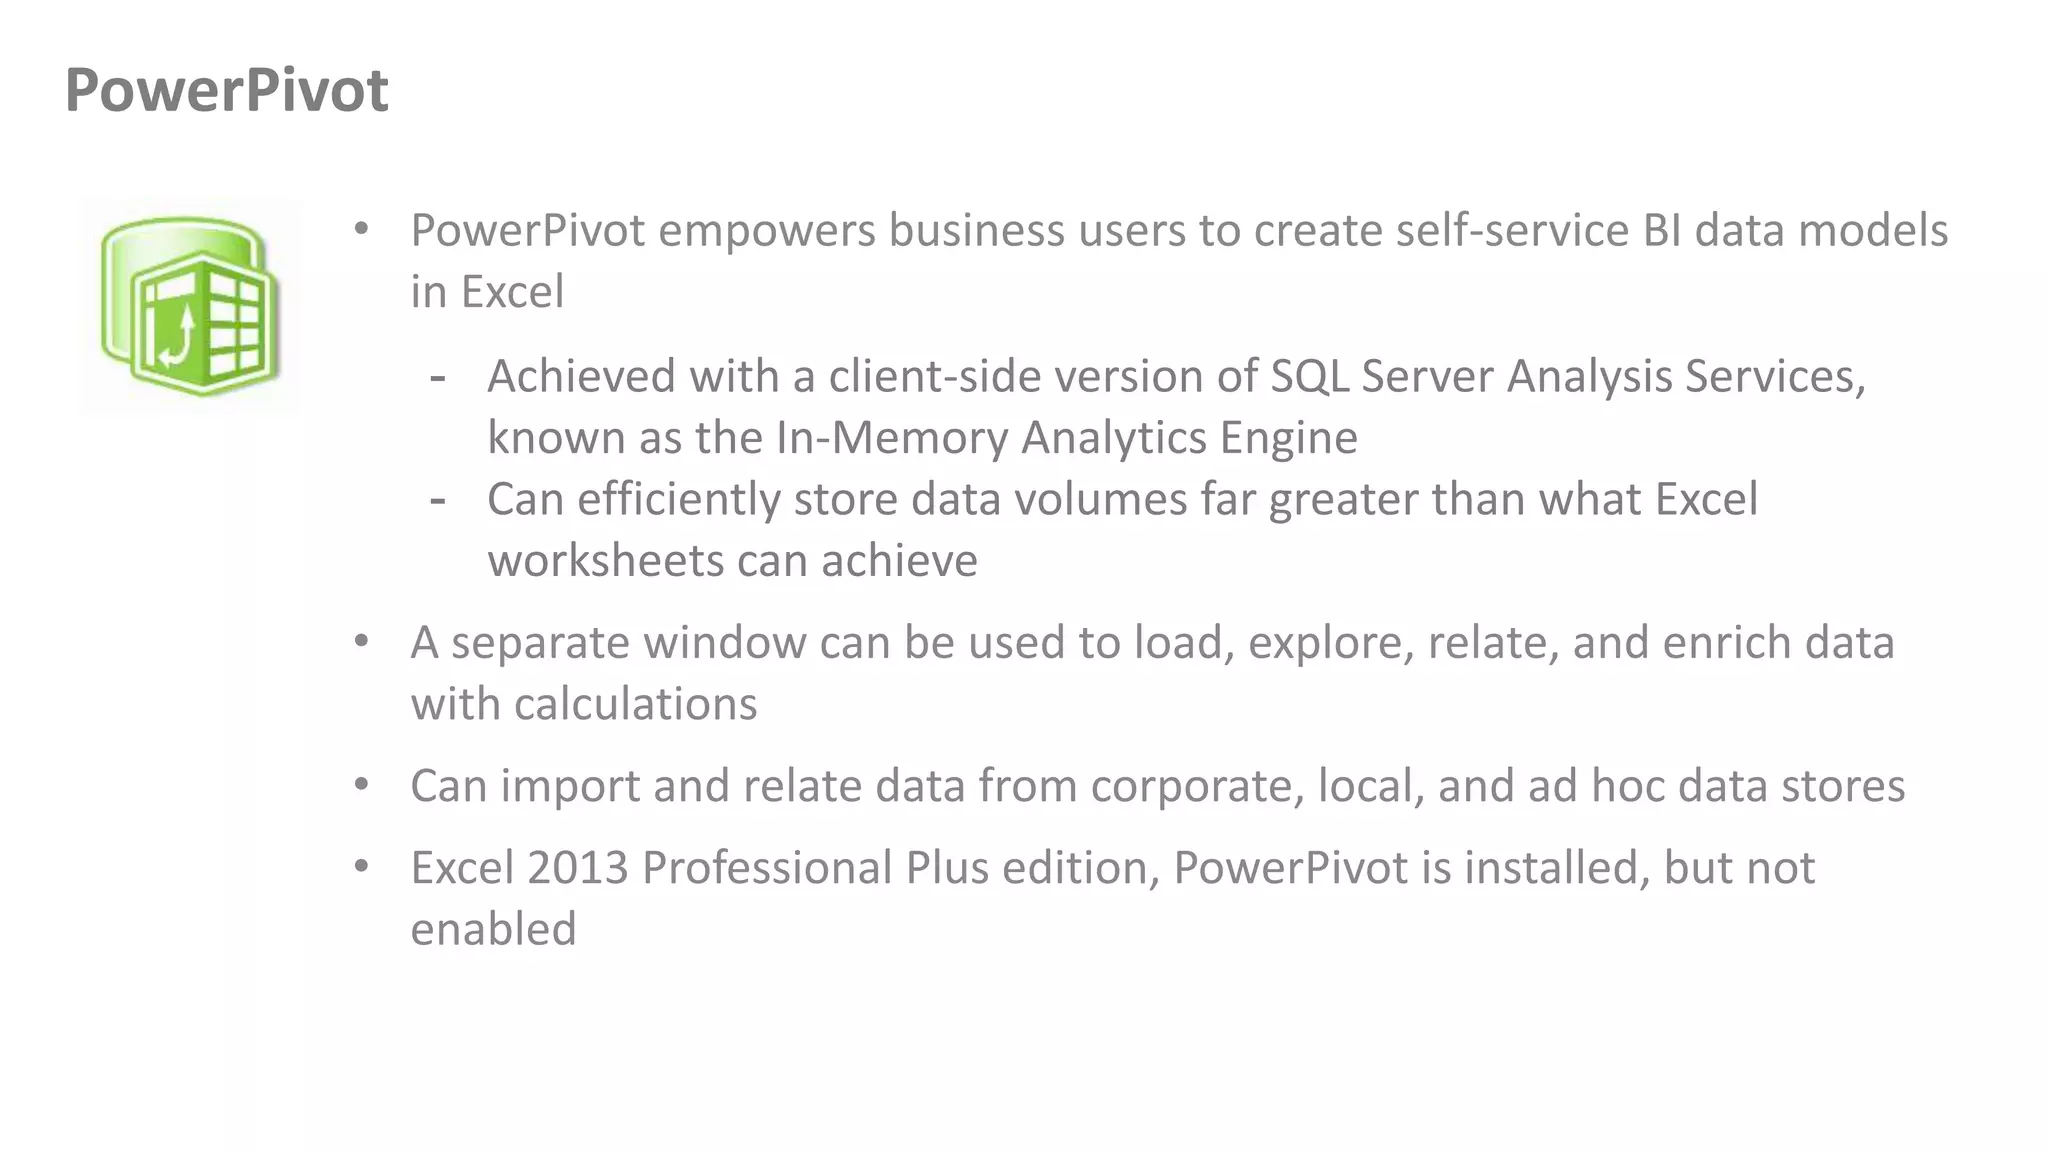
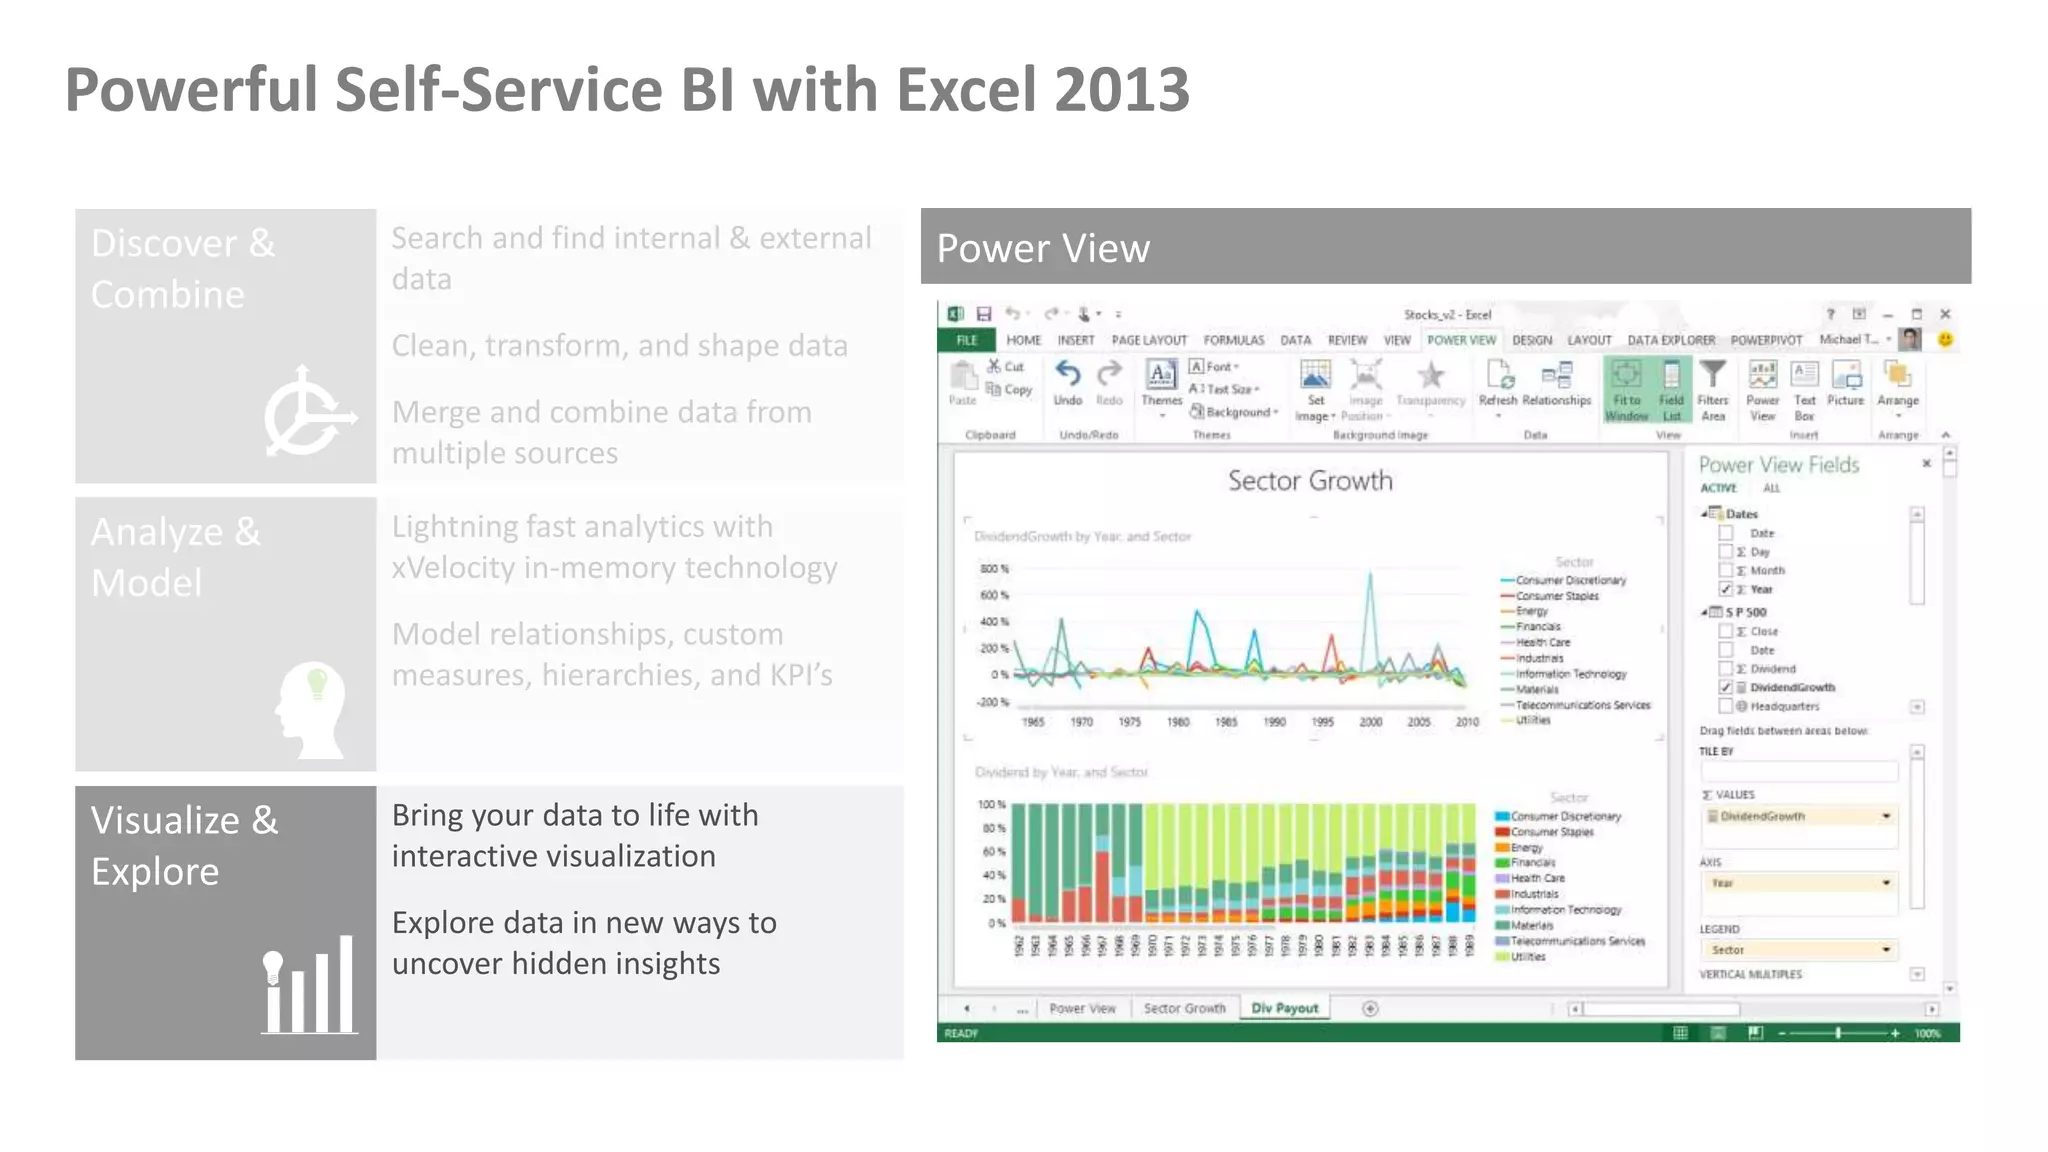
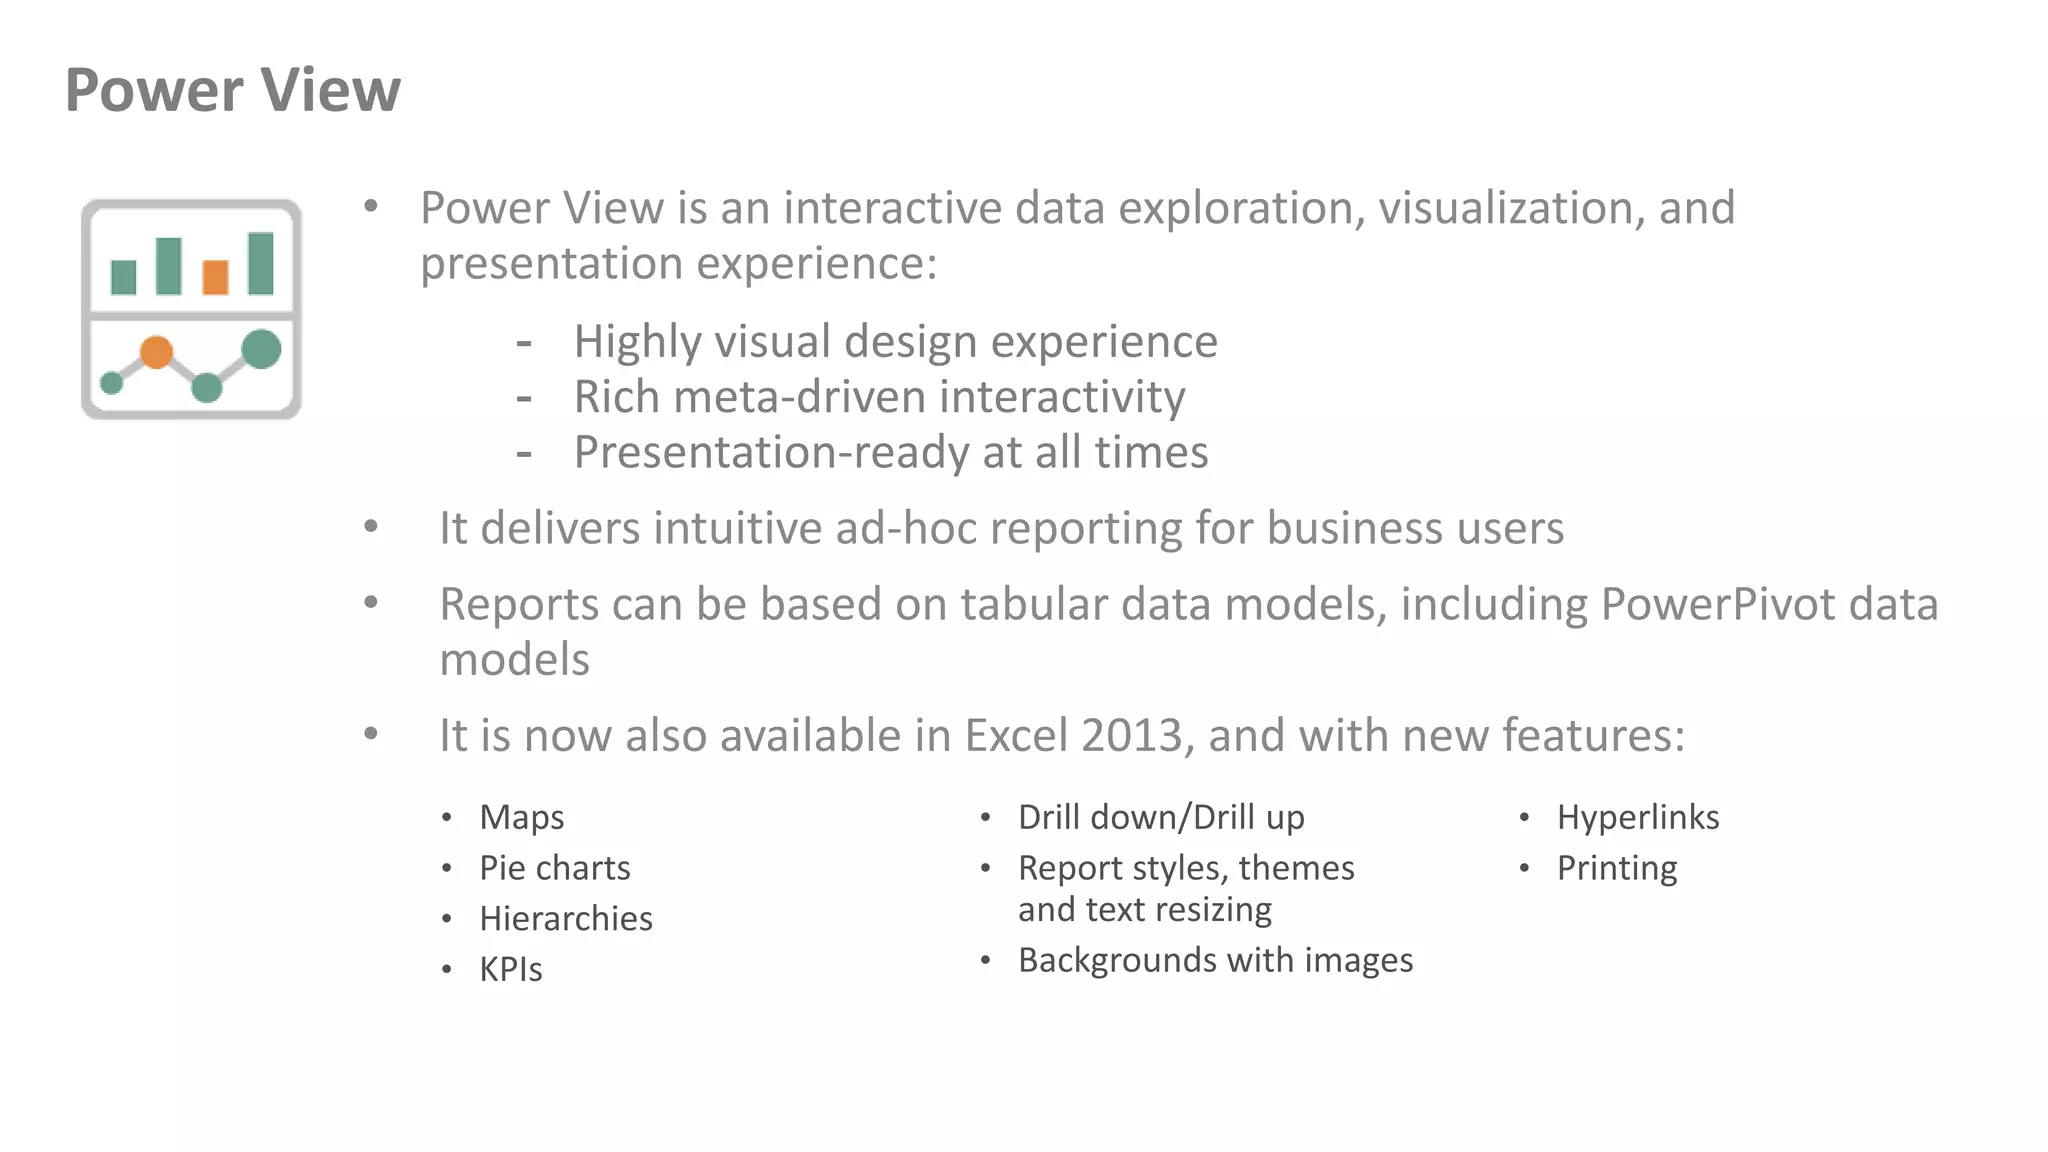
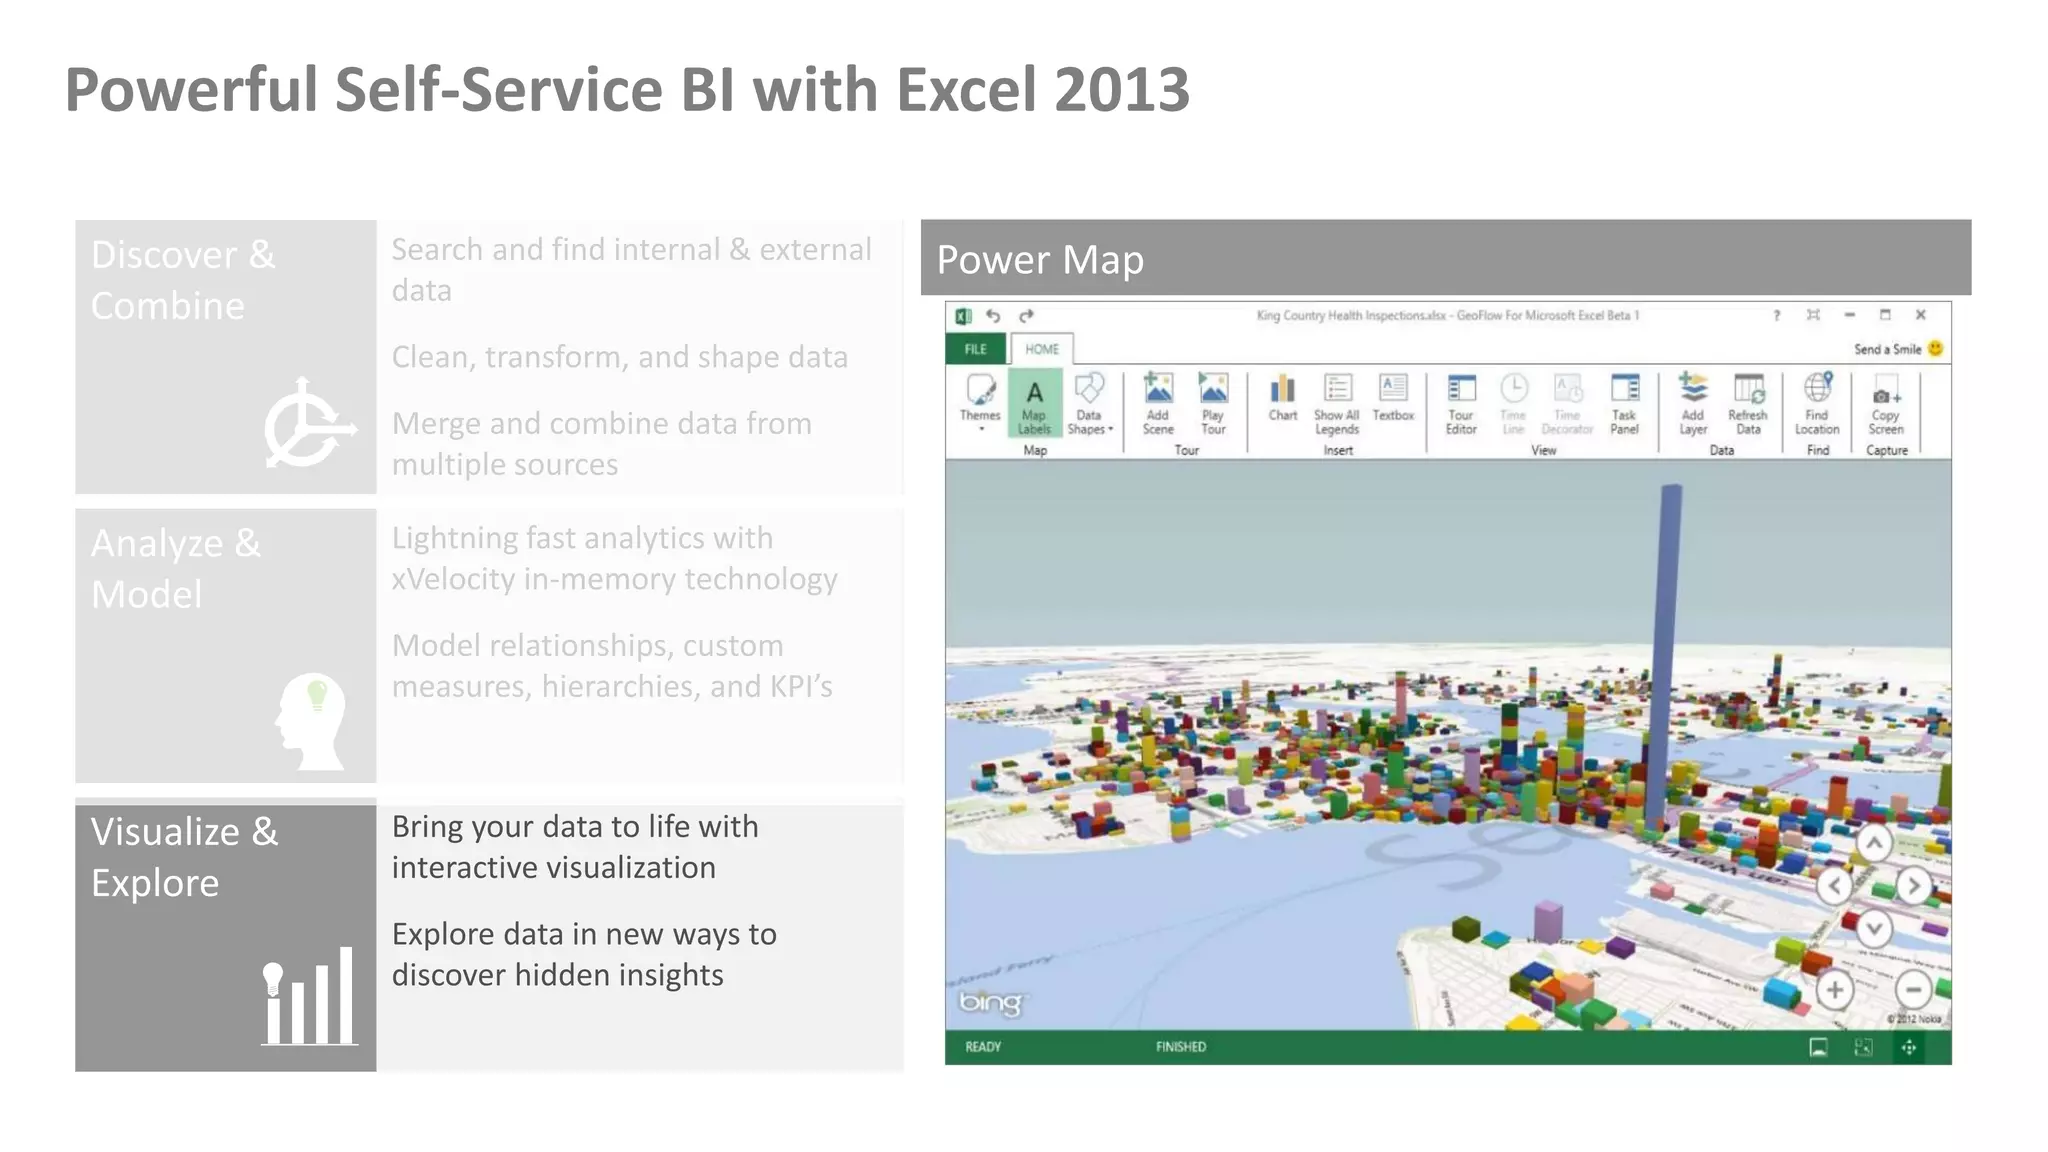
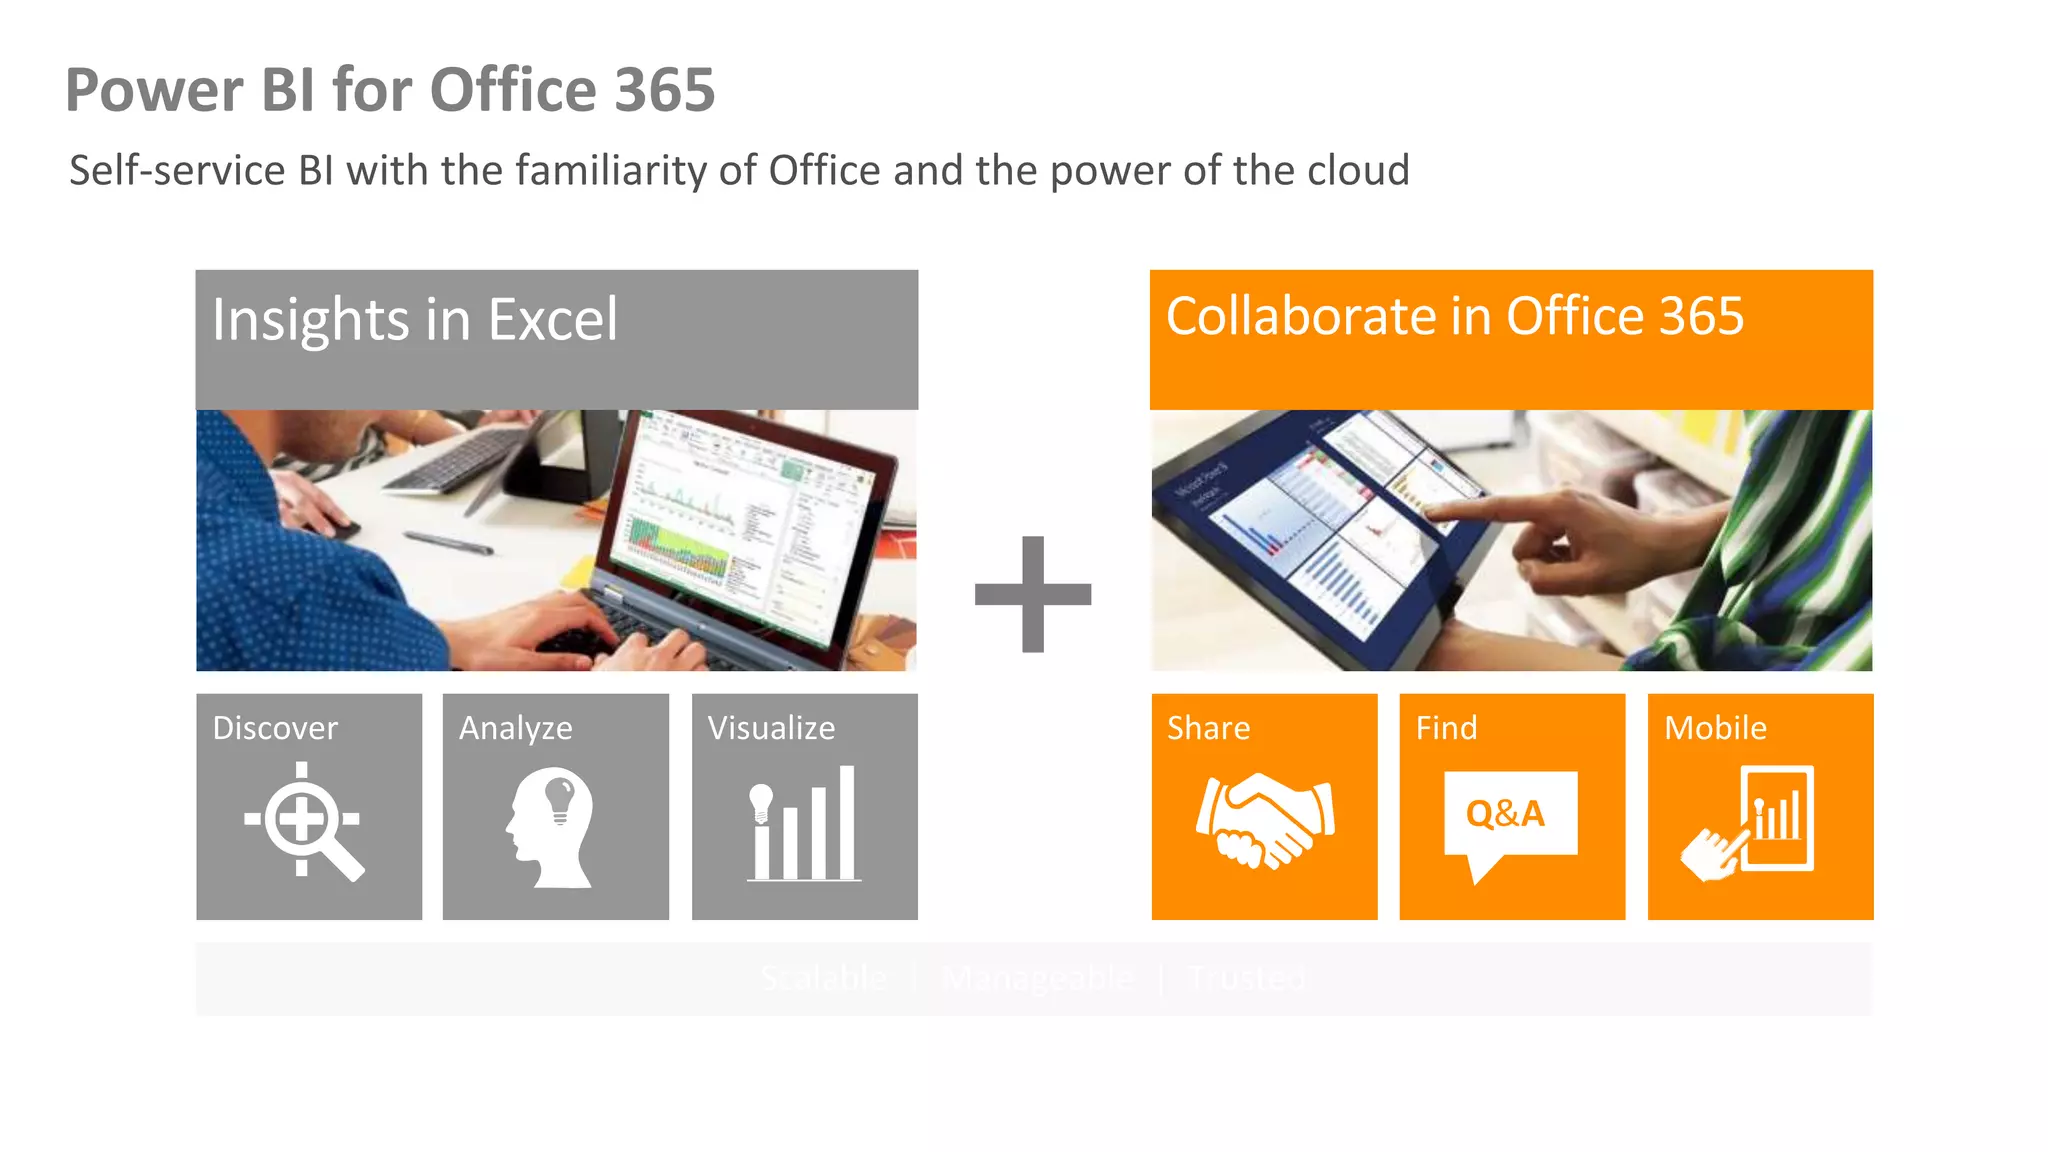
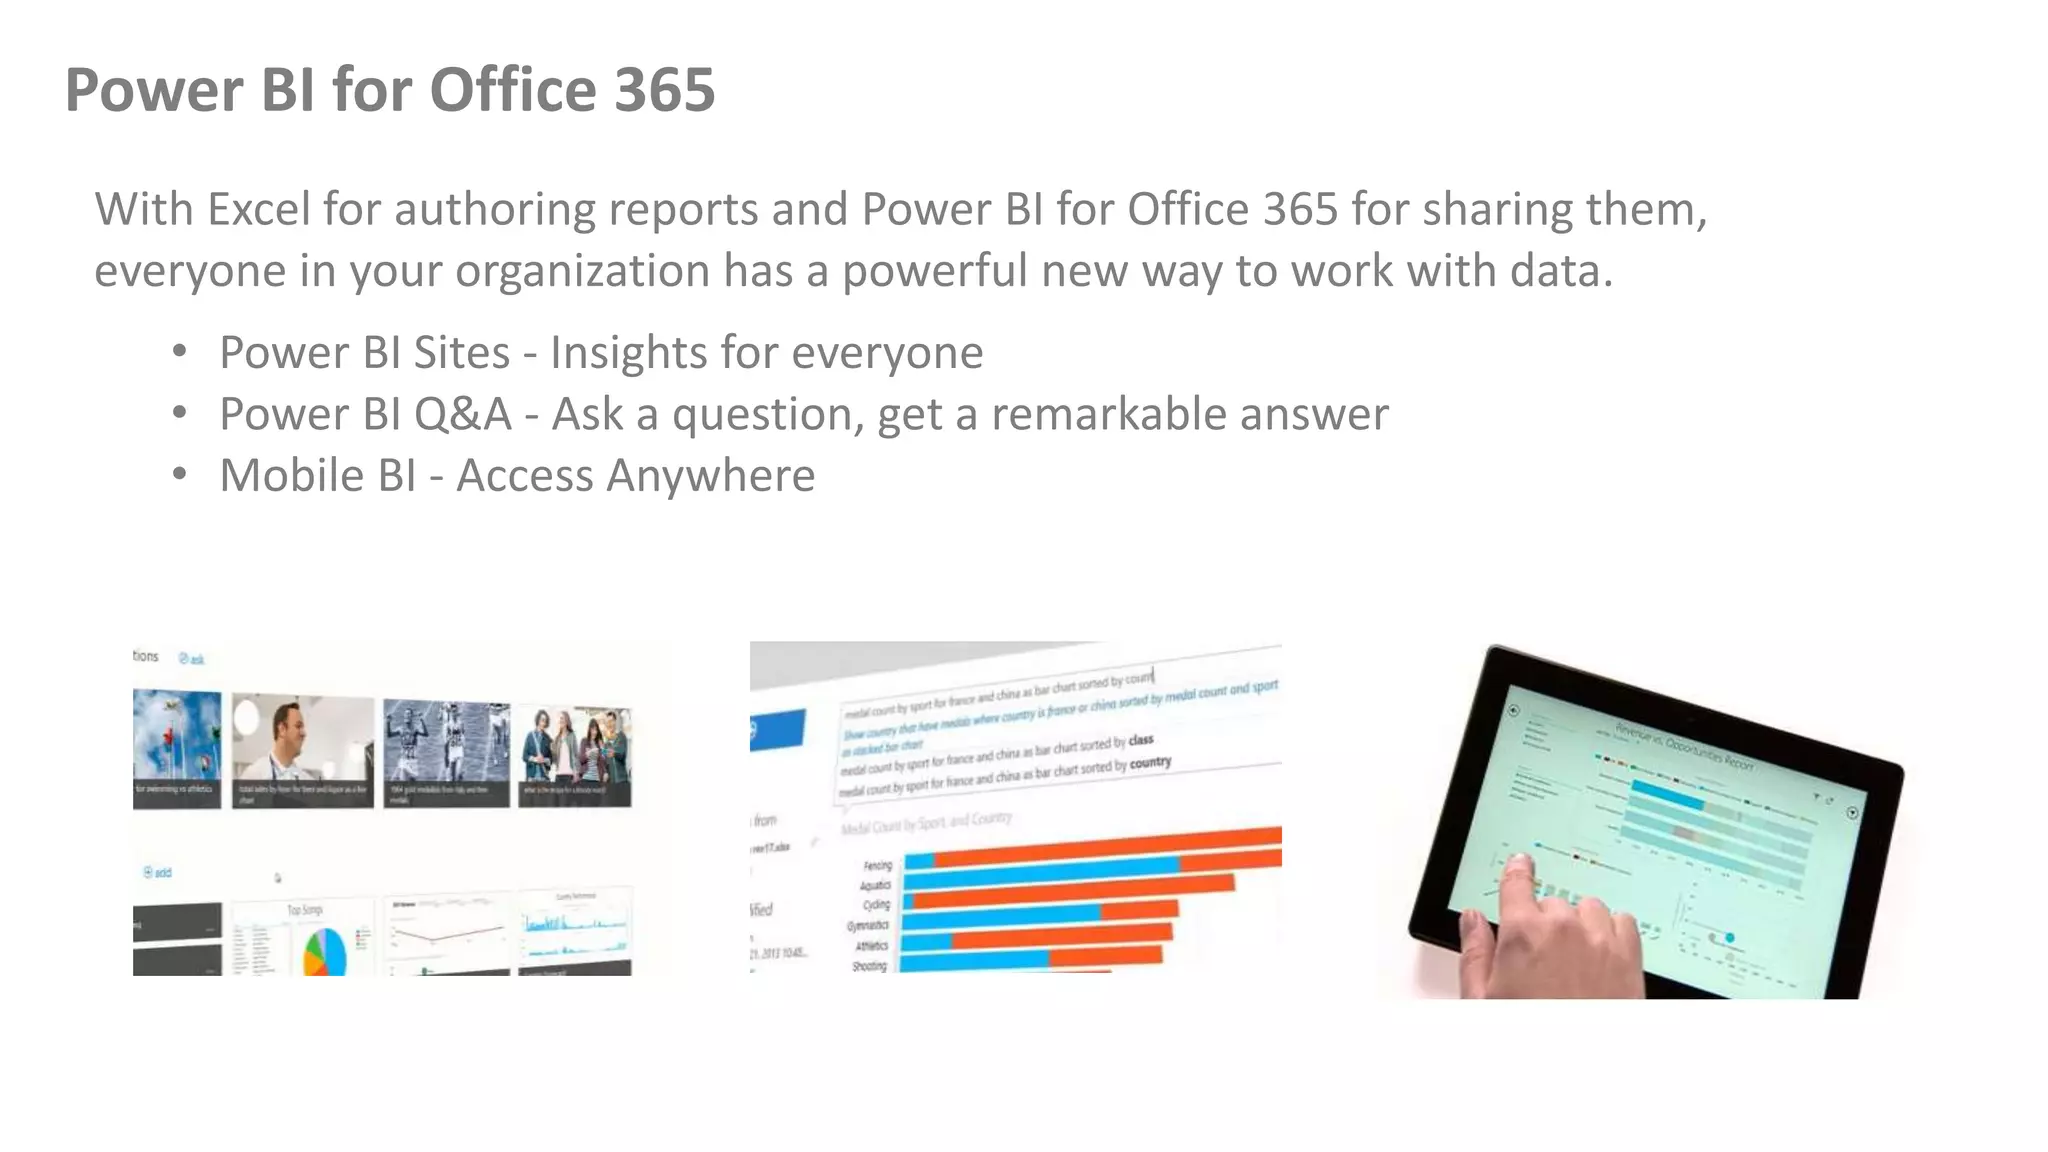
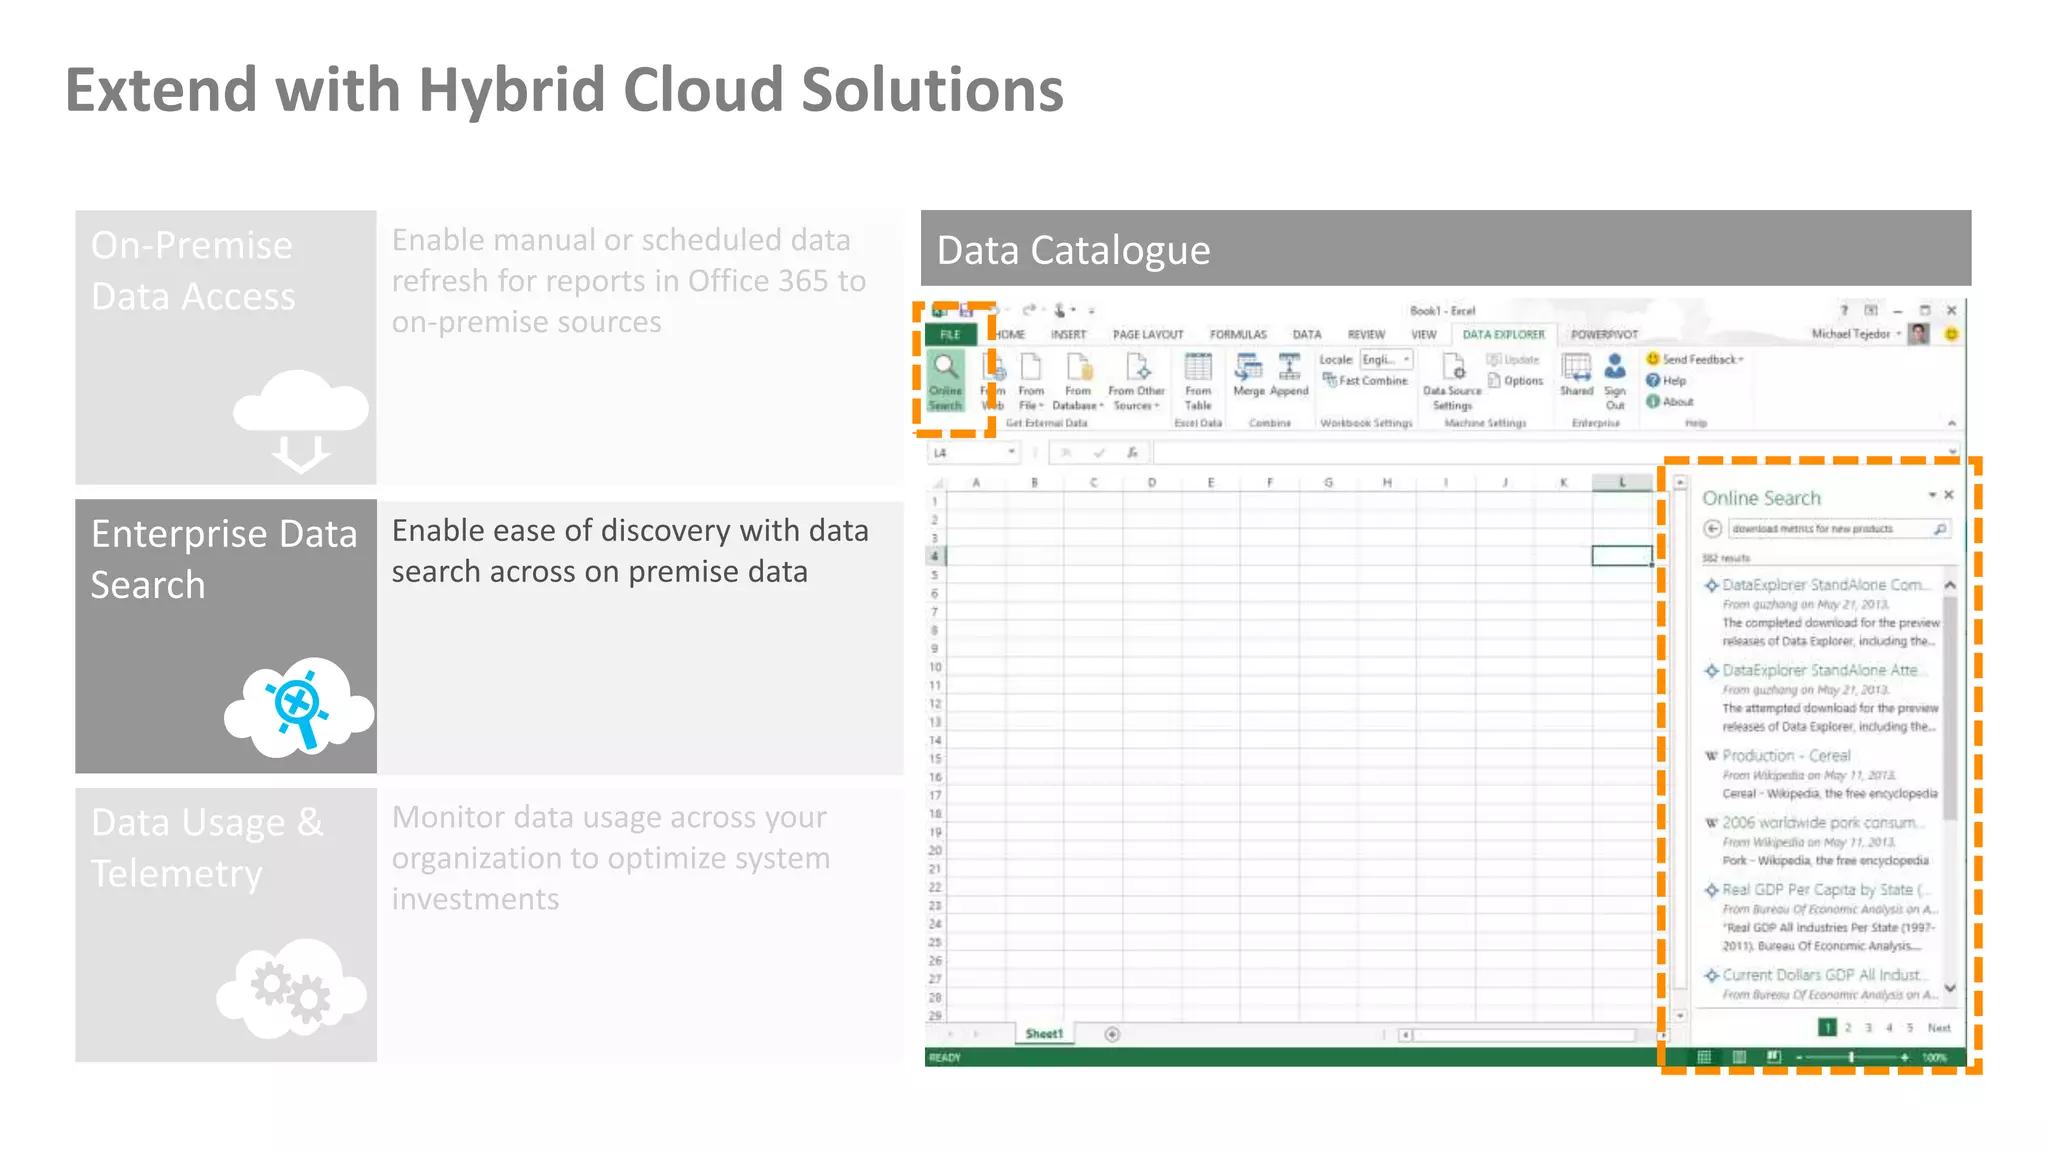
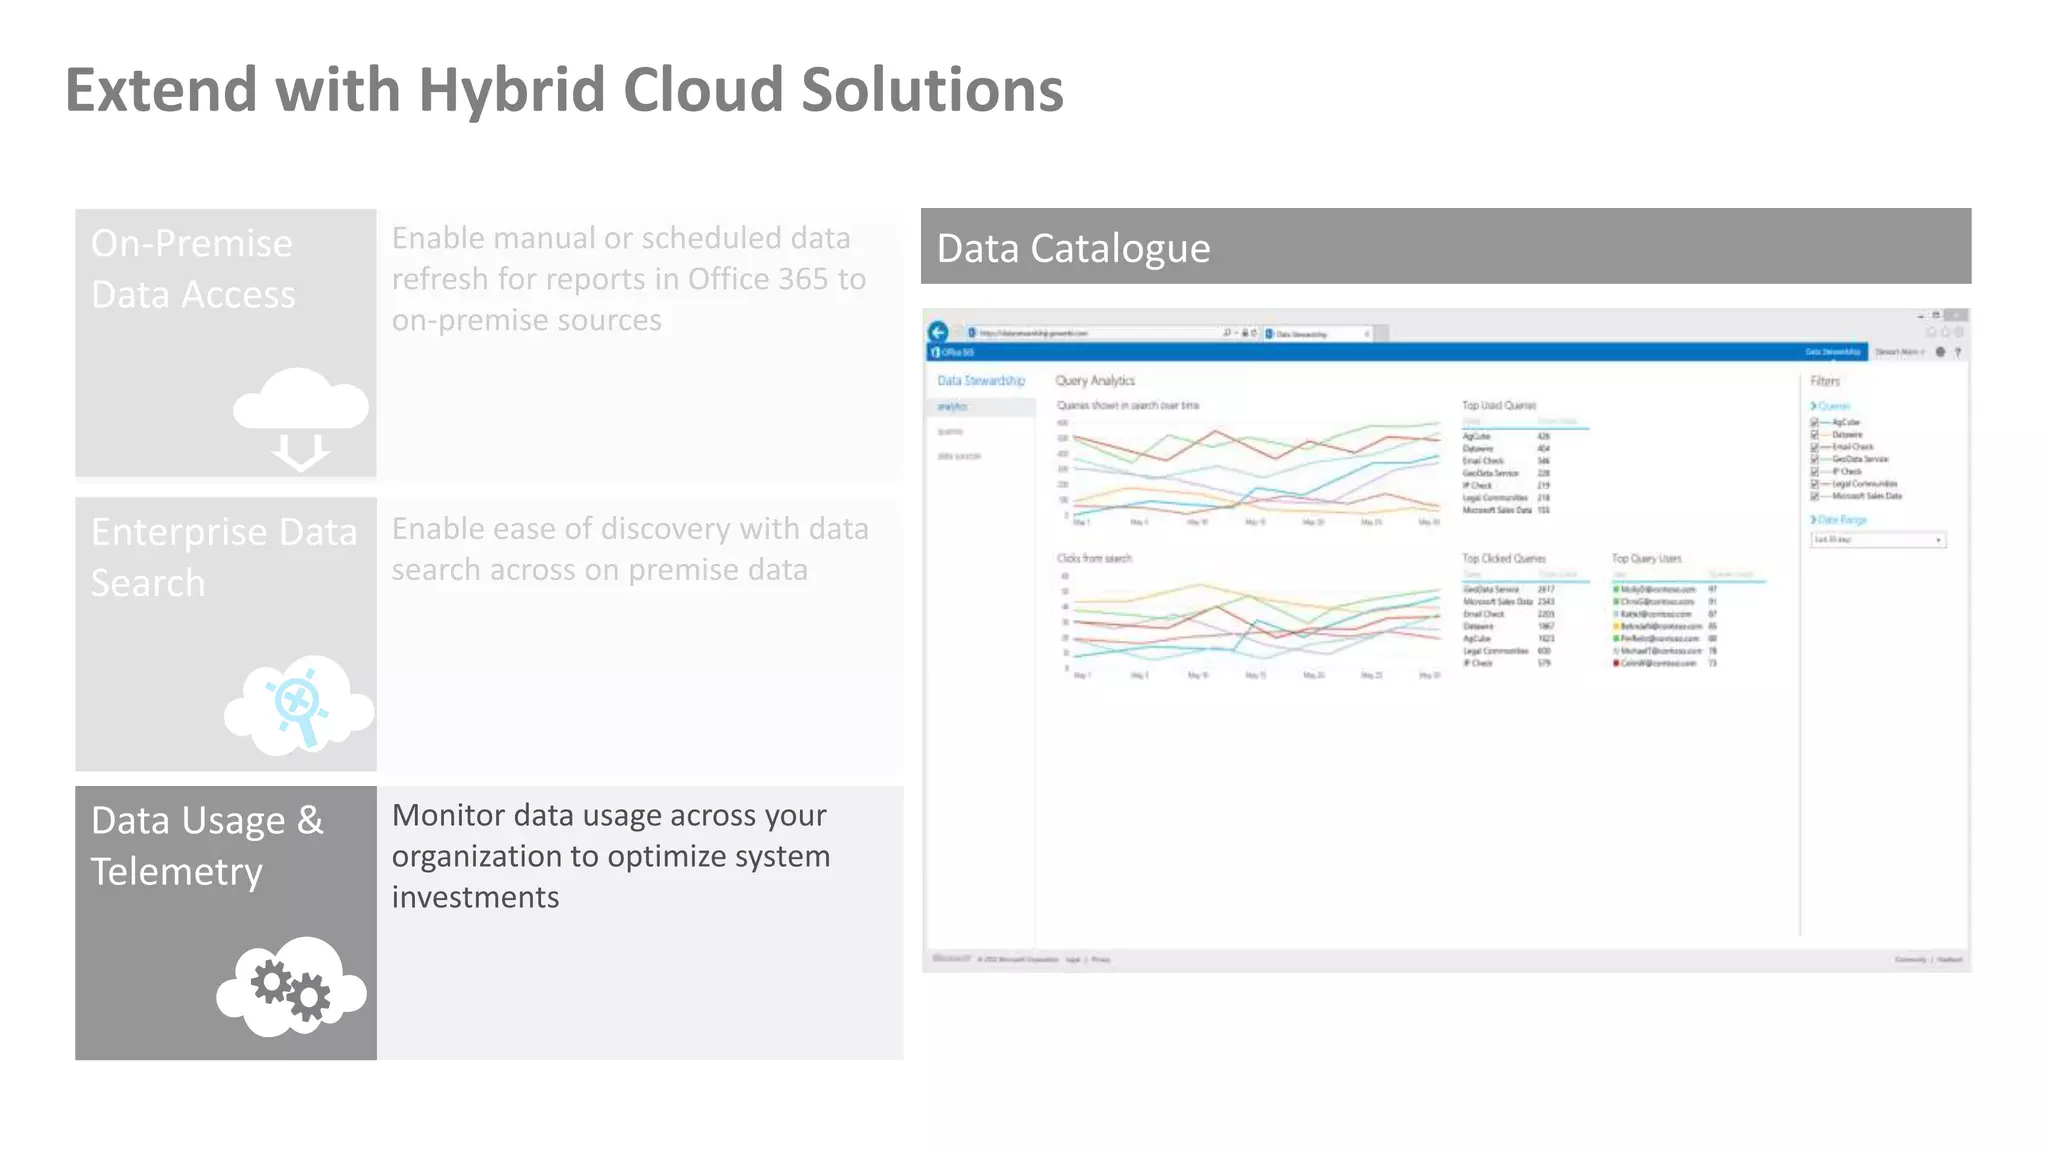
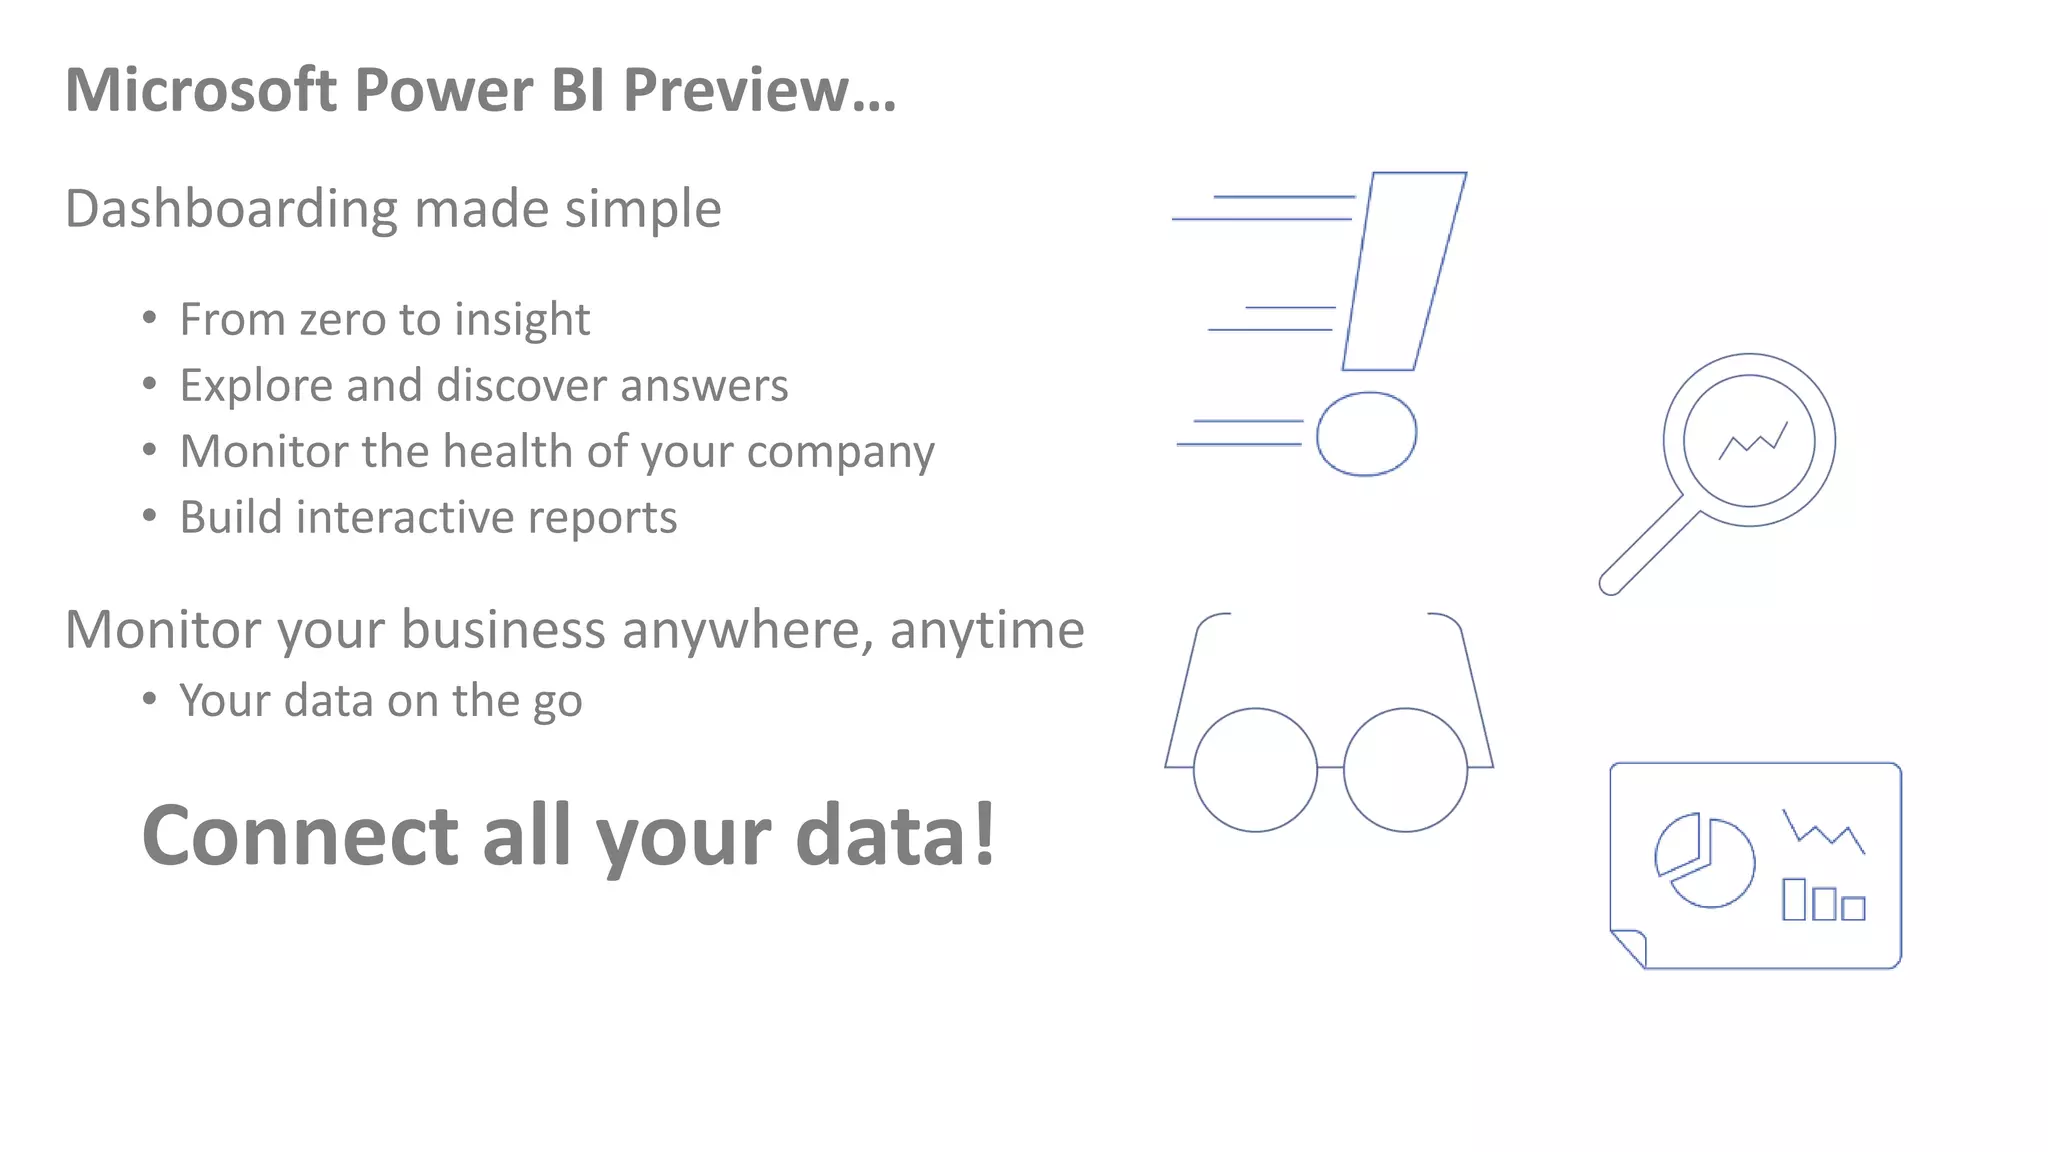
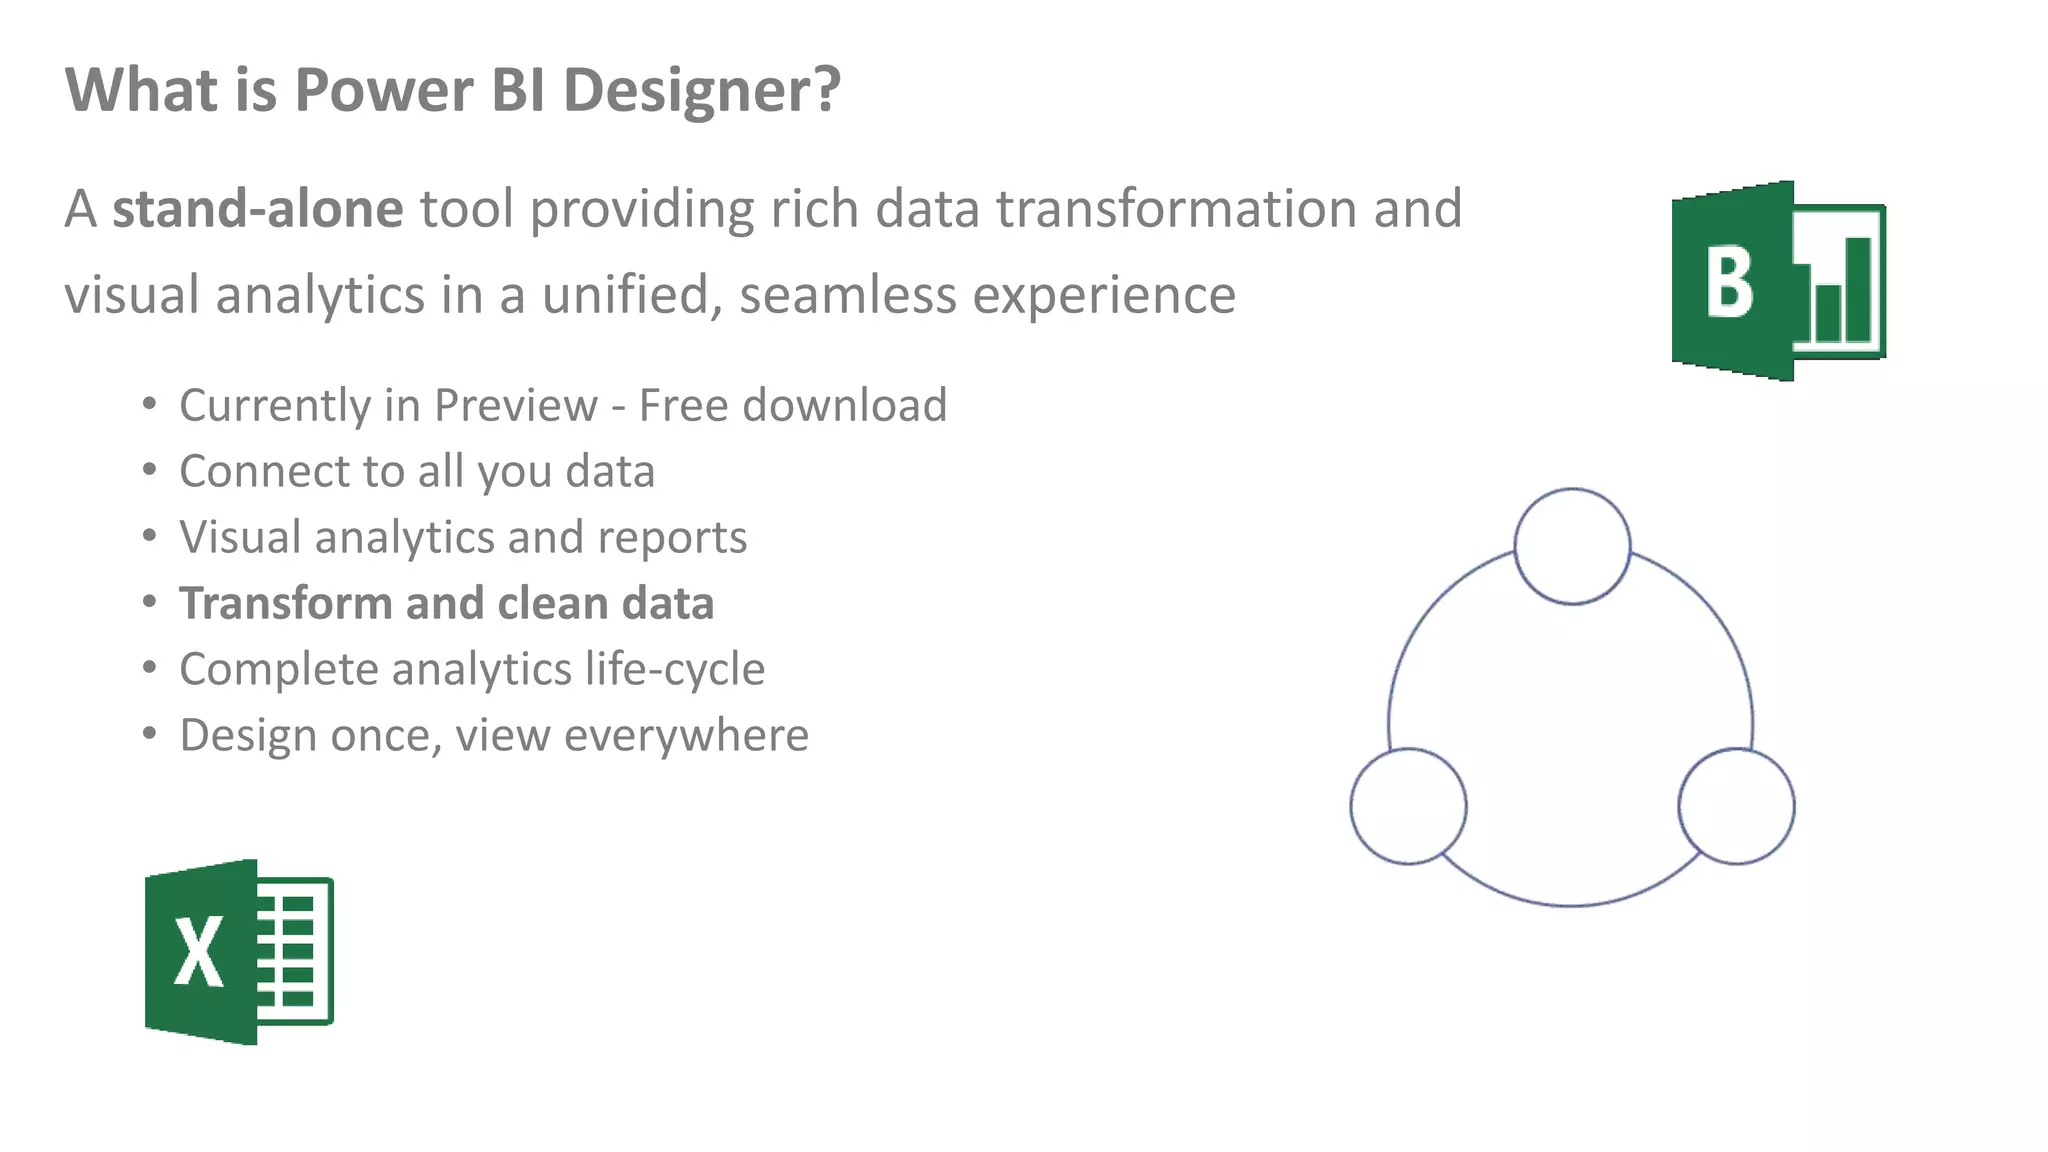
The document introduces Power BI tools for self-service business intelligence including Excel add-ins like Power Query, PowerPivot, Power View, and Power Map. It also discusses Power BI for Office 365, the Power BI Preview, Power BI Designer, and the Power BI app. The presenter demonstrates these tools and provides resources for learning more.


![Vibe Coding vs. Spec-Driven Development [Free Meetup]](https://cdn.slidesharecdn.com/ss_thumbnails/vibecodingvsspecdrivendevelopment-251209105622-43f455e7-thumbnail.jpg?width=640&height=640&fit=bounds)


