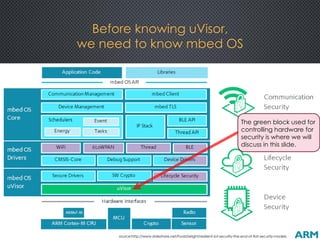
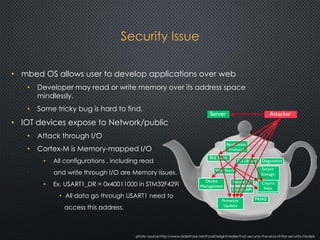
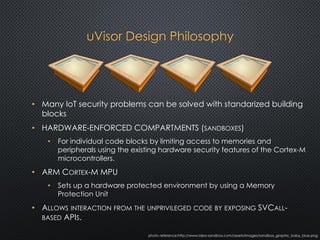
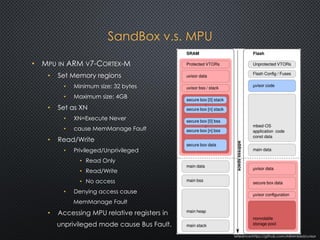
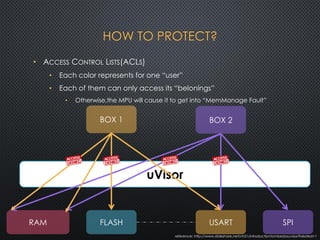
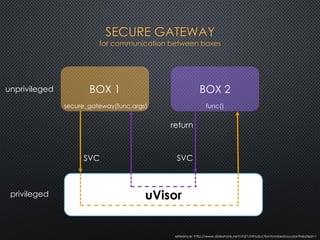
ARM uVisor
Debug Refinement Project
STUDENTS’ INFORMATION TECHNOLOGY CONFERENCE
2016,TAIWAN
張家榮
Jared
jaredcjr.tw@gmail.com
National Cheng Kung University
Department of Engineering Science
• A university student wants to have a
representative work before graduating.
• I used to develop embedded
applications.
(Once won the championship in the
Realtek Semiconductor Ameba IOT
competition)
• Try to know more about system software.
• Then…I found jserv…
Who and Why?
Before knowing uVisor,
we need to know mbed OS
source:http://www.slideshare.net/FoolsDelight/resilient-iot-security-the-end-of-flat-security-models
The green block used for
controlling hardware for
security is where we will
discuss in this slide.
Security Issue
• mbed OS allows user to develop applications over web
• Developer may read or write memory over its address space
mindlessly.
• Some tricky bug is hard to find.
• IOT devices expose to Network/public
• Attack through I/O
• Cortex-M is Memory-mapped I/O
• All configurations , including read
and write through I/O are Memory issues.
• Ex. USART1_DR = 0x40011000 in STM32F429i
• All data go through USART1 need to
access this address.
photo source:http://www.slideshare.net/FoolsDelight/resilient-iot-security-the-end-of-flat-security-models
uVisor Design Philosophy
• Many IoT security problems can be solved with standarized building
blocks
• HARDWARE-ENFORCED COMPARTMENTS (SANDBOXES)
• For individual code blocks by limiting access to memories and
peripherals using the existing hardware security features of the Cortex-M
microcontrollers.
• ARM CORTEX-M MPU
• Sets up a hardware protected environment by using a Memory
Protection Unit
• ALLOWS INTERACTION FROM THE UNPRIVILEGED CODE BY EXPOSING SVCALL-
BASED APIS.
photo reference:http://www.idea-sandbox.com/assets/images/sandbox_graphic_baby_blue.png
SandBox v.s. MPU
• MPU IN ARM V7-CORTEX-M
• Set Memory regions
• Minimum size: 32 bytes
• Maximum size: 4GB
• Set as XN
• XN=Execute Never
• cause MemManage Fault
• Read/Write
• Privileged/Unprivileged
• Read Only
• Read/Write
• No access
• Denying access cause
MemManage Fault
• Accessing MPU relative registers in
unprivileged mode cause Bus Fault.
reference:https://github.com/ARMmbed/uvisor
HOW TO PROTECT?
reference: http://www.slideshare.net/vh21/introductiontombedosuvisor?related=1
uVisor
SPIUSARTFLASHRAM
BOX 2BOX 1
• ACCESS CONTROL LISTS(ACLS)
• Each color represents for one “user”
• Each of them can only access its “belonings”
• Otherwise,the MPU will cause it to get into “MemManage Fault”
SECURE GATEWAY
for communication between boxes
uVisor
BOX 1
secure_gateway(func,args)
BOX 2
func()
SVC SVC
return
unprivileged
privileged
reference: http://www.slideshare.net/vh21/introductiontombedosuvisor?related=1
Current debugging
• LED PATTERN
• Hard to know
what caused this issue.
• May difficult to reappear
the condition.
• SEMI-HOST
• Based on SVC
• Output/Input through GDB
• ON-CHIP DEBUGGER
• ST-LINK/J-Link
• wired
Error reason RED LED blinks
PERMISSION_DENIED 1
SANITY_CHECK_FAILED 2
NOT_IMPLEMENTED 3
NOT_ALLOWED 4
FAULT_MEMMANAGE 5
FAULT_BUS 6
FAULT_USAGE 7
FAULT_HARD 8
FAULT_DEBUG 9
(gdb) b main.cpp:44
Breakpoint 1 at 0x8000a5e: file main.cpp, line 44.
(gdb) where
#0 us_ticker_read () at ../../external/mbed/libraries/mbed/targets/hal/TARGET_STM/TARGET_STM32F4/us_ticker.c:50
#1 0x0800379e in wait_us (us=500000) at ../../external/mbed/libraries/mbed/common/wait_api.c:29
#2 0x08003766 in wait (s=0.5) at ../../external/mbed/libraries/mbed/common/wait_api.c:20
#3 0x08000a5e in main () at main.cpp:43
(gdb) c
Continuing.
Breakpoint 1, main () at main.cpp:44
44 myled = 0;
(gdb) p/x i
$1 = 0x1
GDB
• WITH GNU DEBUGGER,YOU CAN…
Look up
Memory
registers
…
Control execution
Singel Step
Single Instruction
Breakpoint
Watchpoint
…
How to improve it?
• CRASHDEBUG
• Tool to enable post-mortem debugging of Cortex-M crashes with GDB.
• CRASHCATCHER
• Catch Hard Faults on Cortex-M devices and save out a crash dump to
be used by CrashDebug.
• MRI(MONITOR FOR REMOTE INSPECTION)
• The gdb compatible debug monitor for Cortex-M devices.
• Running over any of the UART ports on the device.
• Get rid of On-Chip debugger.
• Wireless debug at any time and any where.
photo reference:http://shop.myavr.com/pic/articles/STM32F429-disco_g.png
Reference hardware:
STM32F429i-Discovery
CrashCatcher
• SAVE THE MEMORY CONTENT IN THE HARDFAULT_HANDLER
• Used by GDB+CrashDebug
• Send the content to remote host or save in the local flash memory.
• THE FORMAT MUST BE READABLE BY GDB WITH CRASHDEBUG
• Little-Edian
• registers content
• StartAddress-EndAddress
• Content
63430200
00000000
740200200000000000ED00E000000000
00000000000000000000000000000000
00000000000000000000000000000000
02000000
D0FF0220
950A0008A80B000800000021
03000020
0000002000C00120
00000320A15D0008ED5D0008FD0C0008
2B1F00082D1F00082F1F000800000000
000000000000000000000000ED5D0008
331F000800000000ED5D0008ED5D0008
ED5D0008ED5D0008ED5D0008ED5D0008
...
Original Project Developer : Adam Green(http://mbed.org/users/AdamGreen/) Reference hardware:
STM32F429i-Discovery
(gdb) c
Continuing.
Can't send signals to this remote system. SIGSEGV not sent.
**Hard Fault**
Status Register: 0x40000000
Forced
**Usage Fault**
Status Register: 0x08
Coprocessor Access
Program received signal SIGSEGV, Segmentation fault.
0x08000ba8 in dbg_vprintf (fmt=0x8000a3f <dbg_put_dec(uint32_t, int, char)+102> "", va=...)
at MyImplementationIO/usart:535
CrashDebug
• POST-MORTEM DEBUG
• With the crashed dump memory content,we can
• Let the GDB view it as an alive target.
• Use GDB commands.
• Seeing the critical variable value.
• View the location that causing the situation.
• backtrace
• HELP US TO KNOW WHAT HAPPENED.
Original Project Developer : Adam Green(http://mbed.org/users/AdamGreen/) Reference hardware:
STM32F429i-Discovery
Monitor for Remote Inspection
(MRI)
• ALLOWING TO USE GDB REMOTE DEBUGGING THROUGH ANY COMMUNICATION
METHOD(WIRELESS IS POSSIBLE)
• Replace On-Chip debugger
• Currently support USART in STM32F429i-Discovery Cortex-M4 devices.
• GDB REMOTE SERIAL PROTOCOL
• Communicating with host GDB.
• Get commands by modifying USART handler.
• According to the commands sent from host GDB
• MRI sets the debug monitor in Cortex-M devices.
• DEBUG MONITOR
• One of the two debugging methods in Cortex-M devices.
• Halt mode
• debug monitor
• Based on exception handler
photo reference:https://www.segger.com/cms/admin/uploads/imageBox/J-Link-PRO_left_shadow_350x.jpg
Original Project Developer : Adam Green(http://mbed.org/users/AdamGreen/) Reference hardware:
STM32F429i-Discovery
Ad-Hoc Debugging
future framework between debugger and debuggee
Reference hardware:
STM32F429i-Discovery
dashed line represents for any communication way,such as USART or Bluetooth.
Debug Box
CrashCatcher
MRI
System 1
remote GDB
System 2
Save
CrashCatcher
dump
GDB with
CrashDebug
uVisor
Application BOX(s)
with
access permission
in the ACLs of the
Debug Box
Q&A
THANKS FOR LISTENING!
Especially thanks for (The order does not represent for any significance)
jserv jserv.tw@gmail.com
George Kang georgekang03@gmail.com
Adam Green http://mbed.org/users/AdamGreen/
Milosch Meriac https://meriac.com/

ARM uVisor Debug Refinement Project(debugging facility improvements)

  • 1.
    ARM uVisor Debug RefinementProject STUDENTS’ INFORMATION TECHNOLOGY CONFERENCE 2016,TAIWAN 張家榮 Jared jaredcjr.tw@gmail.com National Cheng Kung University Department of Engineering Science
  • 2.
    • A universitystudent wants to have a representative work before graduating. • I used to develop embedded applications. (Once won the championship in the Realtek Semiconductor Ameba IOT competition) • Try to know more about system software. • Then…I found jserv… Who and Why?
  • 3.
    Before knowing uVisor, weneed to know mbed OS source:http://www.slideshare.net/FoolsDelight/resilient-iot-security-the-end-of-flat-security-models The green block used for controlling hardware for security is where we will discuss in this slide.
  • 4.
    Security Issue • mbedOS allows user to develop applications over web • Developer may read or write memory over its address space mindlessly. • Some tricky bug is hard to find. • IOT devices expose to Network/public • Attack through I/O • Cortex-M is Memory-mapped I/O • All configurations , including read and write through I/O are Memory issues. • Ex. USART1_DR = 0x40011000 in STM32F429i • All data go through USART1 need to access this address. photo source:http://www.slideshare.net/FoolsDelight/resilient-iot-security-the-end-of-flat-security-models
  • 5.
    uVisor Design Philosophy •Many IoT security problems can be solved with standarized building blocks • HARDWARE-ENFORCED COMPARTMENTS (SANDBOXES) • For individual code blocks by limiting access to memories and peripherals using the existing hardware security features of the Cortex-M microcontrollers. • ARM CORTEX-M MPU • Sets up a hardware protected environment by using a Memory Protection Unit • ALLOWS INTERACTION FROM THE UNPRIVILEGED CODE BY EXPOSING SVCALL- BASED APIS. photo reference:http://www.idea-sandbox.com/assets/images/sandbox_graphic_baby_blue.png
  • 6.
    SandBox v.s. MPU •MPU IN ARM V7-CORTEX-M • Set Memory regions • Minimum size: 32 bytes • Maximum size: 4GB • Set as XN • XN=Execute Never • cause MemManage Fault • Read/Write • Privileged/Unprivileged • Read Only • Read/Write • No access • Denying access cause MemManage Fault • Accessing MPU relative registers in unprivileged mode cause Bus Fault. reference:https://github.com/ARMmbed/uvisor
  • 7.
    HOW TO PROTECT? reference:http://www.slideshare.net/vh21/introductiontombedosuvisor?related=1 uVisor SPIUSARTFLASHRAM BOX 2BOX 1 • ACCESS CONTROL LISTS(ACLS) • Each color represents for one “user” • Each of them can only access its “belonings” • Otherwise,the MPU will cause it to get into “MemManage Fault”
  • 8.
    SECURE GATEWAY for communicationbetween boxes uVisor BOX 1 secure_gateway(func,args) BOX 2 func() SVC SVC return unprivileged privileged reference: http://www.slideshare.net/vh21/introductiontombedosuvisor?related=1
  • 9.
    Current debugging • LEDPATTERN • Hard to know what caused this issue. • May difficult to reappear the condition. • SEMI-HOST • Based on SVC • Output/Input through GDB • ON-CHIP DEBUGGER • ST-LINK/J-Link • wired Error reason RED LED blinks PERMISSION_DENIED 1 SANITY_CHECK_FAILED 2 NOT_IMPLEMENTED 3 NOT_ALLOWED 4 FAULT_MEMMANAGE 5 FAULT_BUS 6 FAULT_USAGE 7 FAULT_HARD 8 FAULT_DEBUG 9
  • 10.
    (gdb) b main.cpp:44 Breakpoint1 at 0x8000a5e: file main.cpp, line 44. (gdb) where #0 us_ticker_read () at ../../external/mbed/libraries/mbed/targets/hal/TARGET_STM/TARGET_STM32F4/us_ticker.c:50 #1 0x0800379e in wait_us (us=500000) at ../../external/mbed/libraries/mbed/common/wait_api.c:29 #2 0x08003766 in wait (s=0.5) at ../../external/mbed/libraries/mbed/common/wait_api.c:20 #3 0x08000a5e in main () at main.cpp:43 (gdb) c Continuing. Breakpoint 1, main () at main.cpp:44 44 myled = 0; (gdb) p/x i $1 = 0x1 GDB • WITH GNU DEBUGGER,YOU CAN… Look up Memory registers … Control execution Singel Step Single Instruction Breakpoint Watchpoint …
  • 11.
    How to improveit? • CRASHDEBUG • Tool to enable post-mortem debugging of Cortex-M crashes with GDB. • CRASHCATCHER • Catch Hard Faults on Cortex-M devices and save out a crash dump to be used by CrashDebug. • MRI(MONITOR FOR REMOTE INSPECTION) • The gdb compatible debug monitor for Cortex-M devices. • Running over any of the UART ports on the device. • Get rid of On-Chip debugger. • Wireless debug at any time and any where. photo reference:http://shop.myavr.com/pic/articles/STM32F429-disco_g.png Reference hardware: STM32F429i-Discovery
  • 12.
    CrashCatcher • SAVE THEMEMORY CONTENT IN THE HARDFAULT_HANDLER • Used by GDB+CrashDebug • Send the content to remote host or save in the local flash memory. • THE FORMAT MUST BE READABLE BY GDB WITH CRASHDEBUG • Little-Edian • registers content • StartAddress-EndAddress • Content 63430200 00000000 740200200000000000ED00E000000000 00000000000000000000000000000000 00000000000000000000000000000000 02000000 D0FF0220 950A0008A80B000800000021 03000020 0000002000C00120 00000320A15D0008ED5D0008FD0C0008 2B1F00082D1F00082F1F000800000000 000000000000000000000000ED5D0008 331F000800000000ED5D0008ED5D0008 ED5D0008ED5D0008ED5D0008ED5D0008 ED5D0008ED5D0008ED5D0008ED5D0008 ED5D0008ED5D0008ED5D0008ED5D0008 ... Original Project Developer : Adam Green(http://mbed.org/users/AdamGreen/) Reference hardware: STM32F429i-Discovery
  • 13.
    (gdb) c Continuing. Can't sendsignals to this remote system. SIGSEGV not sent. **Hard Fault** Status Register: 0x40000000 Forced **Usage Fault** Status Register: 0x08 Coprocessor Access Program received signal SIGSEGV, Segmentation fault. 0x08000ba8 in dbg_vprintf (fmt=0x8000a3f <dbg_put_dec(uint32_t, int, char)+102> "", va=...) at MyImplementationIO/usart:535 CrashDebug • POST-MORTEM DEBUG • With the crashed dump memory content,we can • Let the GDB view it as an alive target. • Use GDB commands. • Seeing the critical variable value. • View the location that causing the situation. • backtrace • HELP US TO KNOW WHAT HAPPENED. Original Project Developer : Adam Green(http://mbed.org/users/AdamGreen/) Reference hardware: STM32F429i-Discovery
  • 14.
    Monitor for RemoteInspection (MRI) • ALLOWING TO USE GDB REMOTE DEBUGGING THROUGH ANY COMMUNICATION METHOD(WIRELESS IS POSSIBLE) • Replace On-Chip debugger • Currently support USART in STM32F429i-Discovery Cortex-M4 devices. • GDB REMOTE SERIAL PROTOCOL • Communicating with host GDB. • Get commands by modifying USART handler. • According to the commands sent from host GDB • MRI sets the debug monitor in Cortex-M devices. • DEBUG MONITOR • One of the two debugging methods in Cortex-M devices. • Halt mode • debug monitor • Based on exception handler photo reference:https://www.segger.com/cms/admin/uploads/imageBox/J-Link-PRO_left_shadow_350x.jpg Original Project Developer : Adam Green(http://mbed.org/users/AdamGreen/) Reference hardware: STM32F429i-Discovery
  • 15.
    Ad-Hoc Debugging future frameworkbetween debugger and debuggee Reference hardware: STM32F429i-Discovery dashed line represents for any communication way,such as USART or Bluetooth. Debug Box CrashCatcher MRI System 1 remote GDB System 2 Save CrashCatcher dump GDB with CrashDebug uVisor Application BOX(s) with access permission in the ACLs of the Debug Box
  • 16.
  • 17.
    THANKS FOR LISTENING! Especiallythanks for (The order does not represent for any significance) jserv jserv.tw@gmail.com George Kang georgekang03@gmail.com Adam Green http://mbed.org/users/AdamGreen/ Milosch Meriac https://meriac.com/