1. Improvement of Nablus Network Page 1
Contents:
List of Figures………………………………………………………………………………………………….…………….…………………..3
List of Tables…………………………………………………………………………………………………..………………………………….4
Abstract ………………………………………………………………………………………………………….………………………….……..5
Introduction ……………………………………………………………………………………………….…………………….…………..….6
2.1 Constraints…………………………………………………………………………………………………..……………………………….7
2.2 Earlier Coursework……………………………………………………………………………………..…………………………….….7
3.1 Electrical PowerSystems……………………………………………………………………………..……………………………….8
3.2 Load Flow…………………………………………………………………………………………………….………………………………9
3.3 ETAP PowerStation (6)…………………………………………………………………………………………………….…………10
3.3 ETAP PowerStation (6)…………………………………………………………………………………..……………………………11
4.1 About our project………………………………………………………………………………………………….…………………….12
4.1 About our project………………………………………………………………………………………………….…………………….13
4.2.1 Supply of Electricity…………………………………………………………………………………………….…………………..13
4.2.2 Distribution Transformers …………………………………………………………………………………….…………………14
4.2.3 Over-Head Lines………………………………………………………………………………………………….….……………….15
4.2.4 Under-GroundCables……………………………………………………………………………………….…….……………….15
5.1 Load FlowAnalysis …………………………………………………………………………………………….…………...….………17
5.2 Normal Case ……………………………………………………………………………………………….….…………………………..18
5.2.1 Transformers ………………………………………………………………………………….…..……….……………….…………18
5.2.2 Buses Voltages…………………………………………………………………………………………….……….…………………19
5.2.3 Summary of Total Generation,Loading& Demand …………………………………………………………….……21
5.3 Changing the Voltage Level from 6.6 to 11 kV …………………………………………………………………………….22
5.3.1 Buses Voltages………………………………………………………………………………………………………………….…….22
2. Improvement of Nablus Network Page 2
5.3.2 Summary of Total Generation,Loading& Demand ………………………………………………………………….23
5.4 Maximum Case Improvement…………………………………………….……………………………………………..……….24
5.4.1 Buses Voltages………………….…………………………………………………………………………………………….………26
5.4.2 Power Factor Improvementinthe Max. Case……………………………………………………………………………27
5.4.3 Summary of Total Generation,Loading& Demand……………………………………………………………………29
5.5 MinimumCase Improvement………………………………………………………………………………………………..…….30
5.5.1 Buses Voltages………………………………………………………………………………………………………………………...31
5.5.2 Summary of Total Generation,Loading& Demand……………………………………………………………………32
5.6 Post-FaultCase…………………………………………………………………………………………………………………………...33
5.6.1 Buses Voltages………………………………………………………………………………………………………………………….34
5.6.2 Summary of Total Generation,Loading& Demand……………………………………………………………….….35
6.1 Comparison betweenthe casesconsideringthe voltage conditions………………………………………….…36
6.2 Comparison betweenthe casesconsideringapparent losses……………………………………………………....39
6.3 Comparison betweenthe casesconsideringthe powerfactor……………………………………………………..40
Chapter7 : Economical Study…………………………………………………………………………………………………..………..…41
7.1 Saving in Penalties……………………………………………………………………………………………………………………….41
7.2 Saving in losses……………………………………………………………………………………………………………………….….42
7.3 Simple Pay Back Period……………………………………………………………………………………………………………….42
8.1 Industrial Regionof Bait-Foureek…………………………………………………………………………………………….…43
9.1 Conclusionand Recommendations………………………………………………………………………………………….….44
References………………………………………………………………………………………………………………………………………..45
3. Improvement of Nablus Network Page 3
List of Figures:
Figure 1: One Line Diagram of Nablus Network …………….…………….………….…………………….………….…….5
Figure 2: ETAP Power Station ………………………………………………………………………………………………..………… 10
Figure 3: DistributionTransformers……………………………………………………………………………….………………….14
Figure 4: ACSR Cable.…………………………………………………………………………………….………….……………………...15
Figure 5: XLPE Cable …………………………………………………………………………………………….…………………………..15
Figure 6: Some Of UnderVoltage Buses ………………………………………………………………………………………..….20
Figure 1: Some Of UnderVoltage Buses………………………………………….…….………………………………………….20
Figure 8: Installedcapacitors in max. case ………………………………………………………………………………………..25
Figure 9: Installedcapacitors in min. case …………………………………………………………………………………………30
Figure 10: Branch with highestapparent power…….. ………………………………………………………………………..33
4. Improvement of Nablus Network Page 4
List of Tables:
Table 1: The R & X of Transformers …………………………………………………………………………………………………..14
Table 2: The R & X of the ACSR …………………………………………………………………………………………………………15
Table 3: R & X of XLPE CU………………………………………………………………………………………………………………….16
Table 4: R & X of XLPE Al …………………………………………………………………………………………………………….…….16
Table 5: The Number & Ratings of Transformers ……………………………………………………...………………………18
Table 6: Under Voltage BusesNormal case (6.6kV)……………………………………………………………………………19
Table 7: Under Voltage Buseschanging (6.6-11 ) kV ………………………………………………………………………...22
Table 7: Under Voltage Buseschanging (6.6-11 ) kV …………………………………………………………………….…..23
Table 8: Under Voltage BusesMax case ……………………………………………………………………………………………26
Table 8: Under Voltage BusesMax case ……………………………………………………………………………………………27
Table 1: The penaltiesofpower factor …………………………………………………………………………………………….28
Table 10: UnderVoltage Buses Mincase…………………………………………………………………………………………..32
Table 11: UnderVoltage Buses Post-faultCase………………………………………………………………………………....34
Table 11: UnderVoltage Buses Post-faultCase………………………………………………………………………………....35
Table 12: Comparisonbetweenthe cases consideringthe voltage conditions………………………………..….38
Table 13: Comparisonbetweenthe cases consideringapparent losses……………………………………………..39
Table 14: Comparisonbetweenthe cases consideringthe power factor……………………………………………40
5. Improvement of Nablus Network Page 5
abstract:
Our project is to gather the initial data for Nablus governorate network and read its
planners to study the residential and industrial loads by co-operating with Northern
Electricity Distribution Company “NEDCO”, in order to subject it to a load flow study
using the software program “ETAP” to improve voltage level and reduce electrical losses in
the network as much as possible by improving the power factor, reliability, and protection
of the system.
Figure 2: One Line Diagram of Nablus Network.
6. Improvement of Nablus Network Page 6
Chapter 1:
1.1Introduction:
Any power systemmay have problems such as in voltages, currents, low power factor, and
instability, which a power engineer consider and deal with. Our project is to analyze and
make a load flow study using ETAP software for Nablus governorate network. The main
goal for this project is trying to achieve the optimum performance for Nablus governorate
network. The objectives summarized as follows:
1. Improve the voltage level and reduce the power losses.
2. To get economical benefits and decrease costs on the company and consumers.
3. To increase the network’s reliability and stability.
4. To make the system more protected.
The technical and economical feasibility are considered for adjustments in the network.
Our main goal is to deliver high-efficient, low-loss electricity to consumers in order to
reduce costs with the sense of electrical engineering criterions and standards.
We had our practical training in Northern Electricity Distribution Company "NEDCO",
which according to it, they have a lot of problems in a part of Nablus network which is:
"Mojair Addin" network, the reason we chose our project for.
7. Improvement of Nablus Network Page 7
Chapter 2
2.1 Constraints:
The main constraint which was encountered is that we couldn't get exact information about
the lengths of some transmission lines and some loads which will lead to inaccurate results
for the original network of Nablus governorate. This constraint was able to overcome by
taking approximate lengths for those transmission lines and assuming the load factor for
those loads to be 70%.
2.2 Earlier Coursework:
Some earlier courses and topics that helped and were used in this project effectively:
- Electrical Machines I
- Electrical Machines II
- Electrical Machines Laboratory
- Power Systems Analysis I
- Power Systems Analysis II
- Power Systems Laboratory
- Designand Analysis of Electrical Networks
- Generation and Conversion Stations
- Protection and Stability of Power Systems
8. Improvement of Nablus Network Page 8
Chapter 3:
Literature Review:
3.1 Electrical Power Systems:
Electrical energy is produced through energy conversion process. It can be converted from
different forms of energy (such as potential energy, mechanical energy, chemical energy) to
produce the electrical energy, then transmit it to the loads to be used by consumers. The
production and transmission of electricity is relatively efficient and inexpensive compared
to other forms of energy. On the other hand, electrical energy cannot be easily stored,
that's why electricity is used as it is being generated.
The electrical power systemis a network of interconnected components which consists of
three main subsystems: the generation subsystem, the transmission subsystem, and the
distribution subsystem. In the generation subsystem, electricity is produced in the station
by converting some specific form of energy into electrical energy. Then, the voltage output
of the generators is increased by a step-up transformer to the appropriate transmission
level. The transmission subsystem transmits the electrical energy to the load centers. The
voltage is then decreasedby a step-down transformer to the appropriate levels. For the
distribution subsystem, the electrical power is transmitted where the voltage is stepped
down again to a specific level which can be used by residential, industrial, commercial, and
street lighting loads.
9. Improvement of Nablus Network Page 9
3.2 Load Flow:
In power engineering, the load flow study (also known as power flow study) is one of the
most important tools to analyze and simulate power systems. Unlike traditional circuit
analysis, a load flow study usually uses simplified notations such as one-line diagram and
per-unit systems. It also uses the various forms of AC power (i.e. real, reactive, and
apparent power) rather than the voltage and current. It analyzes the power systemin the
steady-state operation. There are many programs and software for load flow studies.
In addition to the load flow analysis, some programs use other types of analysis such as
fault analysis and economics. Another programs are used to find the optimal power flow
which gives the lowest cost per KWh generated.
What makes the load flow studies really important is the planning for the future loads and
expansion of the power systemas well as in determining the best operation of that power
system. The main information which is obtained from the load flow study is the voltage and
phase angle at each bus, as well as the real and reactive powers on each line.
10. Improvement of Nablus Network Page 10
3.3 ETAP POWER STATION (6):
Figure 3: ETAP power station
ETAP offers a suite of fully integrated Electrical Engineering software
solutions including arc flash, load flow, short circuit, transient stability, relay
coordination, cable ampacity, optimal power flow, and more. Its modular
functionality can be customized to fit the needs of any company, from small to
large power systems.
ETAP Real-Time is a fully-integrated suite of software applications that
provides intelligent power monitoring, energy management, system optimization,
advanced automation, and real-time prediction.
ETAP is the most comprehensive enterprise solution for design, simulation, operation,
control, optimization, and automation of generation, transmission, distribution, and
industrial power systems.
11. Improvement of Nablus Network Page 11
ETAP Smart Grid offers comprehensive applications enabling electrical
utilities to plan, coordinate, and safely operate their grid. This real-time system
has the ability to manage, control, visualize, optimize, and automate power
transmission and distribution networks.
So, in our project, we will use the ETAP 6 software to analyze and improve a part of
Nablus governorate network, specifically "Mojair Addin network".
12. Improvement of Nablus Network Page 12
Chapter 4:
Methodology:
4.1 About our project:
In our project, we will analyze and improve "Mojair Addin" Nablus network using the
ETAP 6 software.
The following steps were taken:
1. The gather and collection of data which consists of:
a. Approximate loads ( a load factor of 70%).
b. Power Factor of 85%.
c. The lengths of the transmission lines and their impedances (X,Y).
2. Plotting and Drawing the one-line diagram using the ETAP software.
3. Analyzing the network in its approximated condition.
4. Increase the voltage level from 6.6 to 11 kV.
- The network consists of:
1. One swing bus and one generator (5MW).
2. Busses.
3. Branches.
4. Loads.
-Prospective goals of the study:
1. Increase the voltage levels.
2. Reduce the power losses.
3. Improve the power factor in order to reduce the penalties.
4. Increase the capability of the transformers.
5. Increase the reliability of the network.
13. Improvement of Nablus Network Page 13
-Methods of improving the operation condition of electrical networks:
1. Swing bus control.
2. Transformer taps.
3. Capacitor banks installation (reactive power compensation).
4.2 About "Mojair Addin" Network:
4.2.1 Supply of Electricity:
The electricity of Nablus is supplied by Israel Electrical Company "IEC" through an
overhead transmission line of 33 kV. Then, electricity is distributed by Northern Electricity
Distribution Company "NEDCO" with a voltage of 6.6 kV. Electricity is purchased from
"IEC" and then distributed to the consumers. Palestine has not yet a unified power system,
the existing network is a local low voltage distribution network connected to "IEC", where
around 97% of consumed energy is supplied by the "IEC".
14. Improvement of Nablus Network Page 14
4.2.1 DistributionTransformers:
Nablus consists of33/11-6.6 kVand 11-6.6/0.4 kVdistribution transformers.
Figure 4: Figure Of Transformer.
Transformer
Ratings
(KVA)
R
(ohm/Km)
X
(ohm/Km)
Z
(ohm/Km)
630 0.002 0.012 0.012
400 0.004 0.015 0.016
250 0.008 0.024 0.025
160 0.01 0.037 0.04
Table 1: R &X of Transformers
15. Improvement of Nablus Network Page 15
4.2.3 Over HeadLine:
- The conductors used in the network are ACSR (Aluminium Conductor Steel Reinforced)
-The resistance and reactance of the ACSR conductor
In the table below:
ACSR
CABLE
R(Ohms/Km) X(Ohms/Km)
120mm2 0.219 0.269
95mm2 0.301 0.322
50mm2 0.543 0.333
Table 2: R & X of the ACSR .
4.2.4 Under Ground Cable :
-The under ground cable used in the network are XLPE Cu ,XLPE Al .
-The resistance and reactance of XLPE in below tables
Figure 5: ACSR Cable.
Figure 6: XLPE Cable
16. Improvement of Nablus Network Page 16
XLPE CU
CABLE
R(Ohms/Km) X(Ohms/Km)
240mm2 0.754 0.109
120mm2 0.196 0.117
95mm2 0.41 0.121
50mm2 0.387 0.138
Table 3: R & X of XLPE CU
Table 4: R & X of XLPE AL
XLPE AL
CABLE
R(Ohms/Km) X(Ohms/Km)
95mm2 0.32 0.542
17. Improvement of Nablus Network Page 17
Chapter 5:
Results and Analysis:
5.1 Load Flow Analysis:
In this semester we do the following steps:
Step 1: collection of data which consist of :
Actual loads on transformer and power factor .
Impedances of transmission lines ( R, X) .
Step 2: Plotting the one line diagram in ETAP
Step 3: Analyzing and studying the network in its approximated load condition and after
increasing the voltage level to 11 kV.
Step 4: Analysis and improving the network in several cases:
In maximum case.
In minimum case.
In fault case.
18. Improvement of Nablus Network Page 18
5.2 Normal Case:
In this case, the network has been analyzed under its current state (6.6 kV).
5.2.1 Transformers:
There are (67) total number of transformers.
The following table shows the rating of transformers and their numbers:
Transformer Rating ( KVA) Number of Transformers
1000 1
630 27
500 1
400 26
250 12
160 1
Table 5: Transformer Rating and Number
20. Improvement of Nablus Network Page 20
Figure 6: Some Of Under Voltage Buses.
Figure 7: Some Of Under Voltage Buses
21. Improvement of Nablus Network Page 21
5.2.3 Summary ofTotal Generation, Loading & Demand:
The power factor of the buses is less than 0.90 ,the power factor of all busses , so we try to
increase the power factor of the busses.
Appendix B shows the real and reactive power flow, and the power factor in all buses of the
network
22. Improvement of Nablus Network Page 22
5.3 Changing the Voltage Level from 6.6 to 11 kV:
In this case, each 6.6 kV will be raised to 11 kV. The same transformers are used as in the
normal case (6.6 kV) because the transformers available have three windings which
converts from 33-6.6 kV or 33-11 kV. So, no new transformers are needed to be replaced.
5.3.1 Buses Voltages:
The following table shows the under voltages on some buses:
Bus
Initial Voltage
(KV)
Operating Voltage
(KV)
V%
Bus100 11.00 10.245 93.1
Bus102 11.00 10.217 92.9
Bus104 11.00 10.221 92.9
Bus178 11.00 10.19 92.6
Bus179 11.00 10.191 92.6
Bus185 11.00 10.116 92
Bus223 11.00 10.325 93.9
Bus224 11.00 10.325 93.9
Bus225 11.00 10.308 93.7
Bus230 11.00 10.35 94.1
Bus48 11.00 10.345 94
Bus88 11.00 10.289 93.5
Bus89 11.00 10.287 93.5
Bus9 11.00 10.292 93.6
Bus114 11.00 10.431 94.8
Bus116 11.00 10.397 94.5
Bus120 11.00 10.393 94.5
Bus236 11.00 10.047 91.3
Bus77 11.00 10.071 91.6
Bus108 0.400 0.371 92.6
Bus110 0.400 0.371 92.6
Bus154 0.400 0.367 91.7
Bus156 0.400 0.367 97.6
Bus27 0.400 0.371 92.8
Bus60 0.400 0.372 93
Bus66 0.400 0.370 92.4
24. Improvement of Nablus Network Page 24
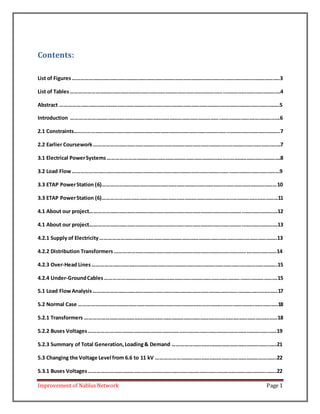
5.4 Maximum Case Improvement:
In this case, the tap changer of the secondary side of the main transformer (33-11 kV) is
raised to 10%, and using capacitor banks in order to improve voltages and power factor.
Six capacitors were used as follows:
1. A capacitor of 600 kVAr at bus 17.
2. A capacitor of 800 kVAr- at bus 46.
3. A capacitor of 800 kVAr at bus 63.
4. A capacitor of 800 kVAr at bus 96.
5. A capacitor of 400 kVAr at bus 116.
6. A capacitor of 800 kVAr at bus 142.
The capacitors were installed at the buses with lowest voltages.
25. Improvement of Nablus Network Page 25
The following figure shows the installed capacitors in the network:
Figure 8: Installed capacitors in max. case.
27. Improvement of Nablus Network Page 27
Bus33 0.400 0.424 106
Bus79 0.400 0.414 103.5
Bus69 0.400 0.414 103.4
Table 8: Under Voltage Buses Max case
5.4.2 Power Factor Improvement inthe Max. Case:
The cosine ofangle ofphase displacement between voltage and current in an AC circuit is known as
Power Factor.
Howto improve the P.F?
Where:
Qc: The reactive power to be compensated by the capacitor.
P: The real power of the load.
θ old: The actual power angle.
θ new: The proposed power angle.
28. Improvement of Nablus Network Page 28
Capacitor Banks:
The important of improvement power factor is by adding shunt capacitor banks at the buses at
both transmission and distribution levels and loads and there are more effective to add them in the
low level
Voltages.
Effect of LowPower Factor :
1. Higher Apparent Current .
2. Higher Losses in the Electrical Distribution network .
3. Low Voltage in the network.
Benefits ofImproving Power Factor:
1. Lower Apparent Power.
2. Reduces losses in the transmission line .
3. Improves voltage drop.
4. Avoiding the penalties.
The problem of low power factor :
The low P.F is highly undesirable as it causes an increase in the current ,resulting in additional
losses ofactive power in all the elements ofpower system from power station generator down to the
utilization devices .In additional to the losses the low P.F causes penalties.
The following table shows the system of the penalties in our companies:
Power Factor P.F Penalties
P.F≥ 0.90 No Penalties.
0.90>P.F ≥0.8 1% of total bill for each one under 0.90
0.8>P.F≥0.7 1.25%of total bill for each one under 0.90
P.F <0.7 1.5%of total bill for each one under 0.90
Table 9: The penalties of power factor
29. Improvement of Nablus Network Page 29
Our aim to improvement the P.F in order to avoid penalties and to reduce the current flowin the
network which reduce the electrical losses in the network
5.4.3 Summary ofTotal Generation,Loading & Demand:
30. Improvement of Nablus Network Page 30
5.5 Minimum Case Improvement:
In this case, the tap changer of the secondary side of the power transformer (33-11 kV) is
raised to 5%, the apparent power of the loads were multiplied by 50%, and capacitor
banks were used in order to improve voltages and power factor.
Five capacitors were used as follows:
1. A capacitor of 200 kVAr at bus 17.
2. A capacitor of 800 kVAr at bus 46.
3. A capacitor of 400 kVAr at bus 63.
4. A capacitor of 400 kVAr at bus 126.
5. A capacitor of 100 kVAr at bus 142.
The capacitors were installed at the buses with lowest voltages.
The following figure shows the installed capacitors in the network:
Figure 9: Installed capacitors in min. case.
32. Improvement of Nablus Network Page 32
Bus33 0.400 0.412 103.1
Bus79 0.400 0.407 101.8
Bus69 0.400 0.407 101.8
Table 10: Under Voltage Buses Min case
5.5.2 Summary ofTotal Generation,Loading & Demand:
33. Improvement of Nablus Network Page 33
5.6 Post-Fault Case:
In this case, the maximum case is used after improvement check for the bus with the
highest apparent power (S) taken from the swing bus and multiply its resistance and
reactance (R & X) by 2.
The following figure shows the branch with the highest apparent power (S):
Figure 10: Branch with highest apparent power.
35. Improvement of Nablus Network Page 35
Bus33 0.400 0.424 106
Bus79 0.400 0.414 103.5
Bus69 0.400 0.414 103.4
Table 11: Under Voltage Buses Post-fault Case
5.6.2 Summary ofTotal Generation, Loading & Demand:
36. Improvement of Nablus Network Page 36
Chapter 6:
Discussion:
The five cases to be compared are:
1. The original case (6.6 kV).
2. The raised voltage level (11 kV).
3. The maximum case.
4. The minimum case.
5. The post-fault case.
6.1 Comparisonbetweenthe cases considering the voltage conditions:
The following table shows some of the buses on the medium and low voltage sides:
39. Improvement of Nablus Network Page 39
As shown in the previous tables, when changing the voltage level from 6.6 kV to 11 kV, the
drop voltage was clearly decreased / improved.
In the maximum case, after increasing the tap changer on the secondary side by 10% and
adding capacitors, the drop voltage was further decreased / improved and the voltages
became in range ( between 100% and 110% of nominal voltage).
The same applies for the minimum case and the post-fault cases.
6.2 Comparisonbetweenthe cases considering apparent losses:
The following table shows the apparent losses for these five cases:
Table 13: Comparison between the cases considering apparent losses
As noted from the previous table, when changing the voltage level from 6.6 kV to 11 kV,
the apparent losses was decreased.
In the maximum case, when the tap changer was increased, the apparent losses were
decreased evenfurther. The same applies for the minimum case.
For the post-fault case, the apparent losses were a bit increased compared to the maximum
case.
Post –fault
case
Minimum
Case
Maximum
Case
Changing
swing bus
(6.6-11)kV
Normal
Case
(6.6)kV
---------------
0.3620.0850.3340.4171.020
Real Losses
( MW)
2.1160.4942.0812.3553.196
Reactive
Losses
( MAvr)
40. Improvement of Nablus Network Page 40
6.3 Comparisonbetweenthe cases considering the power factor:
The following table shows the power factor for these five cases:
Table 14: Comparison between the cases considering the power factor
As observed from the previous table, the power factor was slightly increased when the
voltage level was increased from 6.6 kV to 11 kV.
In the maximum case, after increasing the tap changer of the power transformer on the
secondary side by 10% and adding capacitors, the power factor was clearly and highly
improved.
The same applies for the minimum and post-fault cases.
The sought power factor was 90% which it was achieved, since a power factor lower than
that would lead to penalties to Northern Electricity Distribution Company "NEDCO" if
the power factor of the swing bus is lower than 0.9.
Post –fault
case
Minimum
Case
Maximum
Case
Changing
swing bus
(6.6-11)kV
Normal
Case
(6.6)kV
---------------
90.70 Lag90.84 Lag90.75 Lag80.76 Lag79.97 Lag
Power Factor
Swing Bus
41. Improvement of Nablus Network Page 41
Chapter 7:
The Economical Study:
In this chapter we will study another face of the project which is a very important in any
project, it's the economical study to the system.
7.1 Saving in Penalties:
- P max=20.304MW.
- P min=9.796MW.
- Losses before improvement = 0.417MW.
- Losses after improvement = 0.334MW.
- P.F before improvement = 0.8076
- P.F after improvement = 0.9075
- Pav = ( Pmin+ Pmax) / 2 =15.05MW.
- L.F = 0.7.
- Total energy per year = ( Pav * 8760) = 131838 MWH.
- Total cost per year = ( Total energy * cost (NIS/KWH) )
= 131838*0.6
= 79102800NIS/year.
- Saving in penalties of P.F = 0.01*(0.9075-0.896)*Total cost of energy
= 79023.69 NIS/year.
42. Improvement of Nablus Network Page 42
7.2 Saving in losses:
- Average losses before improvement = ( 0.7 * 417 ) = 291.9 KW.
- Energy of the losses before improvement = ( 291.9 * 8760 ) = 2557044 KWH.
- Cost of losses before improvement = ( 2557044 * 0.6 ) = 1534226.4 NIS/year.
- Average losses after improvement = ( 0.7 * 334 ) = 233.8 KW.
- Energy of the losses after improvement = ( 233.8 * 8760 ) = 2048088 KWH.
- Cost of losses after improvement = ( 2048088 * 0.6 ) = 1228852.8 NIS/year.
- Saving in losses = cost of losses before – cost of losses after
= 1534226.4 -1228852.8 = 305373.6NIS/year.
7.3 Simple Pay Back Period:
- Total fixed capacitor banks using in maximum case
= ( ( 800 * 4 )+ 600 +400 ) = 4200 kVAr
- Cost per KVAR = 3JD = 15NIS..
- Total cost of capacitor banks = (4200 * 15 ) = 63000 NIS.
- Total saving = saving in losses + saving in penalties
= 79023.69 + 305373.6 = 384397.29NIS.
- S.P.B.P = Investment /Saving
=63000/384397.29 = 0.18 years = 2.16 month.
43. Improvement of Nablus Network Page 43
Chapter 8:
Industrial Region of Bait-Foureek:
The industrial region suggestedin bait-Foureek which will be connected to the connection
point of Howara at a high voltage of 33 kV, which has an estimated load of 10 MW
depending on the information given by Northern Electricity Distribution Company
(NEDCO), where a transformer will be used of 33/0.4 kV. No transformer will be used to
convert from 33/11 kV and that's due to economical reasons.
Since the industrial region is directly connected to the connection point of Howara, there's
no need for a load flow study for the whole network which is connected to it.
Calculation:
Real Power = 10 MW
Power Factor = 0.85
Using Transformer of (33-0.4) KV
Apparent Power S = ( Real Power / Power Factor)
S = ( 10 / 0.85 ) = 11.76 MVA
S Rated Transformer = ( S Load / Load Factor)
S = ( 11.76 / 0.7 ) = 16.8 MVA
44. Improvement of Nablus Network Page 44
Chapter 9:
Conclusion and Recommendations:
After improving "Mojair Addin" network using ETAP software, dropvoltage
wasdecreased,apparent losses was reduced, and the power factor was improved to over
90%, and this is due to the increase in voltage levels (6.6-11 kV), raising the tap changer
oftransformers, and installing capacitors to the network which will lead to a more
efficientand stable system and will reduce any penalties paid to the IEC on NEDCO
company and consumers.
We recommend that the next electrical engineering students to work with such projects, in
order to increase their experiences in the power engineering field, and to use
software/programs that simulates such power systems. We would also recommend that our
electrical engineering department to archive some one-line diagrams from the electrical
distribution companies to give students brief ideas about practical networks in Palestine.
45. Improvement of Nablus Network Page 45
References:
1- Elements of Power System Analysis 4th Ed. by William D. Stevenson, Jr.p.213
2- Chapman, Stephen (2002). Electric Machinery and Power System Fundamentals.
Boston: McGraw-Hill. Pp p.67
3- Gene Wolf (2000-12-01). "Electricity through the Ages". Transmission &
Distribution World.p.421
4- Northern Electricity Distribution Company "NEDCO"