Download to read offline


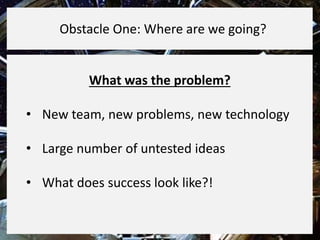
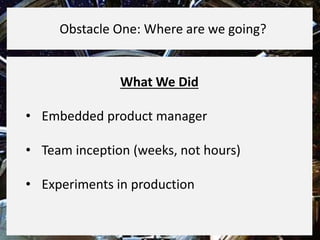
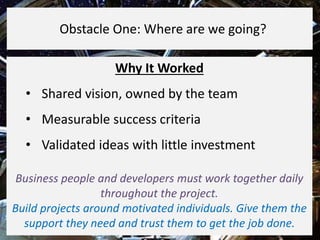

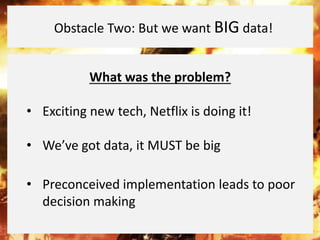


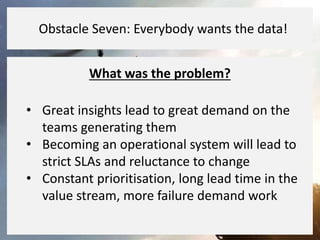
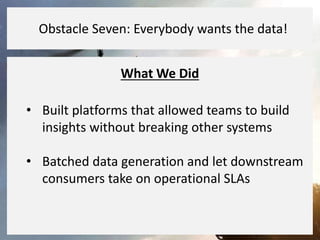
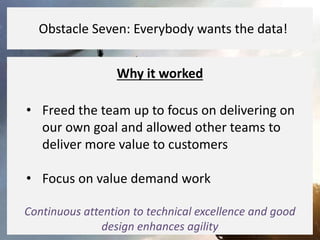
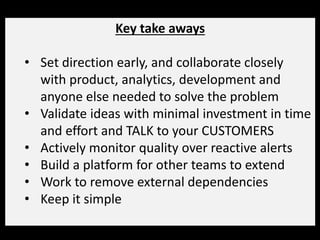


Mark Barber discusses the challenges faced by agile data teams, including issues with unclear direction, data processing, and infrastructure demands. He emphasizes the importance of collaboration, simplification, and continuous monitoring to enhance agility and deliver valuable products. Key recommendations include validating ideas early, maintaining team ownership of infrastructure, and focusing on user needs.
![Own Your Own Impact: Incident Response at Airbnb [FutureStack16]](https://cdn.slidesharecdn.com/ss_thumbnails/futurestack16airbnb-161202194236-thumbnail.jpg?width=640&height=640&fit=bounds)