Download to read offline

![WHY STOP HERE?
Yesmail Interactive is dedicated to helping brands remain on top of the changing digital
marketing landscape by providing proprietary research on industry-defining trends and
actionable recommendations on how marketers can improve their programs and achieve
higher ROI. But don’t believe what we have to say, check out these resources to learn how
to get the most out of your marketing efforts.
Mobile Optimization & Design:
[WEBINAR]
Mobile-First Email
Strategies: Thinking
Beyond Just Design
[WHITEPAPER]
Mobile Email Design:
Marketing Fit for the
Small Screen
[INFOGRAPHIC]
Mobile Email Strategies for
the Holiday Season
[BLOG POST]
Customer
Segmentation 101
[BLOG POST]
You’ve Segmented your
Database, Now What?
Database Segmentation:
Resources
[WEBINAR]
Ready, Set, Segment! Using
Email Behavioral Data to Target
Customers and Drive Engagement
Email Deliverability & List Hygiene:
[WHITEPAPER]
End the Nightmares!
10 Email Deliverability
Myths Debunked
[BLOG POST]
Dirty Database: the Flat
Tire on the Road Trip
to Deliverability
Email Programs:
pg. 13
[WHITEPAPER]
Turbocharge Your Email
Marketing through Better
Transactional Messages
[BLOG POST]
Today’s Challenges
to Customer
Lifecycle Engagement
[BLOG POST]
Turning the Right
Cliche into Action in
the Customer Lifecycle](https://image.slidesharecdn.com/yesmailq3emailmarketingcompasspurchasebehavior-131114132643-phpapp01/85/Yesmail-s-Email-Marketing-Compass-Consumer-Purchase-Behavior-13-320.jpg)

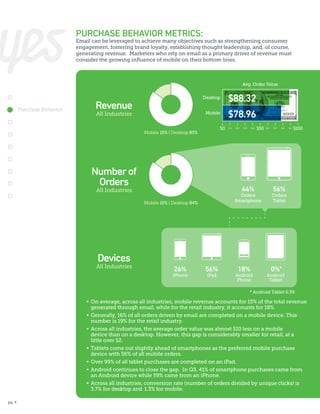
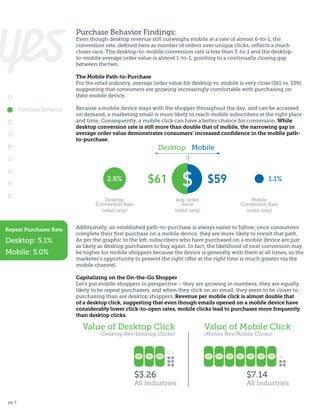
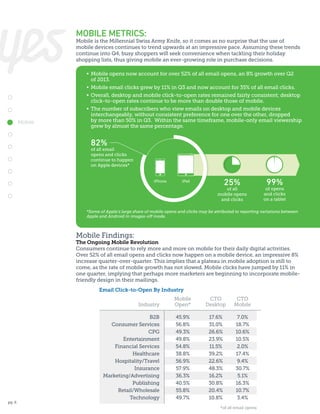
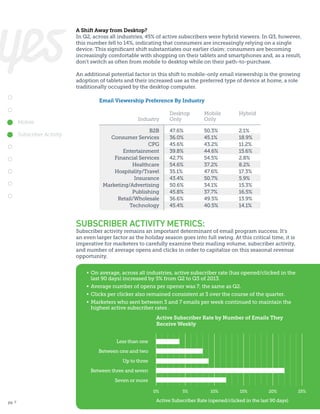
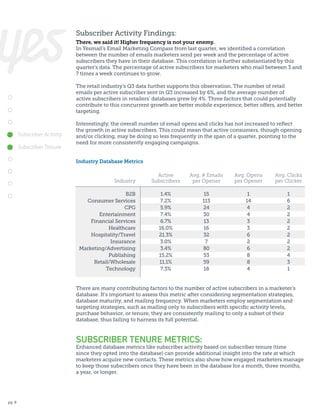
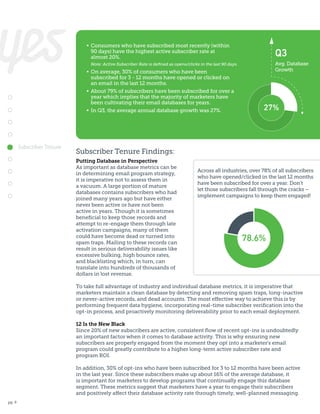
The document presents insights from Yesmail's email marketing compass report, focusing on consumer purchase behavior influenced by mobile devices, which accounted for 16% of sales driven by email, with significant variations in order value between mobile and desktop purchases. It highlights a shift towards mobile-only email viewership and increased active subscriber rates, emphasizing the importance of targeting and engagement strategies as the holiday season approaches. Marketers are urged to adapt to changing subscriber preferences and capitalize on the growing trend of mobile shopping to enhance their email marketing efforts.


![Étude annuelle UPS Pulse of Online Shopper 2017 [intégrale]](https://cdn.slidesharecdn.com/ss_thumbnails/upspulseoftheonlineshopper2017-180417124513-thumbnail.jpg?width=640&height=640&fit=bounds)


