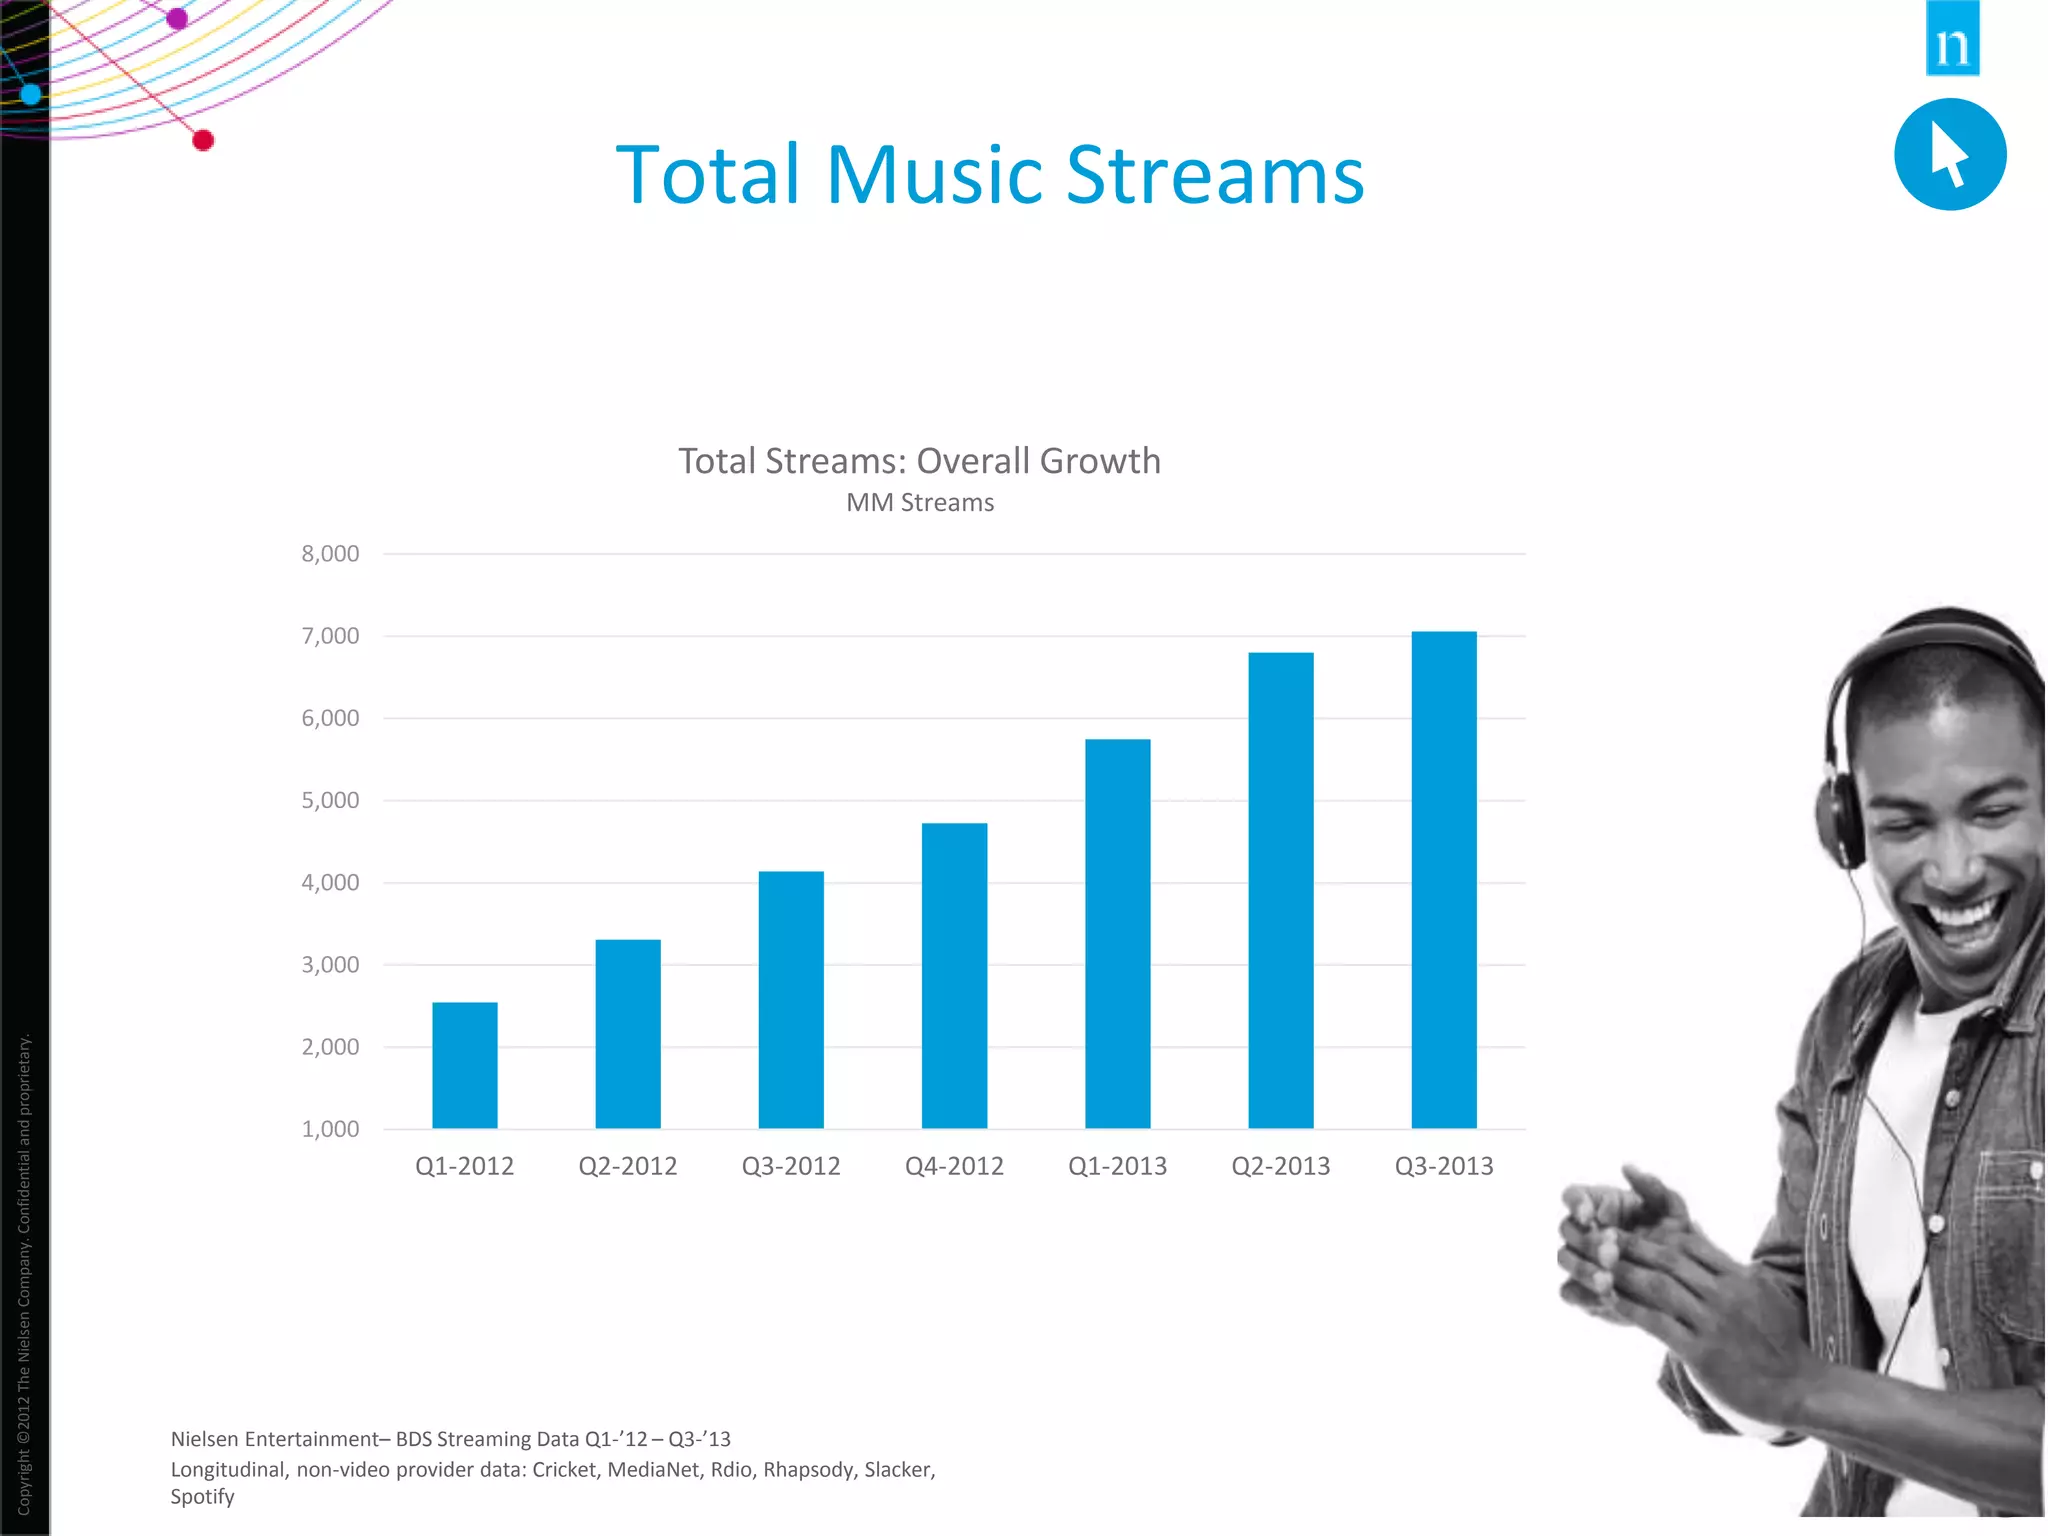
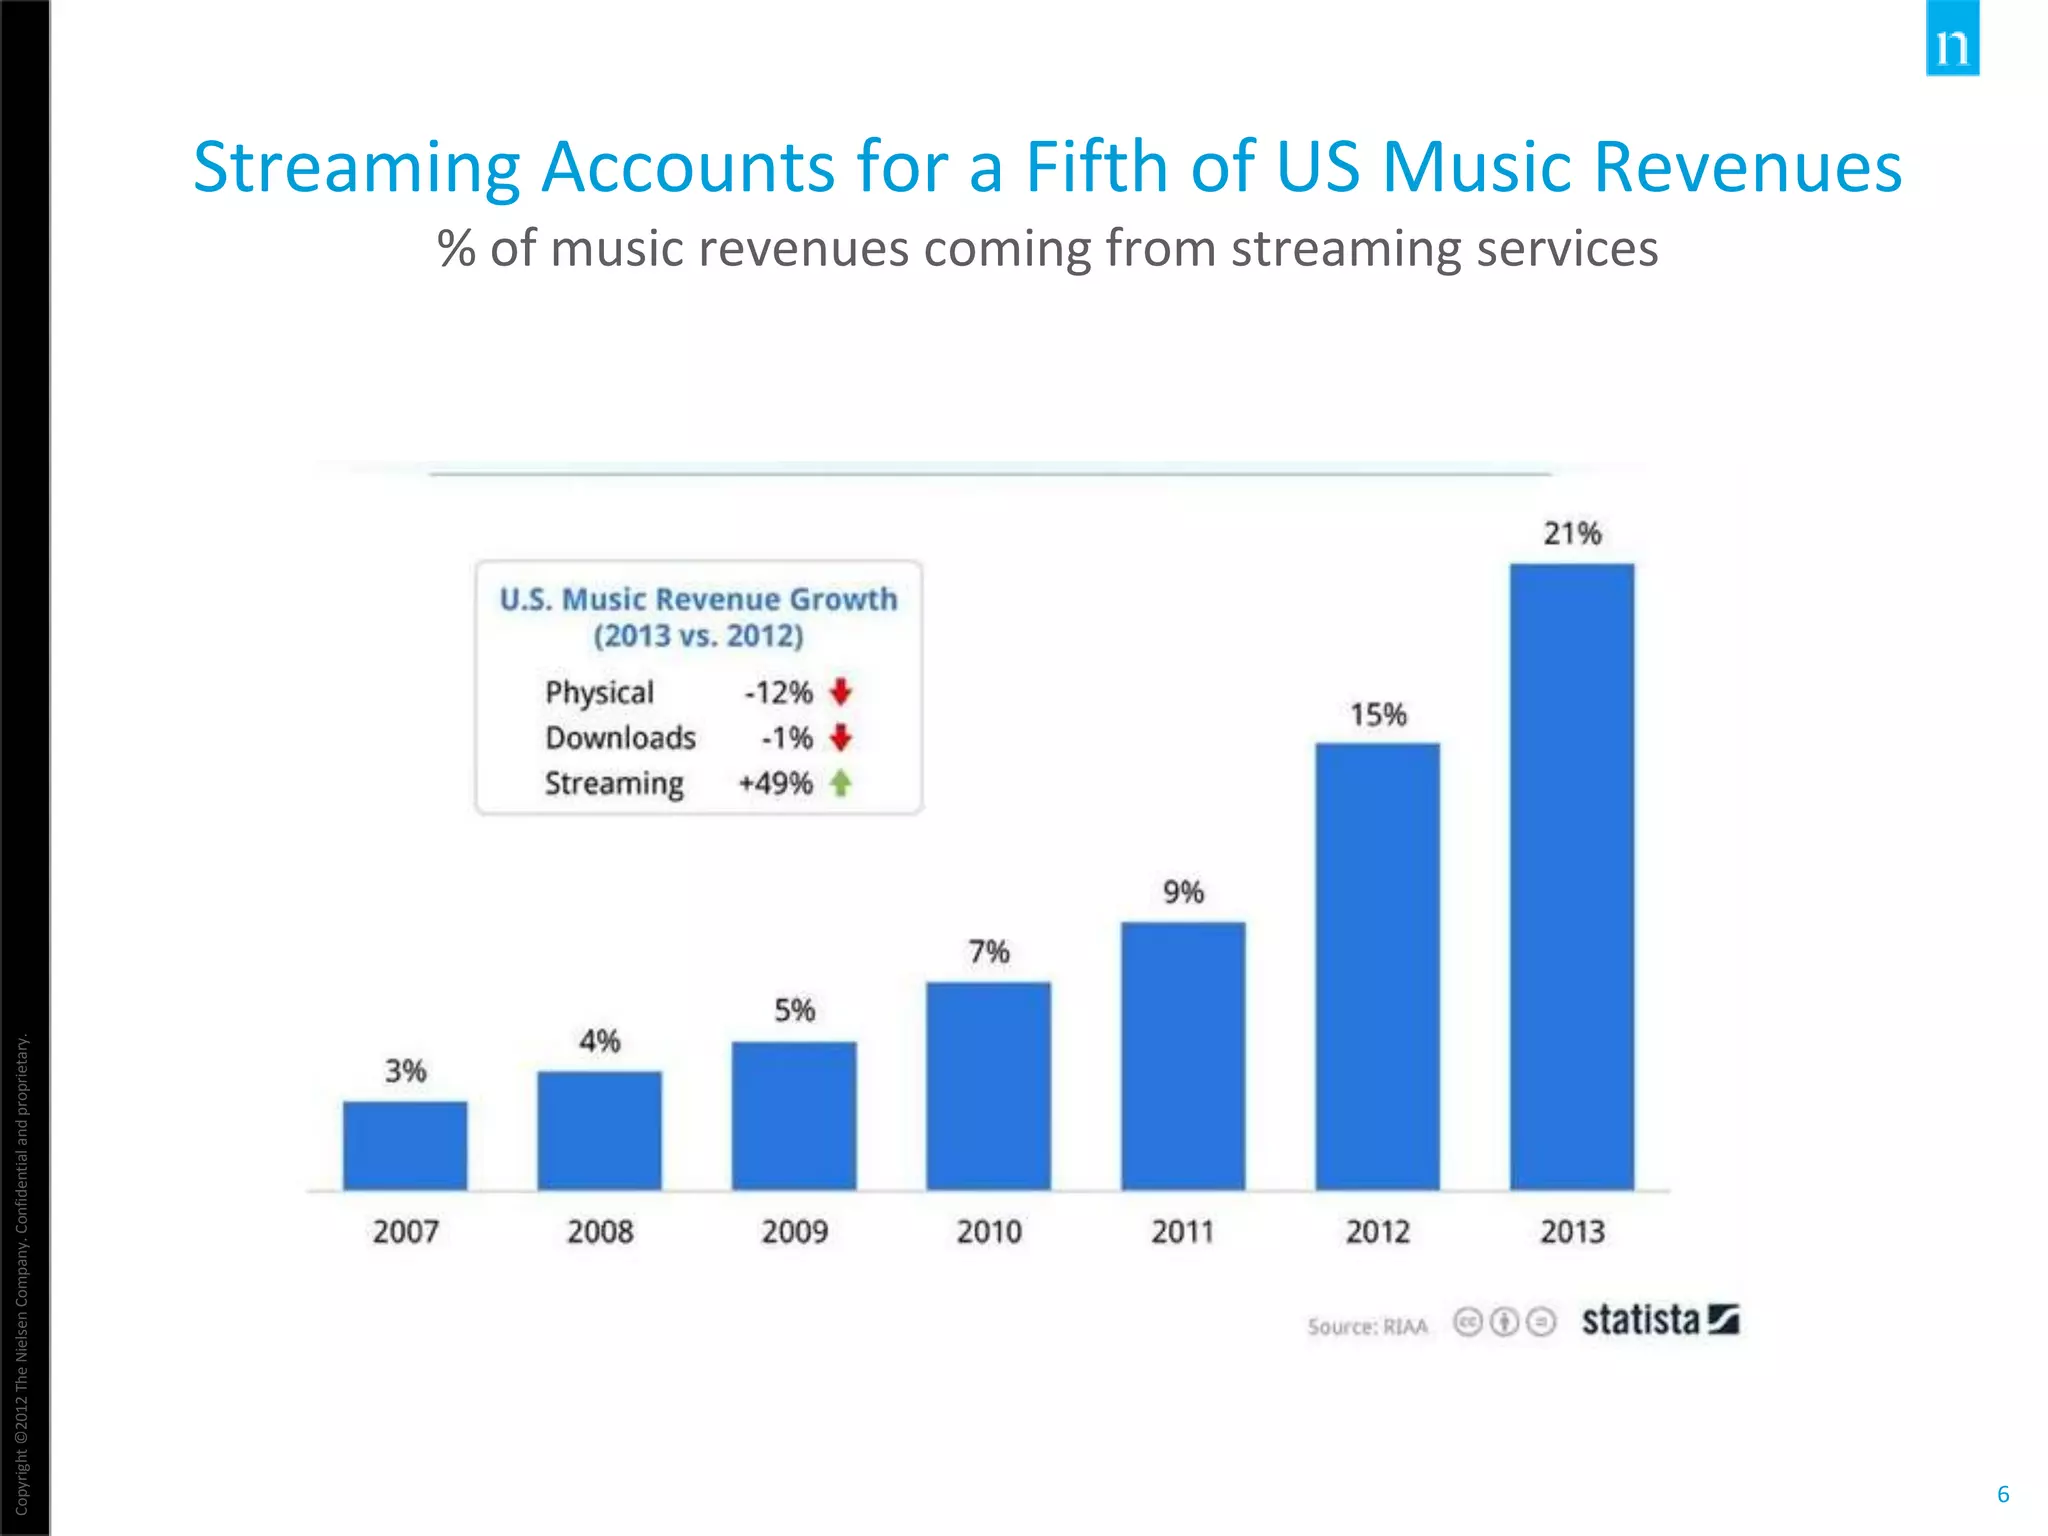
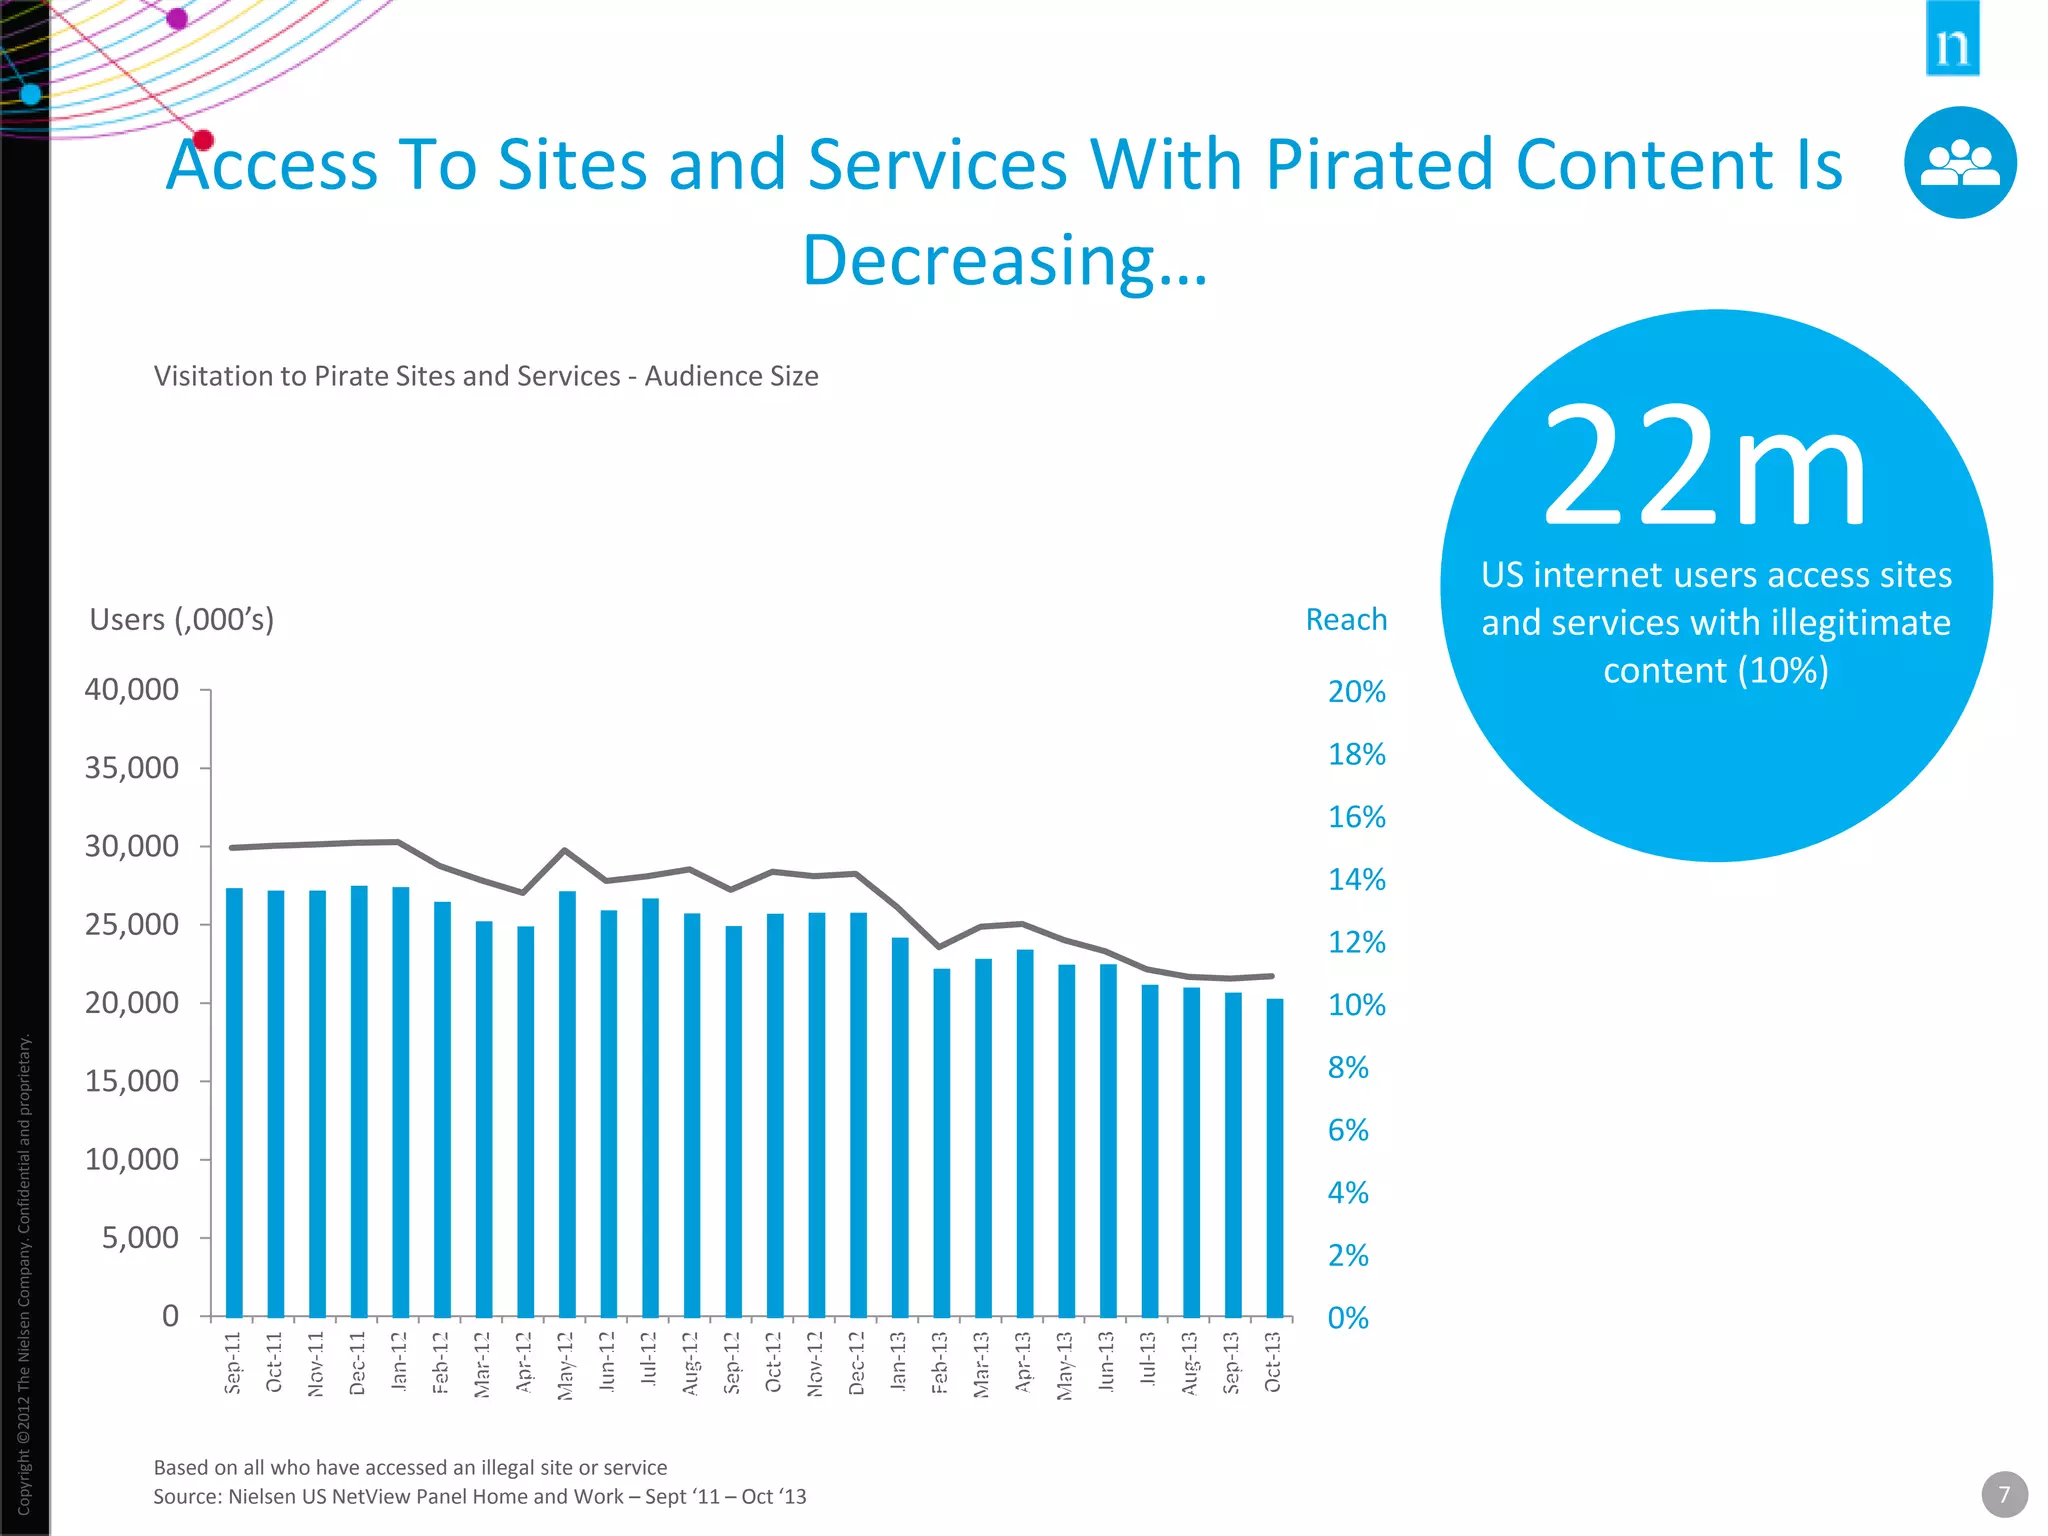
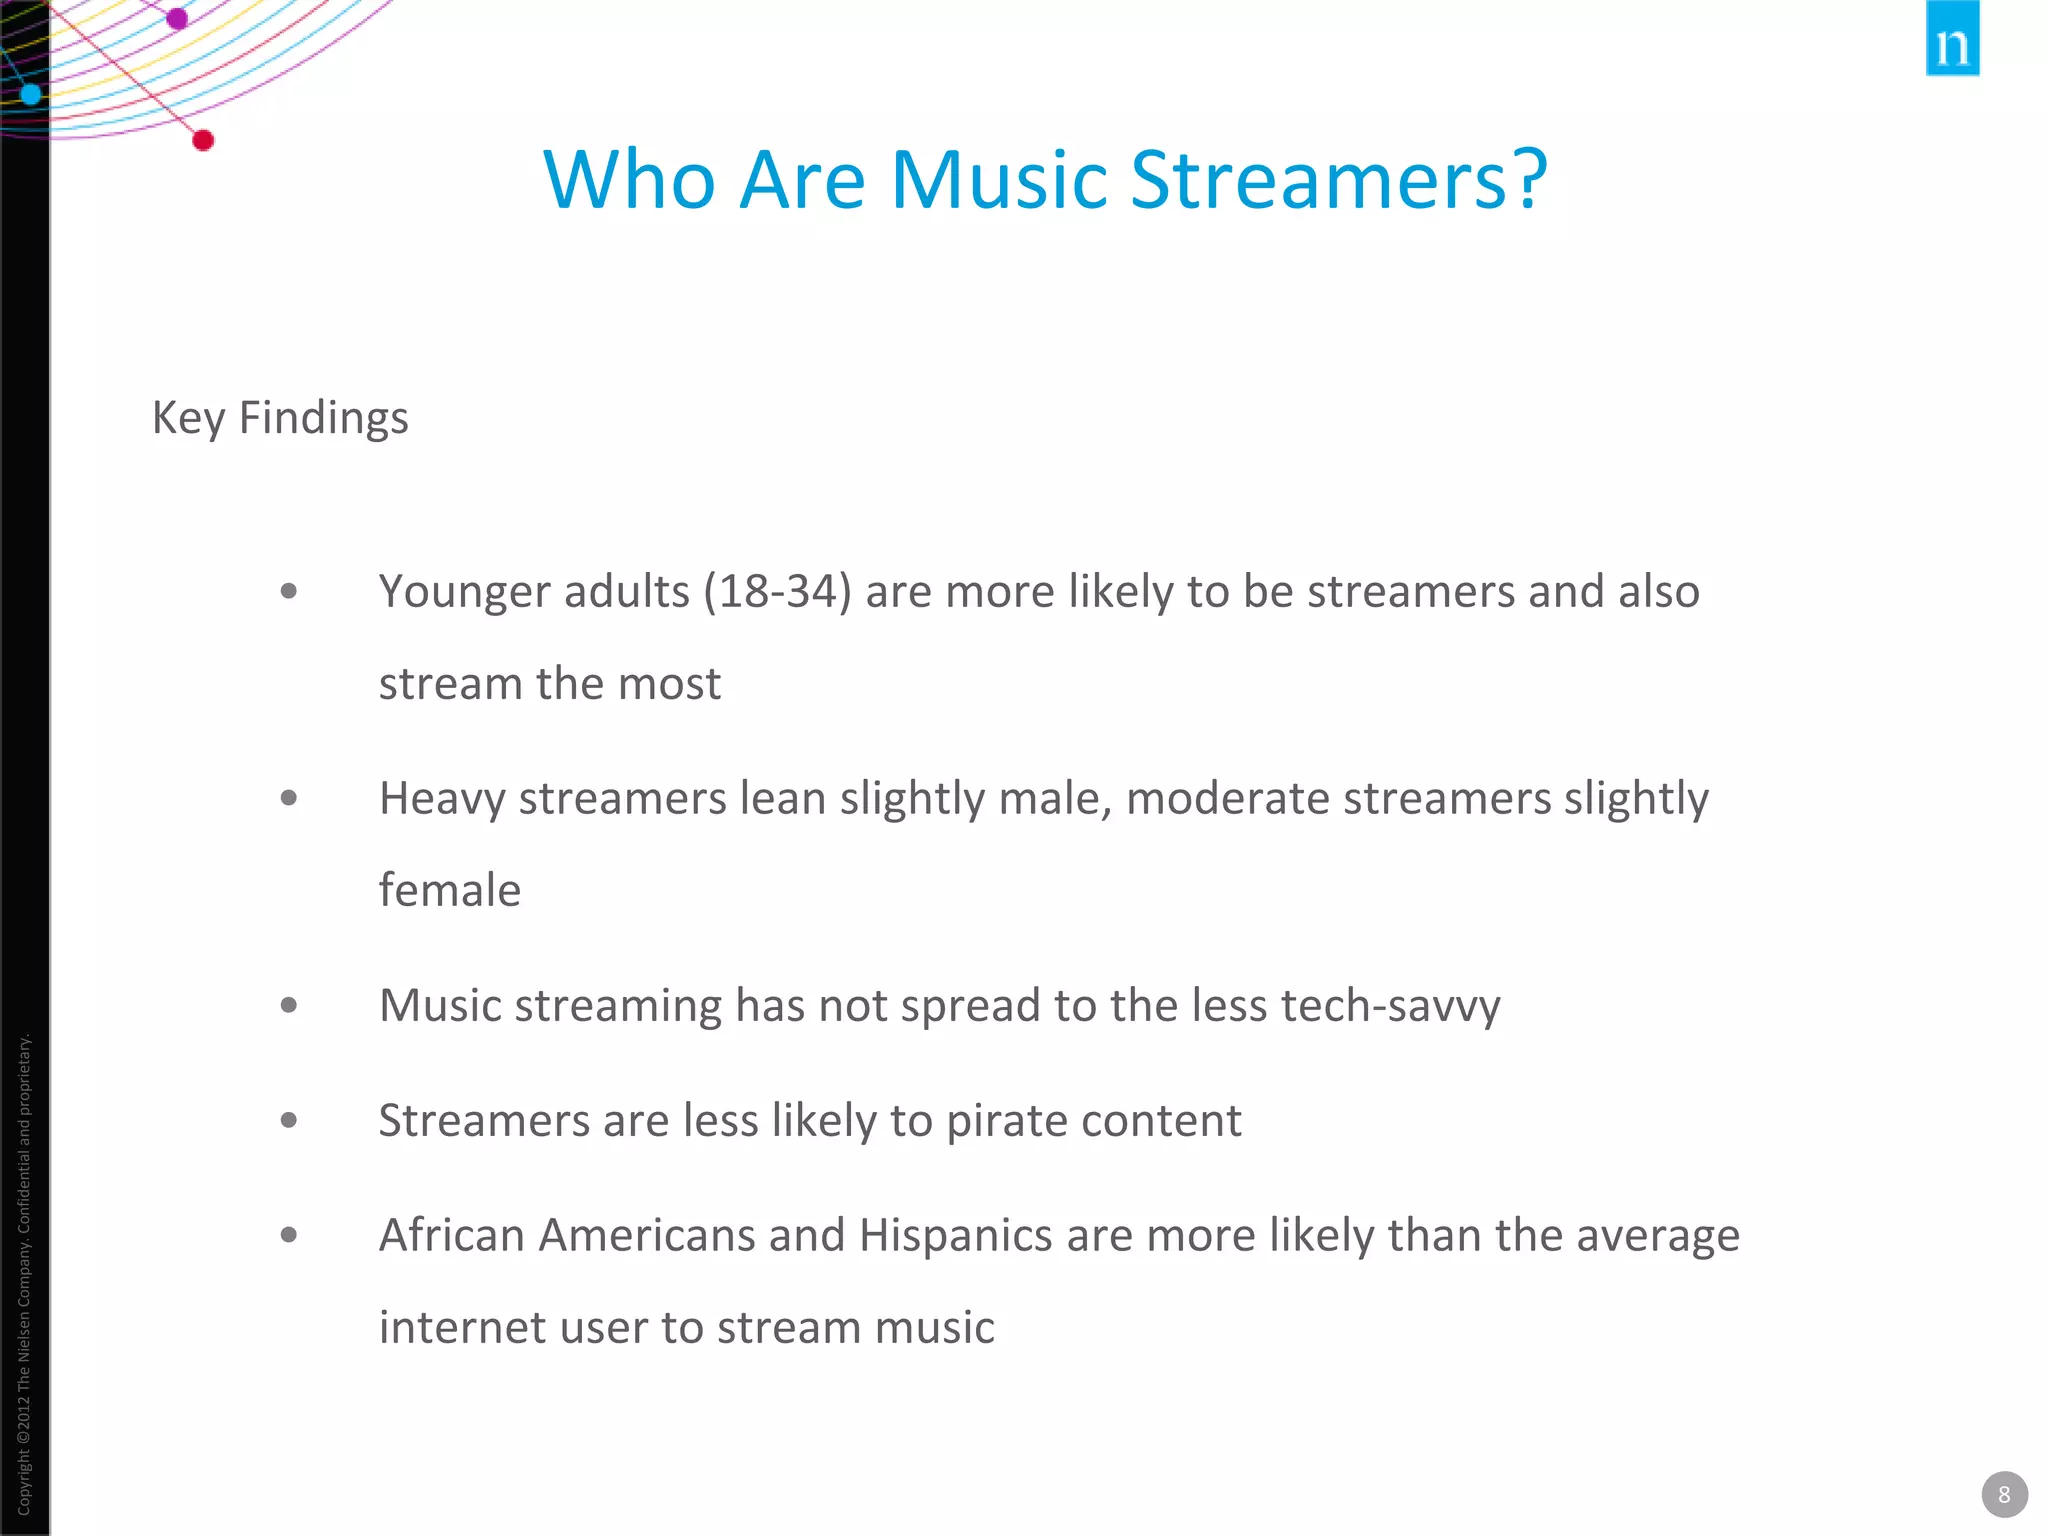
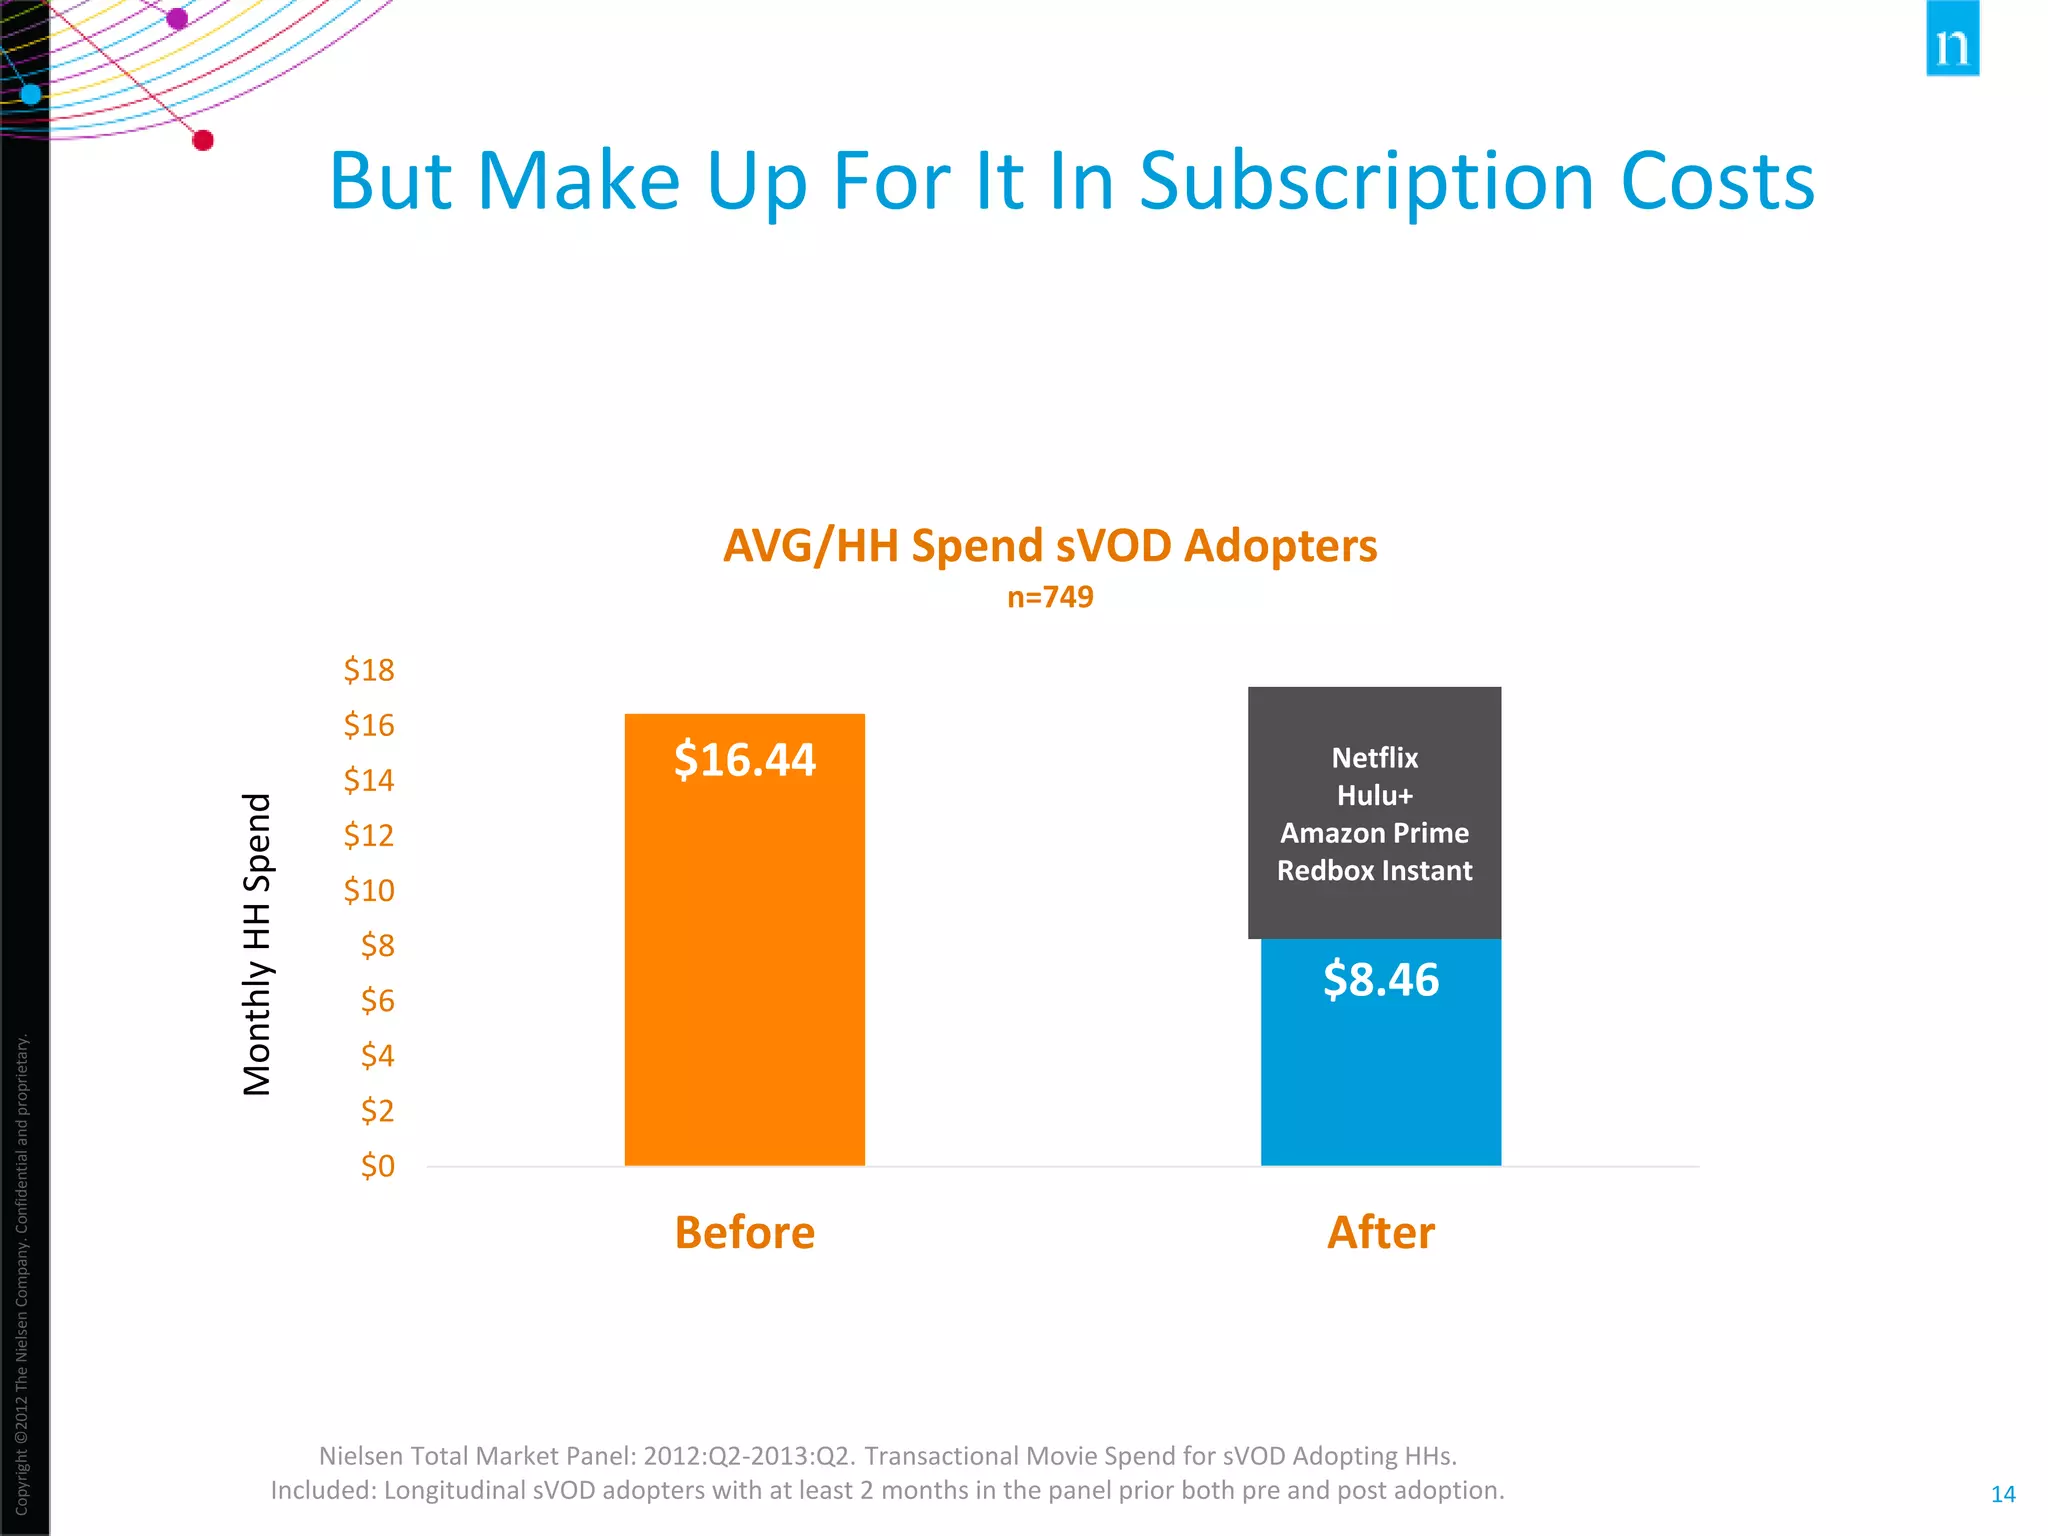
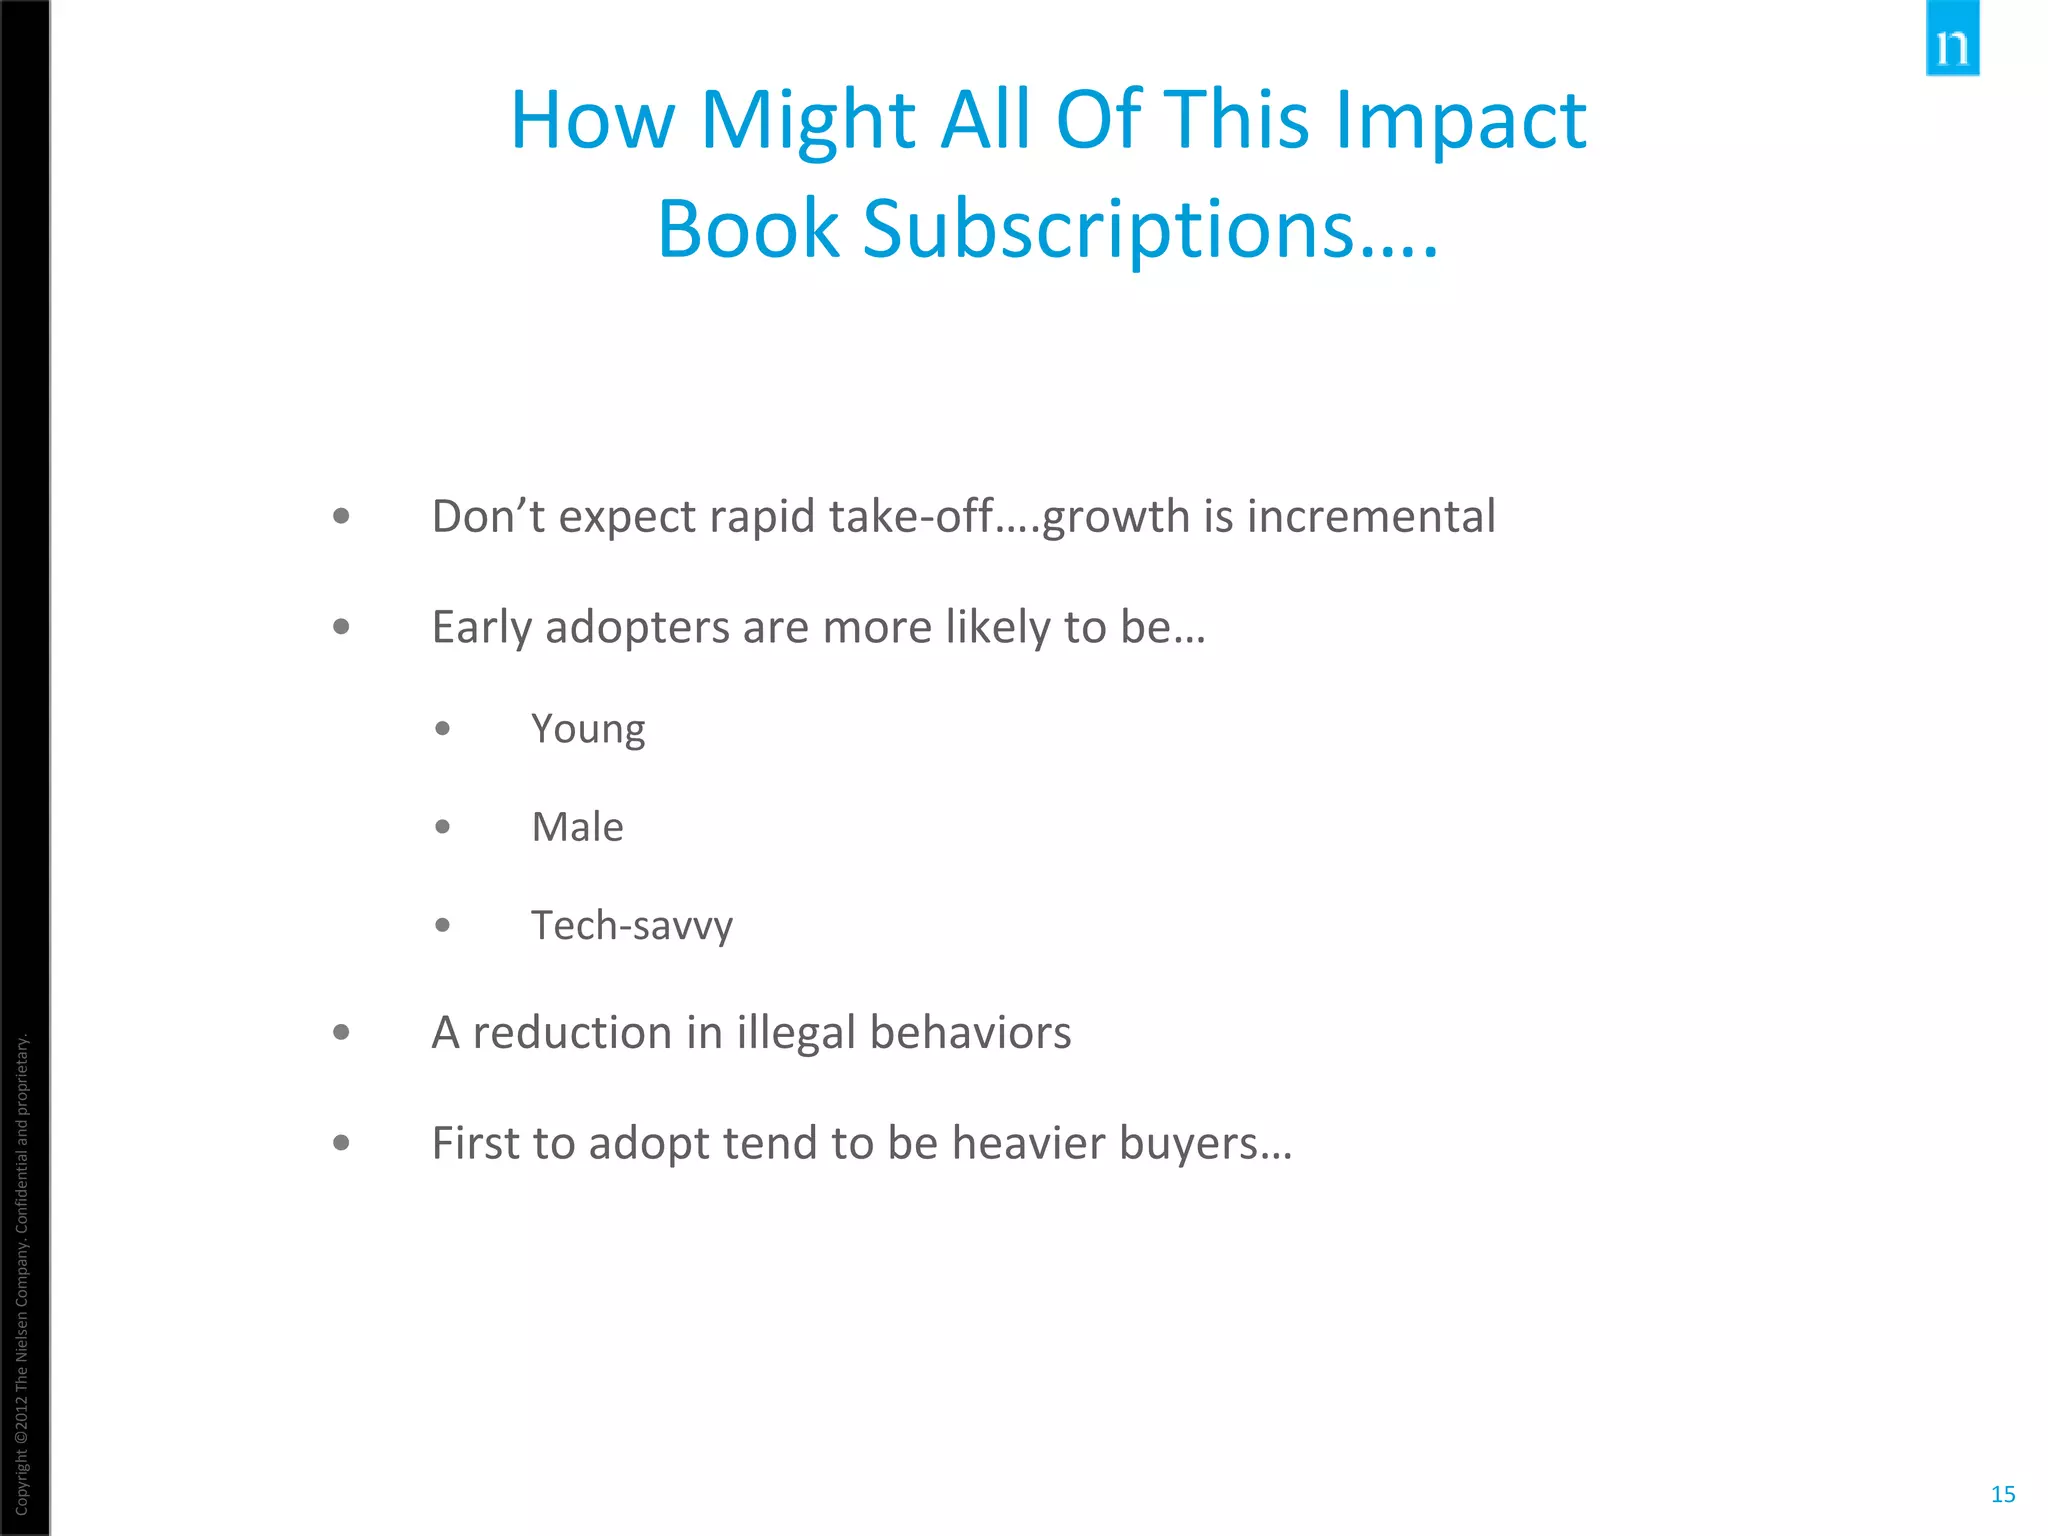
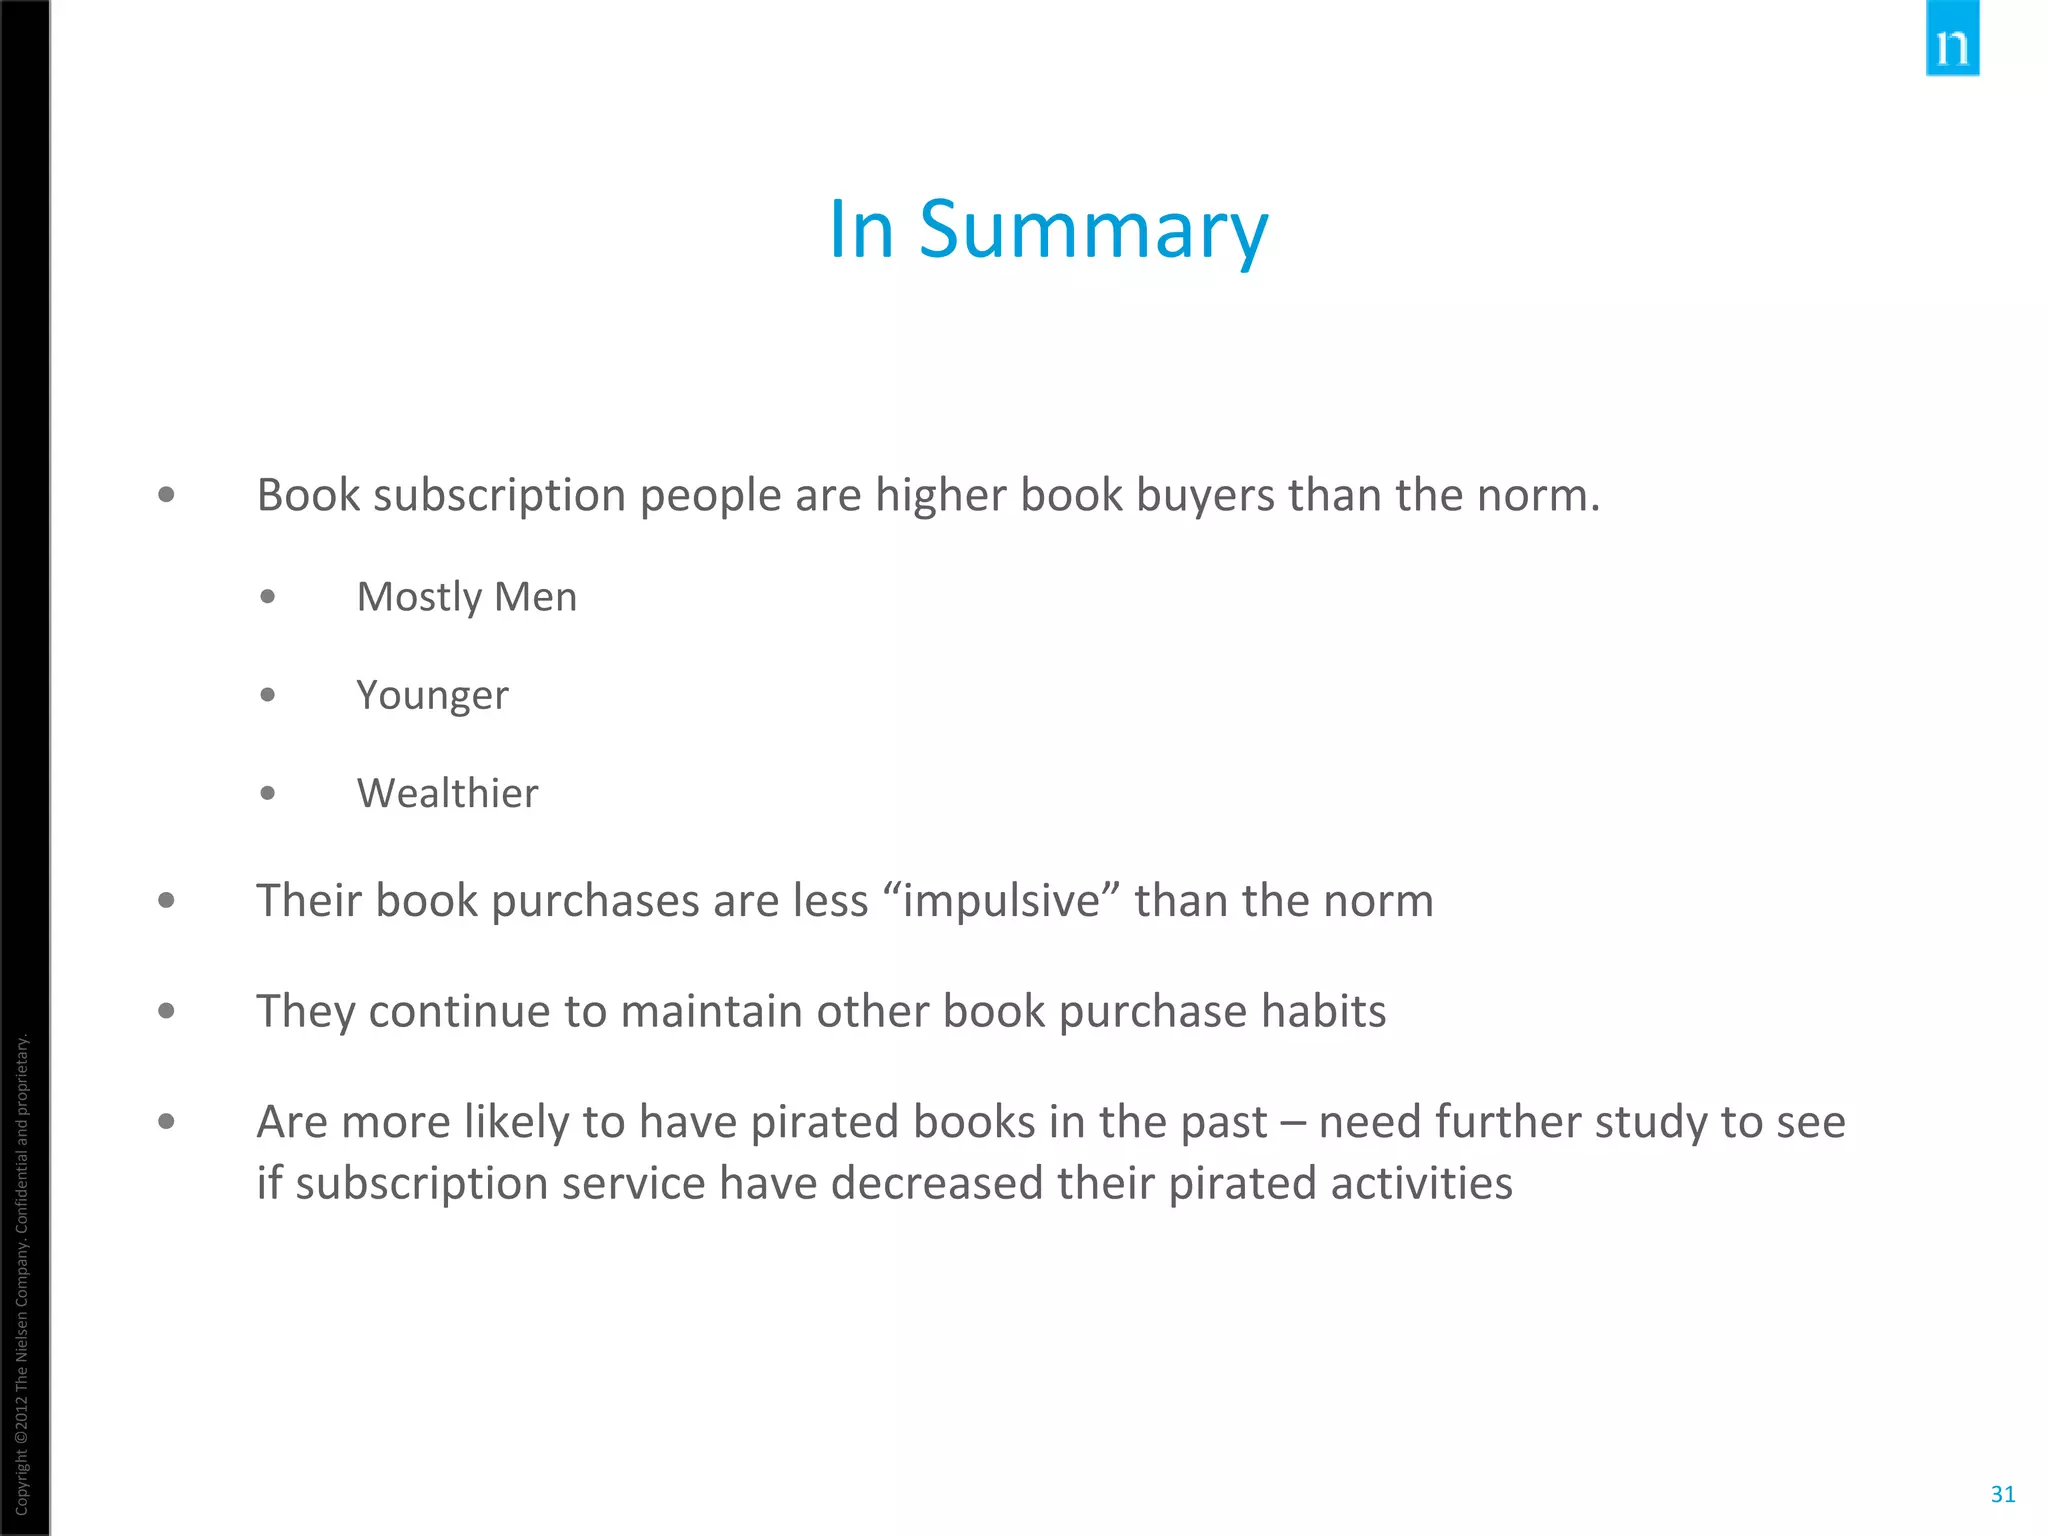
Subscription Services in the
Context of Market Trends
Q1 2014
Jonathan Stolper
May 2014
Copyright©2012TheNielsenCompany.Confidentialandproprietary.
2
Latest Nielsen Research:
• Streaming Music Subscription Services
• Streaming TV and Movies Subscription Services
• Book Subscription Services
.
Book Subscription Services Agenda
Copyright©2012TheNielsenCompany.Confidentialandproprietary.
3
STREAMING MUSIC SUBSCRIPTION SERVICES
How have subscription services faired in other entertainment sectors?
Copyright©2012TheNielsenCompany.Confidentialandproprietary.
4
Methodology/Data Sources
Data on Music Subscriptions:
Derived from NetView panel to analyze streaming behavior
• A representative panel of 220,000 US Internet users
• tracks consumer usage across all web sites and apps at work at home
and work
• Delivers high-quality audience data and analytics that are based on
observed behaviours at an individual user level (age 2+)
Copyright©2012TheNielsenCompany.Confidentialandproprietary.
5
Total Music Streams
Nielsen Entertainment– BDS Streaming Data Q1-’12 – Q3-’13
Longitudinal, non-video provider data: Cricket, MediaNet, Rdio, Rhapsody, Slacker,
Spotify
1,000
2,000
3,000
4,000
5,000
6,000
7,000
8,000
Q1-2012 Q2-2012 Q3-2012 Q4-2012 Q1-2013 Q2-2013 Q3-2013
Total Streams: Overall Growth
MM Streams
Copyright©2012TheNielsenCompany.Confidentialandproprietary.
6
Streaming Accounts for a Fifth of US Music Revenues
% of music revenues coming from streaming services
Copyright©2012TheNielsenCompany.Confidentialandproprietary.
7
0
5,000
10,000
15,000
20,000
25,000
30,000
35,000
40,000
Sep-11
Oct-11
Nov-11
Dec-11
Jan-12
Feb-12
Mar-12
Apr-12
May-12
Jun-12
Jul-12
Aug-12
Sep-12
Oct-12
Nov-12
Dec-12
Jan-13
Feb-13
Mar-13
Apr-13
May-13
Jun-13
Jul-13
Aug-13
Sep-13
Oct-13
Access To Sites and Services With Pirated Content Is
Decreasing…
Based on all who have accessed an illegal site or service
Source: Nielsen US NetView Panel Home and Work – Sept ‘11 – Oct ‘13
US internet users access sites
and services with illegitimate
content (10%)
22m
Users (,000’s) Reach
0%
2%
4%
6%
8%
10%
12%
14%
16%
18%
20%
Sep-11
Oct-11
Nov-11
Dec-11
Jan-12
Feb-12
Mar-12
Apr-12
May-12
Jun-12
Jul-12
Aug-12
Sep-12
Oct-12
Nov-12
Dec-12
Jan-13
Feb-13
Mar-13
Apr-13
May-13
Jun-13
Jul-13
Aug-13
Sep-13
Oct-13
Visitation to Pirate Sites and Services - Audience Size
Copyright©2012TheNielsenCompany.Confidentialandproprietary.
8
Who Are Music Streamers?
Key Findings
• Younger adults (18-34) are more likely to be streamers and also
stream the most
• Heavy streamers lean slightly male, moderate streamers slightly
female
• Music streaming has not spread to the less tech-savvy
• Streamers are less likely to pirate content
• African Americans and Hispanics are more likely than the average
internet user to stream music
Copyright©2012TheNielsenCompany.Confidentialandproprietary.
9
STREAMING TV & MOVIE SUBSCRIPTION
SERVICES
How have subscription services faired in other entertainment sectors?
Copyright©2012TheNielsenCompany.Confidentialandproprietary.
10
Methodology/Data Sources
Data on Movie/TV Subscriptions:
• Nielsen Total Home Entertainment Panel; Full Year 2013
• 3,000 households active per quarter
• Record all Movie and TV transactions across all retailers, devices, and
platforms
• A longitudinal view, tracking panelists behavior over time
Copyright©2012TheNielsenCompany.Confidentialandproprietary.
11
Streaming TV & Movies Subscription Services Are On the Rise
Especially in last 9-Months
19.9% 19.3%
18.2%
19.2%
21.2%
18.7%
22.7%
25.4%
0.0%
5.0%
10.0%
15.0%
20.0%
25.0%
30.0%
Q2 2012 Q3 2012 Q4 2012 Q1 2013 Q2 2013 Q3 2013 Q4 2013 Q1 2014
HH Penetration
Copyright©2012TheNielsenCompany.Confidentialandproprietary.
12
Streaming Is Primarily Used for Television
Types of Content: %ofStreams %ofSubscription
Streams
Television 81.0% 80.3%
Movies 19.0% 19.7%
Action/Adventure 4.8% 5.4%
Comedy 2.4% 2.6%
Drama 3.5% 4.2%
Family 3.0% 3.0%
SciFi 1.0% 1.0%
Horror 1.9% 1.3%
Source: Nielsen Total Home Entertainment Panel; Full Year 2013
Copyright©2012TheNielsenCompany.Confidentialandproprietary.
13Nielsen Total Market Panel: 2012:Q2-2013:Q2. Transactional Movie Spend By SVOD vs. Non-SVOD Households
$0
$5
$10
$15
$20
$25
$30
$35
$40
SVOD HHs NON SVOD HHs
Avg Quarterly SpendQuarterlyHHSpend
Streamers Spend Less on Transactional Content
Copyright©2012TheNielsenCompany.Confidentialandproprietary.
14
Nielsen Total Market Panel: 2012:Q2-2013:Q2. Transactional Movie Spend for sVOD Adopting HHs.
Included: Longitudinal sVOD adopters with at least 2 months in the panel prior both pre and post adoption.
$16.44
$8.46
$0
$2
$4
$6
$8
$10
$12
$14
$16
$18
Before After
AVG/HH Spend sVOD Adopters
n=749
MonthlyHHSpend
Netflix
Hulu+
Amazon Prime
Redbox Instant
But Make Up For It In Subscription Costs
Copyright©2012TheNielsenCompany.Confidentialandproprietary.
15
How Might All Of This Impact
Book Subscriptions….
• Don’t expect rapid take-off….growth is incremental
• Early adopters are more likely to be…
• Young
• Male
• Tech-savvy
• A reduction in illegal behaviors
• First to adopt tend to be heavier buyers…
Copyright©2012TheNielsenCompany.Confidentialandproprietary.
16
BOOK SUBSCRIPTION SERVICES
So how are book subscription services playing out in the book industry?
Copyright©2012TheNielsenCompany.Confidentialandproprietary.
17
Books & Consumers Methodology
US & UK consumer market tracker studies providing demographic and psychographic information on
today’s book buyer:
 6,000 book buyers per month in US drawn from a national representative sample
• 75 questions about book and ebook purchasing
• ~72,000 book consumers annually
• ~200,000 book purchases annually
Deliverables:
 Annual Reviews
 Industry Standard Quarterly Reports
 Genre Landscapes – quarterly
 GenreProfiles – annual
 Adhoc analysis
 Return to sample
 Syndicated Deep-Dives e.g. Children’s, Ebook Consumers, Travel
Developments:
 B&C lite and dashboard solution
 Retailers, AGFA, device manufacturers
 Segmentation and clustering studies
 Forecasting
Copyright©2012TheNielsenCompany.Confidentialandproprietary.
18
Books & Consumers Coverage
Book buyers Books bought
What?
Where?
When?
Demographics
Media usage
Leisure habits
Why?
Who for?
Book spend
Sex, age, region, socio-economic, family
Newspapers, magazines, devices, social media
Online, offline, cultural
Publisher, format, genre,
author, price, discounting
Channel, retailer
Month, quarter, YTD
Discovery, influences, use
Sex & age, relationship,
occasion
Reading attitudes
Copyright©2012TheNielsenCompany.Confidentialandproprietary.
19
Book Buyer Activities in Q1 2014
0% 10% 20% 30% 40% 50% 60% 70%
None of the above
Took out a subscription to read ebooks where you pay a monthly fee
to download a number of books (e,.g, via Safari Online, Oyster, etc.)
Read a book in serialized form
Went to an e-bookstore and e-reading platform that lets you pay only
for what you read
Subscribed to AmazonPrime and downloaded a Kindle book to
borrow for free each month from the Kindle Owners' Lending Library
Subscribed to AmazonPrime and downloaded streaming content of
movies and/or TV shows with Prime Instant Video
Downloaded a book related 'app' to a device such as a smartphone,
tablet, or ereader either free or paid for separately
Went on vacation to a destination significantly far from your home
(personal, not business)
Visited a public library either in-person or online
Purchased one or more books (any type, such as, hard cover,
paperback, audio, e-book, etc.)
Cooked using recipies
4%
9%
17%
17%
16%
23%
33%
40%
56%
68%
68%
Nielsen Books & Consumers Monthly Survey
Respondent Level Summary (Book Buyers ~6,000 per month)
Copyright©2012TheNielsenCompany.Confidentialandproprietary.
20
Most Popular Subscription Services (of the 9%)
Nielsen Books & Consumers Monthly Survey
Respondent Level Summary (Book Buyers ~6,000 per month)
0% 10% 20% 30% 40% 50% 60% 70% 80%
Other, please specify
24Symbols
Entitle (formerly eReatah)
SkillSoft (Harper Collins)
Scribd
Direct from another publisher
Harlequin
Oyster
Safari Online
AmazonPrime
4%
17%
19%
22%
23%
23%
23%
27%
34%
79%
Q1 2014
Copyright©2012TheNielsenCompany.Confidentialandproprietary.
21
Book Buyer Activities in Q1 2014
0% 10% 20% 30% 40% 50% 60% 70%
None of the above
Took out a subscription to read ebooks where you pay a monthly fee
to download a number of books (e,.g, via Safari Online, Oyster, etc.)
Read a book in serialized form
Went to an e-bookstore and e-reading platform that lets you pay only
for what you read
Subscribed to AmazonPrime and downloaded a Kindle book to
borrow for free each month from the Kindle Owners' Lending Library
Subscribed to AmazonPrime and downloaded streaming content of
movies and/or TV shows with Prime Instant Video
Downloaded a book related 'app' to a device such as a smartphone,
tablet, or ereader either free or paid for separately
Went on vacation to a destination significantly far from your home
(personal, not business)
Visited a public library either in-person or online
Purchased one or more books (any type, such as, hard cover,
paperback, audio, e-book, etc.)
Cooked using recipies
4%
5%
17%
17%
16%
23%
33%
40%
56%
68%
68%
Nielsen Books & Consumers Monthly Survey
Respondent Level Summary (Book Buyers ~6,000 per month)
Copyright©2012TheNielsenCompany.Confidentialandproprietary.
22
How Do Subscribers Compare (Gender)?
Nielsen Books & Consumers Monthly Survey
Respondent Level Summary (Book Buyers ~6,000 per month)
0% 20% 40% 60% 80% 100%
Purchased one or more books (any format.)
Visited a public library either in-person or online
Downloaded a book related 'app' to a device such as a smartphone,
tablet, or ereader either free or paid for separately
Went to an e-bookstore and e-reading platform that lets you pay only
for what you read
Subscribed to AmazonPrime and downloaded a Kindle book to
borrow for free each month from the Kindle Owners' Lending Library
Subscribed to AmazonPrime and downloaded streaming content of
movies and/or TV shows with Prime Instant Video
Took out a subscription to read ebooks where you pay a monthly fee
to download a number of books (e,.g, via Safari Online, Oyster, etc.)
46.4%
48.7%
52.6%
53.7%
55.7%
56.4%
60.8%
53.6%
51.3%
47.4%
46.3%
44.3%
43.6%
39.2%
Male Female
Copyright©2012TheNielsenCompany.Confidentialandproprietary.
23
How Do Subscription Services Compare?
Nielsen Books & Consumers Monthly Survey
Respondent Level Summary (Book Buyers ~6,000 per month)
0% 20% 40% 60% 80% 100%
Scribd
Safari
Online
Oyster
AmazonP
rime
61.1%
62.1%
60.4%
60.6%
38.9%
37.9%
39.6%
39.4%
Male Female
Copyright©2012TheNielsenCompany.Confidentialandproprietary.
24
How Do Subscribers Compare (Age)?
Nielsen Books & Consumers Monthly Survey
Respondent Level Summary (Book Buyers ~6,000 per month)
0% 20% 40% 60% 80% 100%
Purchased one or more books (any type, such as, hard cover,
paperback, audio, e-book, etc.)
Visited a public library either in-person or online
Downloaded a book related 'app' to a device such as a
smartphone, tablet, or ereader either free or paid for separately
Subscribed to AmazonPrime and downloaded streaming content
of movies and/or TV shows with Prime Instant Video
Went to an e-bookstore and e-reading platform that lets you
pay only for what you read
Subscribed to AmazonPrime and downloaded a Kindle book to
borrow for free each month from the Kindle Owners' Lending
Library
Took out a subscription to read ebooks where you pay a
monthly fee to download a number of books (e,.g, via Safari
Online, Oyster, etc.)
27.3%
28.1%
36.4%
36.5%
36.8%
37.4%
40.5%
27.5%
28.4%
32.5%
34.9%
35.0%
36.8%
40.0%
13-17 Yrs 18-29 Yrs 30-44 Yrs 45-54 Yrs 55-64 Yrs 65+ Yrs
Copyright©2012TheNielsenCompany.Confidentialandproprietary.
25
How do Subscription Services Compare?
Nielsen Books & Consumers Monthly Survey
Respondent Level Summary (Book Buyers ~6,000 per month)
0% 20% 40% 60% 80% 100%
Scribd
Safari Online
Oyster
AmazonPrime
7.6%
11.2%
9.4%
8.3%
39.7%
41.8%
42.5%
40.8%
49.6%
42.2%
46.2%
42.9%
3.1%
3.0%
1.9%
4.1%
0.0%
1.3%
0.0%
2.5%
0.0%
0.4%
0.0%
1.4%
13-17 Yrs 18-29 Yrs 30-44 Yrs 45-54 Yrs 55-64 Yrs 65+ Yrs
Copyright©2012TheNielsenCompany.Confidentialandproprietary.
26
How do Subscribers Compare (Income)?
Nielsen Books & Consumers Monthly Survey
Respondent Level Summary (Book Buyers ~6,000 per month)
0%
20%
40%
60%
80%
100%
Visited a
public library
either in-
person or
online
Purchased one
or more books
(any type,
such as, hard
cover,
paperback,
audio, e-book,
etc.)
Downloaded a
book related
'app' to a
device such as
a smartphone,
tablet, or
ereader either
free or paid
for separately
Took out a
subscription
to read
ebooks where
you pay a
monthly fee to
download a
number of
books (e,.g,
via Safari
Online,
Oyster, etc.)
Subscribed to
AmazonPrime
and
downloaded
streaming
content of
movies and/or
TV shows with
Prime Instant
Video
Subscribed to
AmazonPrime
and
downloaded a
Kindle book to
borrow for
free each
month from
the Kindle
Owners'
Lending
Library
Went to an e-
bookstore and
e-reading
platform that
lets you pay
only for what
you read
13.4% 14.0% 15.1%
20.4%
17.0% 17.7% 17.9%
9.5% 10.0% 10.8%
13.4% 12.6% 12.6% 11.6%
4.4% 5.0% 5.9% 7.4% 6.3% 7.1% 6.0%
$150,000 and over
$100,000-$149,999
$75,000-$99,999
$50,000-$74,999
$35,000-$49,999
$25,000-$34,999
$15,000-$24,999
Under $15,000
Copyright©2012TheNielsenCompany.Confidentialandproprietary.
27
How do Subscription Services Compare?
Nielsen Books & Consumers Monthly Survey
Respondent Level Summary (Book Buyers ~6,000 per month)
0%
20%
40%
60%
80%
100%
AmazonPrime Oyster Safari Online Scribd
5.5% 4.7% 6.5% 7.6%
4.8% 3.8% 2.6%
5.3%
9.9%
7.5% 8.6% 3.8%
13.1%
11.3%
14.7%
10.7%
24.0%
25.5%
26.3%
21.4%
21.2%
17.9%
17.7%
24.4%
14.7%
18.9%
15.1%
17.6%
6.7%
10.4% 8.6% 9.1% $150,000 and over
$100,000-$149,000
$75,000-$99,999
$50,000-$74,999
$35,000-$49,999
$25,000-$34,999
$15,000-$24,999
Under $15,000
Copyright©2012TheNielsenCompany.Confidentialandproprietary.
28
Subscribers Continue to Shop for Books in Other Outlets
$60.80
$105.80
$10.00
$-
$20.00
$40.00
$60.00
$80.00
$100.00
$120.00
$140.00
Non-Subscribers Subscribers
Monthly Fee
Book Transactions
4.9 books
7.7 books
Copyright©2012TheNielsenCompany.Confidentialandproprietary.
29
Subscribers Are More Likely to Plan Book Acquisition
51%
36%
22%
23%
12%
17%
15%
25%
0%
10%
20%
30%
40%
50%
60%
70%
80%
90%
100%
Yes No
Not Planned, Impulse purchase
Planned a book at that specific
time, but not specific bk
Planned this specific book, but
not at that specific time
Planned this specific book at
that specific time
Copyright©2012TheNielsenCompany.Confidentialandproprietary.
30
Book Subscribers Are More Likely to Have Also
Pirated Books in the Last 6-months
20%
17%
15%
14%
7%
5%
2%
3%
0%
5%
10%
15%
20%
25%
Obtain from a friend via IM e-
mail or flash drive
Download from a public/open
torrent site like The Pirate Bay
or another torrent site or
service.
Download from a public/open
cyberlocker such as RapidShare
or Megaupload
Obtain from a friend via a closed
internal network like Dropbox or
cloud systems
Yes
No
Copyright©2012TheNielsenCompany.Confidentialandproprietary.
31
In Summary
• Book subscription people are higher book buyers than the norm.
• Mostly Men
• Younger
• Wealthier
• Their book purchases are less “impulsive” than the norm
• They continue to maintain other book purchase habits
• Are more likely to have pirated books in the past – need further study to see
if subscription service have decreased their pirated activities
Copyright©2012TheNielsenCompany.Confidentialandproprietary.
32
Ideas For Further Study…
• Adoption, Loyalty, Substitution
• Content, Selection
• Attracting a Wider Audience
Subscription Services in the Context of Market Trends, presented by Jonathan Stolper, SVP Nielsen Book Americas, at Making Information Pay 2014, a track of IDPF's Digital Book 2014 at Book Expo America, on May 29, 2014

Subscription Services in the Context of Market Trends, presented by Jonathan Stolper, SVP Nielsen Book Americas, at Making Information Pay 2014, a track of IDPF's Digital Book 2014 at Book Expo America, on May 29, 2014

  • 1.
    Subscription Services inthe Context of Market Trends Q1 2014 Jonathan Stolper May 2014
  • 2.
    Copyright©2012TheNielsenCompany.Confidentialandproprietary. 2 Latest Nielsen Research: •Streaming Music Subscription Services • Streaming TV and Movies Subscription Services • Book Subscription Services . Book Subscription Services Agenda
  • 3.
    Copyright©2012TheNielsenCompany.Confidentialandproprietary. 3 STREAMING MUSIC SUBSCRIPTIONSERVICES How have subscription services faired in other entertainment sectors?
  • 4.
    Copyright©2012TheNielsenCompany.Confidentialandproprietary. 4 Methodology/Data Sources Data onMusic Subscriptions: Derived from NetView panel to analyze streaming behavior • A representative panel of 220,000 US Internet users • tracks consumer usage across all web sites and apps at work at home and work • Delivers high-quality audience data and analytics that are based on observed behaviours at an individual user level (age 2+)
  • 5.
    Copyright©2012TheNielsenCompany.Confidentialandproprietary. 5 Total Music Streams NielsenEntertainment– BDS Streaming Data Q1-’12 – Q3-’13 Longitudinal, non-video provider data: Cricket, MediaNet, Rdio, Rhapsody, Slacker, Spotify 1,000 2,000 3,000 4,000 5,000 6,000 7,000 8,000 Q1-2012 Q2-2012 Q3-2012 Q4-2012 Q1-2013 Q2-2013 Q3-2013 Total Streams: Overall Growth MM Streams
  • 6.
    Copyright©2012TheNielsenCompany.Confidentialandproprietary. 6 Streaming Accounts fora Fifth of US Music Revenues % of music revenues coming from streaming services
  • 7.
    Copyright©2012TheNielsenCompany.Confidentialandproprietary. 7 0 5,000 10,000 15,000 20,000 25,000 30,000 35,000 40,000 Sep-11 Oct-11 Nov-11 Dec-11 Jan-12 Feb-12 Mar-12 Apr-12 May-12 Jun-12 Jul-12 Aug-12 Sep-12 Oct-12 Nov-12 Dec-12 Jan-13 Feb-13 Mar-13 Apr-13 May-13 Jun-13 Jul-13 Aug-13 Sep-13 Oct-13 Access To Sitesand Services With Pirated Content Is Decreasing… Based on all who have accessed an illegal site or service Source: Nielsen US NetView Panel Home and Work – Sept ‘11 – Oct ‘13 US internet users access sites and services with illegitimate content (10%) 22m Users (,000’s) Reach 0% 2% 4% 6% 8% 10% 12% 14% 16% 18% 20% Sep-11 Oct-11 Nov-11 Dec-11 Jan-12 Feb-12 Mar-12 Apr-12 May-12 Jun-12 Jul-12 Aug-12 Sep-12 Oct-12 Nov-12 Dec-12 Jan-13 Feb-13 Mar-13 Apr-13 May-13 Jun-13 Jul-13 Aug-13 Sep-13 Oct-13 Visitation to Pirate Sites and Services - Audience Size
  • 8.
    Copyright©2012TheNielsenCompany.Confidentialandproprietary. 8 Who Are MusicStreamers? Key Findings • Younger adults (18-34) are more likely to be streamers and also stream the most • Heavy streamers lean slightly male, moderate streamers slightly female • Music streaming has not spread to the less tech-savvy • Streamers are less likely to pirate content • African Americans and Hispanics are more likely than the average internet user to stream music
  • 9.
    Copyright©2012TheNielsenCompany.Confidentialandproprietary. 9 STREAMING TV &MOVIE SUBSCRIPTION SERVICES How have subscription services faired in other entertainment sectors?
  • 10.
    Copyright©2012TheNielsenCompany.Confidentialandproprietary. 10 Methodology/Data Sources Data onMovie/TV Subscriptions: • Nielsen Total Home Entertainment Panel; Full Year 2013 • 3,000 households active per quarter • Record all Movie and TV transactions across all retailers, devices, and platforms • A longitudinal view, tracking panelists behavior over time
  • 11.
    Copyright©2012TheNielsenCompany.Confidentialandproprietary. 11 Streaming TV &Movies Subscription Services Are On the Rise Especially in last 9-Months 19.9% 19.3% 18.2% 19.2% 21.2% 18.7% 22.7% 25.4% 0.0% 5.0% 10.0% 15.0% 20.0% 25.0% 30.0% Q2 2012 Q3 2012 Q4 2012 Q1 2013 Q2 2013 Q3 2013 Q4 2013 Q1 2014 HH Penetration
  • 12.
    Copyright©2012TheNielsenCompany.Confidentialandproprietary. 12 Streaming Is PrimarilyUsed for Television Types of Content: %ofStreams %ofSubscription Streams Television 81.0% 80.3% Movies 19.0% 19.7% Action/Adventure 4.8% 5.4% Comedy 2.4% 2.6% Drama 3.5% 4.2% Family 3.0% 3.0% SciFi 1.0% 1.0% Horror 1.9% 1.3% Source: Nielsen Total Home Entertainment Panel; Full Year 2013
  • 13.
    Copyright©2012TheNielsenCompany.Confidentialandproprietary. 13Nielsen Total MarketPanel: 2012:Q2-2013:Q2. Transactional Movie Spend By SVOD vs. Non-SVOD Households $0 $5 $10 $15 $20 $25 $30 $35 $40 SVOD HHs NON SVOD HHs Avg Quarterly SpendQuarterlyHHSpend Streamers Spend Less on Transactional Content
  • 14.
    Copyright©2012TheNielsenCompany.Confidentialandproprietary. 14 Nielsen Total MarketPanel: 2012:Q2-2013:Q2. Transactional Movie Spend for sVOD Adopting HHs. Included: Longitudinal sVOD adopters with at least 2 months in the panel prior both pre and post adoption. $16.44 $8.46 $0 $2 $4 $6 $8 $10 $12 $14 $16 $18 Before After AVG/HH Spend sVOD Adopters n=749 MonthlyHHSpend Netflix Hulu+ Amazon Prime Redbox Instant But Make Up For It In Subscription Costs
  • 15.
    Copyright©2012TheNielsenCompany.Confidentialandproprietary. 15 How Might AllOf This Impact Book Subscriptions…. • Don’t expect rapid take-off….growth is incremental • Early adopters are more likely to be… • Young • Male • Tech-savvy • A reduction in illegal behaviors • First to adopt tend to be heavier buyers…
  • 16.
    Copyright©2012TheNielsenCompany.Confidentialandproprietary. 16 BOOK SUBSCRIPTION SERVICES Sohow are book subscription services playing out in the book industry?
  • 17.
    Copyright©2012TheNielsenCompany.Confidentialandproprietary. 17 Books & ConsumersMethodology US & UK consumer market tracker studies providing demographic and psychographic information on today’s book buyer:  6,000 book buyers per month in US drawn from a national representative sample • 75 questions about book and ebook purchasing • ~72,000 book consumers annually • ~200,000 book purchases annually Deliverables:  Annual Reviews  Industry Standard Quarterly Reports  Genre Landscapes – quarterly  GenreProfiles – annual  Adhoc analysis  Return to sample  Syndicated Deep-Dives e.g. Children’s, Ebook Consumers, Travel Developments:  B&C lite and dashboard solution  Retailers, AGFA, device manufacturers  Segmentation and clustering studies  Forecasting
  • 18.
    Copyright©2012TheNielsenCompany.Confidentialandproprietary. 18 Books & ConsumersCoverage Book buyers Books bought What? Where? When? Demographics Media usage Leisure habits Why? Who for? Book spend Sex, age, region, socio-economic, family Newspapers, magazines, devices, social media Online, offline, cultural Publisher, format, genre, author, price, discounting Channel, retailer Month, quarter, YTD Discovery, influences, use Sex & age, relationship, occasion Reading attitudes
  • 19.
    Copyright©2012TheNielsenCompany.Confidentialandproprietary. 19 Book Buyer Activitiesin Q1 2014 0% 10% 20% 30% 40% 50% 60% 70% None of the above Took out a subscription to read ebooks where you pay a monthly fee to download a number of books (e,.g, via Safari Online, Oyster, etc.) Read a book in serialized form Went to an e-bookstore and e-reading platform that lets you pay only for what you read Subscribed to AmazonPrime and downloaded a Kindle book to borrow for free each month from the Kindle Owners' Lending Library Subscribed to AmazonPrime and downloaded streaming content of movies and/or TV shows with Prime Instant Video Downloaded a book related 'app' to a device such as a smartphone, tablet, or ereader either free or paid for separately Went on vacation to a destination significantly far from your home (personal, not business) Visited a public library either in-person or online Purchased one or more books (any type, such as, hard cover, paperback, audio, e-book, etc.) Cooked using recipies 4% 9% 17% 17% 16% 23% 33% 40% 56% 68% 68% Nielsen Books & Consumers Monthly Survey Respondent Level Summary (Book Buyers ~6,000 per month)
  • 20.
    Copyright©2012TheNielsenCompany.Confidentialandproprietary. 20 Most Popular SubscriptionServices (of the 9%) Nielsen Books & Consumers Monthly Survey Respondent Level Summary (Book Buyers ~6,000 per month) 0% 10% 20% 30% 40% 50% 60% 70% 80% Other, please specify 24Symbols Entitle (formerly eReatah) SkillSoft (Harper Collins) Scribd Direct from another publisher Harlequin Oyster Safari Online AmazonPrime 4% 17% 19% 22% 23% 23% 23% 27% 34% 79% Q1 2014
  • 21.
    Copyright©2012TheNielsenCompany.Confidentialandproprietary. 21 Book Buyer Activitiesin Q1 2014 0% 10% 20% 30% 40% 50% 60% 70% None of the above Took out a subscription to read ebooks where you pay a monthly fee to download a number of books (e,.g, via Safari Online, Oyster, etc.) Read a book in serialized form Went to an e-bookstore and e-reading platform that lets you pay only for what you read Subscribed to AmazonPrime and downloaded a Kindle book to borrow for free each month from the Kindle Owners' Lending Library Subscribed to AmazonPrime and downloaded streaming content of movies and/or TV shows with Prime Instant Video Downloaded a book related 'app' to a device such as a smartphone, tablet, or ereader either free or paid for separately Went on vacation to a destination significantly far from your home (personal, not business) Visited a public library either in-person or online Purchased one or more books (any type, such as, hard cover, paperback, audio, e-book, etc.) Cooked using recipies 4% 5% 17% 17% 16% 23% 33% 40% 56% 68% 68% Nielsen Books & Consumers Monthly Survey Respondent Level Summary (Book Buyers ~6,000 per month)
  • 22.
    Copyright©2012TheNielsenCompany.Confidentialandproprietary. 22 How Do SubscribersCompare (Gender)? Nielsen Books & Consumers Monthly Survey Respondent Level Summary (Book Buyers ~6,000 per month) 0% 20% 40% 60% 80% 100% Purchased one or more books (any format.) Visited a public library either in-person or online Downloaded a book related 'app' to a device such as a smartphone, tablet, or ereader either free or paid for separately Went to an e-bookstore and e-reading platform that lets you pay only for what you read Subscribed to AmazonPrime and downloaded a Kindle book to borrow for free each month from the Kindle Owners' Lending Library Subscribed to AmazonPrime and downloaded streaming content of movies and/or TV shows with Prime Instant Video Took out a subscription to read ebooks where you pay a monthly fee to download a number of books (e,.g, via Safari Online, Oyster, etc.) 46.4% 48.7% 52.6% 53.7% 55.7% 56.4% 60.8% 53.6% 51.3% 47.4% 46.3% 44.3% 43.6% 39.2% Male Female
  • 23.
    Copyright©2012TheNielsenCompany.Confidentialandproprietary. 23 How Do SubscriptionServices Compare? Nielsen Books & Consumers Monthly Survey Respondent Level Summary (Book Buyers ~6,000 per month) 0% 20% 40% 60% 80% 100% Scribd Safari Online Oyster AmazonP rime 61.1% 62.1% 60.4% 60.6% 38.9% 37.9% 39.6% 39.4% Male Female
  • 24.
    Copyright©2012TheNielsenCompany.Confidentialandproprietary. 24 How Do SubscribersCompare (Age)? Nielsen Books & Consumers Monthly Survey Respondent Level Summary (Book Buyers ~6,000 per month) 0% 20% 40% 60% 80% 100% Purchased one or more books (any type, such as, hard cover, paperback, audio, e-book, etc.) Visited a public library either in-person or online Downloaded a book related 'app' to a device such as a smartphone, tablet, or ereader either free or paid for separately Subscribed to AmazonPrime and downloaded streaming content of movies and/or TV shows with Prime Instant Video Went to an e-bookstore and e-reading platform that lets you pay only for what you read Subscribed to AmazonPrime and downloaded a Kindle book to borrow for free each month from the Kindle Owners' Lending Library Took out a subscription to read ebooks where you pay a monthly fee to download a number of books (e,.g, via Safari Online, Oyster, etc.) 27.3% 28.1% 36.4% 36.5% 36.8% 37.4% 40.5% 27.5% 28.4% 32.5% 34.9% 35.0% 36.8% 40.0% 13-17 Yrs 18-29 Yrs 30-44 Yrs 45-54 Yrs 55-64 Yrs 65+ Yrs
  • 25.
    Copyright©2012TheNielsenCompany.Confidentialandproprietary. 25 How do SubscriptionServices Compare? Nielsen Books & Consumers Monthly Survey Respondent Level Summary (Book Buyers ~6,000 per month) 0% 20% 40% 60% 80% 100% Scribd Safari Online Oyster AmazonPrime 7.6% 11.2% 9.4% 8.3% 39.7% 41.8% 42.5% 40.8% 49.6% 42.2% 46.2% 42.9% 3.1% 3.0% 1.9% 4.1% 0.0% 1.3% 0.0% 2.5% 0.0% 0.4% 0.0% 1.4% 13-17 Yrs 18-29 Yrs 30-44 Yrs 45-54 Yrs 55-64 Yrs 65+ Yrs
  • 26.
    Copyright©2012TheNielsenCompany.Confidentialandproprietary. 26 How do SubscribersCompare (Income)? Nielsen Books & Consumers Monthly Survey Respondent Level Summary (Book Buyers ~6,000 per month) 0% 20% 40% 60% 80% 100% Visited a public library either in- person or online Purchased one or more books (any type, such as, hard cover, paperback, audio, e-book, etc.) Downloaded a book related 'app' to a device such as a smartphone, tablet, or ereader either free or paid for separately Took out a subscription to read ebooks where you pay a monthly fee to download a number of books (e,.g, via Safari Online, Oyster, etc.) Subscribed to AmazonPrime and downloaded streaming content of movies and/or TV shows with Prime Instant Video Subscribed to AmazonPrime and downloaded a Kindle book to borrow for free each month from the Kindle Owners' Lending Library Went to an e- bookstore and e-reading platform that lets you pay only for what you read 13.4% 14.0% 15.1% 20.4% 17.0% 17.7% 17.9% 9.5% 10.0% 10.8% 13.4% 12.6% 12.6% 11.6% 4.4% 5.0% 5.9% 7.4% 6.3% 7.1% 6.0% $150,000 and over $100,000-$149,999 $75,000-$99,999 $50,000-$74,999 $35,000-$49,999 $25,000-$34,999 $15,000-$24,999 Under $15,000
  • 27.
    Copyright©2012TheNielsenCompany.Confidentialandproprietary. 27 How do SubscriptionServices Compare? Nielsen Books & Consumers Monthly Survey Respondent Level Summary (Book Buyers ~6,000 per month) 0% 20% 40% 60% 80% 100% AmazonPrime Oyster Safari Online Scribd 5.5% 4.7% 6.5% 7.6% 4.8% 3.8% 2.6% 5.3% 9.9% 7.5% 8.6% 3.8% 13.1% 11.3% 14.7% 10.7% 24.0% 25.5% 26.3% 21.4% 21.2% 17.9% 17.7% 24.4% 14.7% 18.9% 15.1% 17.6% 6.7% 10.4% 8.6% 9.1% $150,000 and over $100,000-$149,000 $75,000-$99,999 $50,000-$74,999 $35,000-$49,999 $25,000-$34,999 $15,000-$24,999 Under $15,000
  • 28.
    Copyright©2012TheNielsenCompany.Confidentialandproprietary. 28 Subscribers Continue toShop for Books in Other Outlets $60.80 $105.80 $10.00 $- $20.00 $40.00 $60.00 $80.00 $100.00 $120.00 $140.00 Non-Subscribers Subscribers Monthly Fee Book Transactions 4.9 books 7.7 books
  • 29.
    Copyright©2012TheNielsenCompany.Confidentialandproprietary. 29 Subscribers Are MoreLikely to Plan Book Acquisition 51% 36% 22% 23% 12% 17% 15% 25% 0% 10% 20% 30% 40% 50% 60% 70% 80% 90% 100% Yes No Not Planned, Impulse purchase Planned a book at that specific time, but not specific bk Planned this specific book, but not at that specific time Planned this specific book at that specific time
  • 30.
    Copyright©2012TheNielsenCompany.Confidentialandproprietary. 30 Book Subscribers AreMore Likely to Have Also Pirated Books in the Last 6-months 20% 17% 15% 14% 7% 5% 2% 3% 0% 5% 10% 15% 20% 25% Obtain from a friend via IM e- mail or flash drive Download from a public/open torrent site like The Pirate Bay or another torrent site or service. Download from a public/open cyberlocker such as RapidShare or Megaupload Obtain from a friend via a closed internal network like Dropbox or cloud systems Yes No
  • 31.
    Copyright©2012TheNielsenCompany.Confidentialandproprietary. 31 In Summary • Booksubscription people are higher book buyers than the norm. • Mostly Men • Younger • Wealthier • Their book purchases are less “impulsive” than the norm • They continue to maintain other book purchase habits • Are more likely to have pirated books in the past – need further study to see if subscription service have decreased their pirated activities
  • 32.
    Copyright©2012TheNielsenCompany.Confidentialandproprietary. 32 Ideas For FurtherStudy… • Adoption, Loyalty, Substitution • Content, Selection • Attracting a Wider Audience